


SIphotography/iStock via Getty Images
Introduction: Why is CHTR Stock Down?
Charter Communications, Inc. (NASDAQ:CHTR) held their first investor day under new CEO Chris Winfrey after markets closed on Tuesday (December 13). Investor reaction has been negative, with shares down 15% as of 2:30 pm EST Wednesday.
We originally initiated our Buy rating on CHTR in January 2020. Since then, Charter’s share price first rose by 62% by September 2021, before collapsing by 62% to 35% below the level at our initiation:
|
Charter Share Price (Last 5 Years) 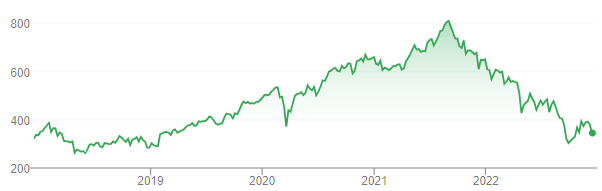 Source: Google Finance (14-Dec-22). |
We believe Charter shares are too cheap and the market reaction to the investor day so far is wrong. The main item from the investor day was a one-off increase in Charter’s capital expenditures during 2023-25. One part of this is Charter’s Rural Construction Initiative, much of which was previously known and is likely to generate a teens Internal Rate of Return (“IRR”). The other part of this is a one-off $5.5bn “Network Evolution” CapEx, the bulk of which will be in 2024-25, that will allow Charter to offer a download speed of 5 Gbps+ in 85% of its footprint. There was little update on Charter’s current business, where management still targets a “significantly higher” Internet subscriber net add in 2023. Relative to the most recent quarter, Charter has a Free Cash Flow (“FCF”) Yield of more than 10%; we believe FCF/Share will grow to $61 by 2025, With shares at $333.18, we expect an exit price of $937 and a total return of 181% (40.3% annualized) by 2025 year-end. Buy.
Charter Buy Case Recap
Our Charter investment case has been based on the following:
- Internet revenues growing from both customer numbers and Average Revenue Per User, new household formation, network “edge out” expansion, structurally-growing demand and pricing power
- Existing Cable infrastructure has competitive speeds and low upgrade costs, and Charter has further increased its customer stickiness by improving customer service and bundling adjacent value-add products
- Overall residential revenues are growing at low-single-digits, driven by high-margin broadband revenues; margin is rising from mix and stable service costs, so EBITDA should growing at mid-single-digits or more
- The new Mobile business benefits from cross-selling and WiFi offload with the Internet business; it is already profitable excluding marketing and sales costs, and represents a large potential upside in the future
- New entrants in broadband typically struggle to get a good Return on Investment (“ROI”), because of the high CapEx requirements, high fixed costs, low initial revenues and Cable’s proactive customer retention
- Financial leverage and stable core CapEx turn a mid-single-digit EBITDA growth into a low-teens total FCF growth
- Buybacks, financed by FCF and new borrowings in line with a rising EBITDA (at a 4.0-4.5x leverage target), drive FCF/Share growth to high teens
In 2017-21, Charter’s EBITDA had a CAGR of 7.8%, though growth was lower in 2018 and 2019 (at 5.0%); the CAGR for FCF exceeded 20% and that for FCF/Share exceeded 30% across the whole period:
|
Charter Internet Subscribers & Key Financials (2017-21) 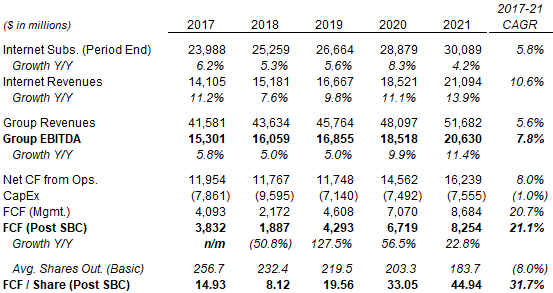 Source: Charter company filings. NB. SBC = Share-Based Compensation; average basic share numbers used for comparability; FCF/share figures are calculated differently in the rest of the article. Charter completed acquisition of TimeWarner Cable in May-16. |
Elevated connectivity demand during COVID-19 boosted Charter’s growth significantly in 2020-21. Since 2022, Charter’s Internet subscriber net adds have decelerated significantly, which management has attributed primarily to lower industry gross adds as a result demand pulled forward during the pandemic.
The two main perceived threats to Charter are telco fiber overbuild (led by AT&T (T)) and Fixed Wireless Access (“FWA”) offerings (led by T-Mobile (TMUS) and Verizon (VZ)). However, churn among Charter Internet subscribers has remained at historic lows, wireline broadband net adds at AT&T and Verizon have remained small (-29k and +38k respectively at Q3 2022), while we believe FWA net adds largely represent low-end subscribers who are new to broadband and would not have purchased wireline products in any case.
|
Wireline & Fixed Wireless Broadband Net Adds – Key Players (Since 2019) 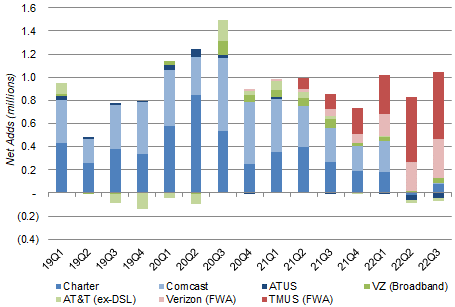 Source: Company filings. NB. Comcast Q1 2022 figure includes one-third benefit from end of COVID free programs. |
As of Q3 2022, Charter’s last-twelve-month group EBITDA was up 6.3% year-on-year and up 0.6% sequentially.
We believe Charter shares are too cheap and the market panic after the investor day is wrong.
CapEx Increases Headlined Charter Investor Day
The main item from the investor day was a one-off increase in Charter’s capital expenditures during 2023-25:
- “Line Extensions” CapEx to be $4bn in 2023, $1bn higher than in 2022
- “Network Evolution” CapEx to be $5.5bn, with the bulk to be in 2024-25.
|
Charter Capital Expenditures (2018-23E) 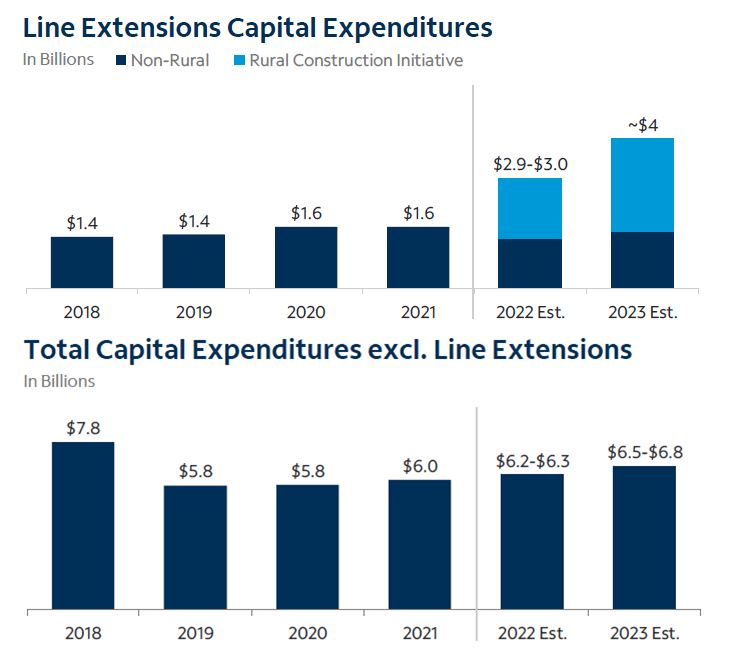 Source: Charter investor day presentation (Dec-22). |
Together these mean total CapEx will likely be $10.5-10.8bn in 2023. Total CapEx excluding Line Extensions is expected to decline after 2025 (or sooner), but the direction of Line Extensions CapEx has not been specified and likely depends on Charter’s success in winning government grants.
We discuss each part of Charter’s CapEx increase in turn.
Charter’s Line Extensions & Rural Construction Initiative
Most of the increase in Charter’s Line Extension CapEx since 2021 is related to its Rural Construction Initiative (as shown in the chart above), and much of this was previously known.
Charter’s Rural Construction Initiative currently consists of the Rural Digital Opportunity Fund (“RDOF”), various state and local government grants, and the Broadband Equity, Access, & Deployment (“BEAD”) program:
|
Charter Current Rural Construction Initiative 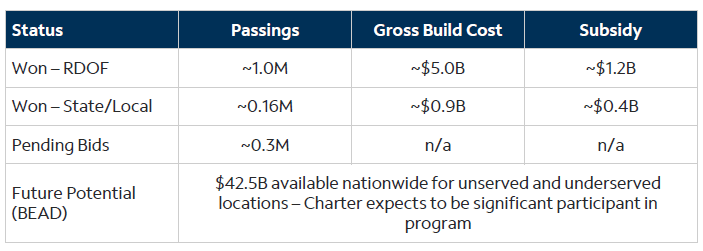 Source: Charter investor day presentation (Dec-22). |
The bulk of near-term Line Extension CapEx comes from RDOF, which was highlighted by management as early as at Q1 2021 results. The gross build cost of $5bn (offset by $1.2bn in subsidies) was always known, so the only news out of the investor day was its timing. The BEAD program opened for applications in May 2022 and can be significant, but actual construction is not expected to start until 2024 and again Charter announced little that was new.
In any case, Line Extension CapEx increases should be a positive given their high expected ROI. Charter reaffirmed expectations of a mid-to-high-teens IRR for RDOF at the investor day, and its BEAD applications likely reflect similar expectations. Management also stated that new builds under RDOF have so far seen a 40% penetration rate after 6 months, while those under state grants have seen 50%
Charter’s Network Evolution CapEx
Charter now expects $5.5bn of Network Evolution CapEx, mostly in 2024-25. This will cover:
|
Step |
% of Footprint |
Technology |
Speed |
Start Date |
|
1 |
15% |
1.2 GHz |
2 Gps Download 1 Gbps Upload |
Started |
|
2 |
50% |
1.2 GHz + DAA |
5 Gbps Download 1 Gbps Upload |
Early 2024 |
|
3 |
35% |
1.8 GHz + DAA |
10 Gbps Download 1 Gbps Upload |
Late 2024 |
(NB. The steps refer to distinct areas of Charter’s footprint; DAA = Distributed Access Architecture.)
The 35% of the footprint offering 10 Gbps downloads will be utilizing DOCSIS 4.0 technology, while the rest will effectively be on DOCSIS 3.1 with high split technology (but can also be upgraded to 4.0 at relatively low cost). In addition, Charter will also offer Fiber with symmetrical speeds of 25 Gbps+ on demand across its footprint, with the most likely customers being enterprises.
On completion, these mean Charter will be able to offer broadband with 5 Gbps+ downloads (and 1 Gbps uploads) in 85% of its footprint, compared to the 1 Gbps+ downloads and 30 Mbps uploads it now has across its network.
Charter estimates the total CapEx for the above (excluding Fiber on demand) will be around $100 per household passing, amounting a total $5.5bn across its current footprint. CapEx will “ramp up” through 2023 and be “in full force” in 2024, peaking either that year or in 2025. The whole program will be “essentially complete by end of 2025.”
The $100 per household passing figure is not directly comparable to a “less than $200” figure disclosed by Comcast (CMCSA) Cable Chief Network Officer Elad Nafshi at an investor conference on November 15, because Nafshi was referring to the cost of upgrading to DOCSIS 4.0, while Charter’s figure only included upgrading part of the network to DOCSIS 4.0.
Network Evolution should make Charter’s network future-proof for the foreseeable future, especially as even the parts that do not have 10 Gbps can be upgraded to 10 Gbps relatively easily. The specific benefits to revenues are harder to quantify, especially because, as management acknowledged, there are not many current devices, products or even use cases for the higher speeds envisaged. However, Charter believes connectivity demand will continue to grow and the higher speeds will eventually be a key revenue and competitive advantage.
In addition to wireline broadband usage, Charter may also expect mobile to be a source of future traffic, as Charter’s mobile lines continue growing rapidly (up 1.49m year-on-year, or 46.9%, as of Q3 2022); Charter is already offloading 85% of its mobile traffic to WiFi and is open to sharing its WiFi capacity with partners.
We believe Network Evolution represents a farsighted decision on the part of Charter to sacrifice short-term cashflows (and share performance) for long-term growth. It will certainly reduce maintenance costs and network augmentation CapEx; at worst it will generate no incremental revenues. Bears may argue it is a defensive response against recent net add deceleration and thus a sign of weakness, but this is inconsistent with how the main threat appears to be from lower-speed Fixed Wireless products.
No Recent Change in Charter’s Business
There was little update on Charter’s current business from the investor day.
Management again maintained that recent lower Internet net adds have been due to lower market activity following the COVID pull-forward of demand. CEO Chris Winfrey stated that, while 2023 may present “a little bit of a challenge” for the same reasons, Charter’s “goal is certainly to have significant larger Internet net adds” next year.
A slower economy may reduce new construction and thus Charter’s build-out into new areas, but management expects to be able to target gaps in existing footprints as an offset.
Charter expects to stay “at or just below” the high-end of the 4.0-4.5x Net Debt / EBITDA target. With an average life of debt exceeding 13 years, refinancing maturing debt at current interest rates over the next 5 years will only raise interest expense by $140m by 2028, easily manageable next to 2021 EBITDA of $20.9bn.
Valuation: 10%+ Free Cash Flow Yield
Relative to the most recent quarter, Charter has a Free Cash Flow (“FCF”) Yield of more than 10%.
During Q3 2022, Charter had FCF of $1.40bn (after deducting non-cash share-based compensation costs). Excluding $185m of litigation settlement costs (implied by management comments), FCF was $1.58bn:
|
Charter EBITDA & Cashflows (Q3 2022 vs. Prior Periods) 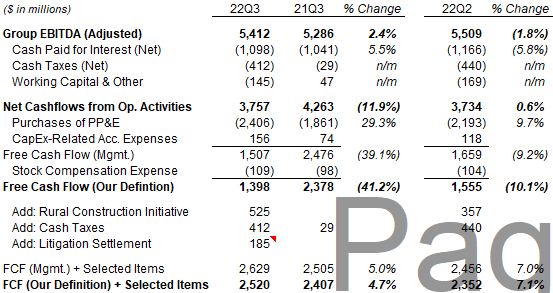 Source: Charter company filings. |
Annualized, this means $6.33bn of total FCF and $35.75 of FCF/Share, which implies a FCF Yield of more than 10%.
Updated Charter Cashflow Forecasts
We update our forecasts to include the new CapEx increases while conservatively assuming little additional EBITDA growth in return. We also extend our forecasts by a year to 2026. Our key assumptions now include:
- Cable EBITDA to be flat year-on-year in 2022 (unchanged)
- Cable EBITDA to grow by 4.5% annually from 2023 (was 4.3%)
- Mobile EBITDA to be $500m by 2025 (unchanged) and $750m in 2026 (new assumption)
- CapEx to be $9.2bn in 2022 (was $8.2bn)
- CapEx to be $11.0bn in 2023, $9.5bn in 2024 and 2025, and $8.0bn in 2026 (was flat $8.2bn).
|
Charter Cashflow Forecasts (2022-26) 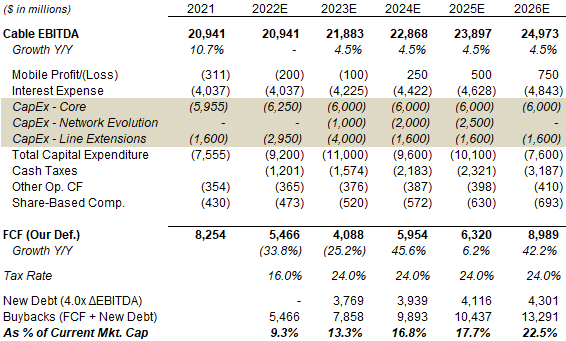 Source: Librarian Capital estimates. |
For Network Evolution CapEx, we have allocated the $5.5bn specified by management across 2023-25 as above below. For Line Extension CapEx, we have followed management guidance for 2022-23 but assumed a return to $1.6bn thereafter, to tie with our relatively conservative EBITDA growth assumptions.
By 2025, total Line Extension CapEx since 2022 will have added up to $10.2bn, more than 80% of which will be more than a year old. Even if this $10.2bn only generates EBITDA at a 5% rate (compared to the mid-to-high-teens long-term IRR expected), this will mean more than $500m of EBITDA, or 2.4% of 2021 group EBITDA – supportive of our assumption of a 4.5% annual growth in Cable EBITDA in 2023-25.
Keeping other assumptions unchanged, our new 2025 FCF is $6.32bn, 10% lower than our previous forecast ($7.02bn) due to higher CapEx, and lower than 2021 due to both higher CapEx and cash taxes. However, with the expected end of Network Evolution CapEx in 2025, FCF is expected to grow 42% year-on-year in 2016 to $8.99bn.
In our forecasts, FCF will trough in 2023 at $4.09bn. However, because the expected reduction in FCF is due to higher CapEx, EBITDA growth should still enable new debt to be raised to fund further buybacks, so our forecasts still expect $7.86bn of repurchases that year (or 13.3% of the current market capitalization).
Charter Return Forecasts
Our return forecasts, based on cashflow forecasts above, are as follows:
|
Illustrative Charter Return Forecasts 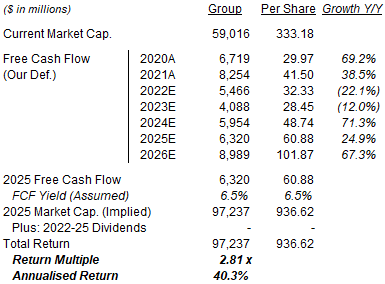 Source: Librarian Capital estimates. |
Our forecasts imply an FCF/Share of around $61 in 2025 (19% lower than previous forecasts) and $102 in 2026 (thanks to the end of Network Evolution CapEx).
We have reduced our 2025 FCF Yield assumption from 7.5% to 6.5%, to reflect the fact that 2025 FCF will be artificially lowered by one-off Network Evolution CapEx
With shares at $333.18, we expect an exit price of $937 and a total return of 181% (40.3% annualized) by 2025 year-end.
Is CHTR Stock A Buy? Conclusion
We reiterate our Buy rating on Charter Communications Inc. stock.
Be the first to comment