

simoncarter/iStock via Getty Images
Though this article will be classified as technical analysis, we will review information in the form of charts of the stock market, commodities, economy, sentiment, dollar index, and interest rates.
For 2022, some facts that we know are:
- The Federal Funds Rate (FFR) has risen from 0.25% to 4.25%.
- U.S. 10-year interest rates went up from 1.5% to 4.25%, though they have come down to 3.65%.
- Inflation reached highs of 9.1% but has come down for the past few months.
- The dollar was up about 20%, and it is still up 9% after the pullback.
- Stock market indices have dropped double digits.
Stock Market Analysis
The weekly chart of the S&P 500 Index (SP500) is in a downtrend and below the cloud. What does it mean? Until the S&P 500 closes above 4150 and above the cloud on a weekly chart (along with other indicators), we have to respect the downtrend.
S&P 500 Weekly Chart (Author )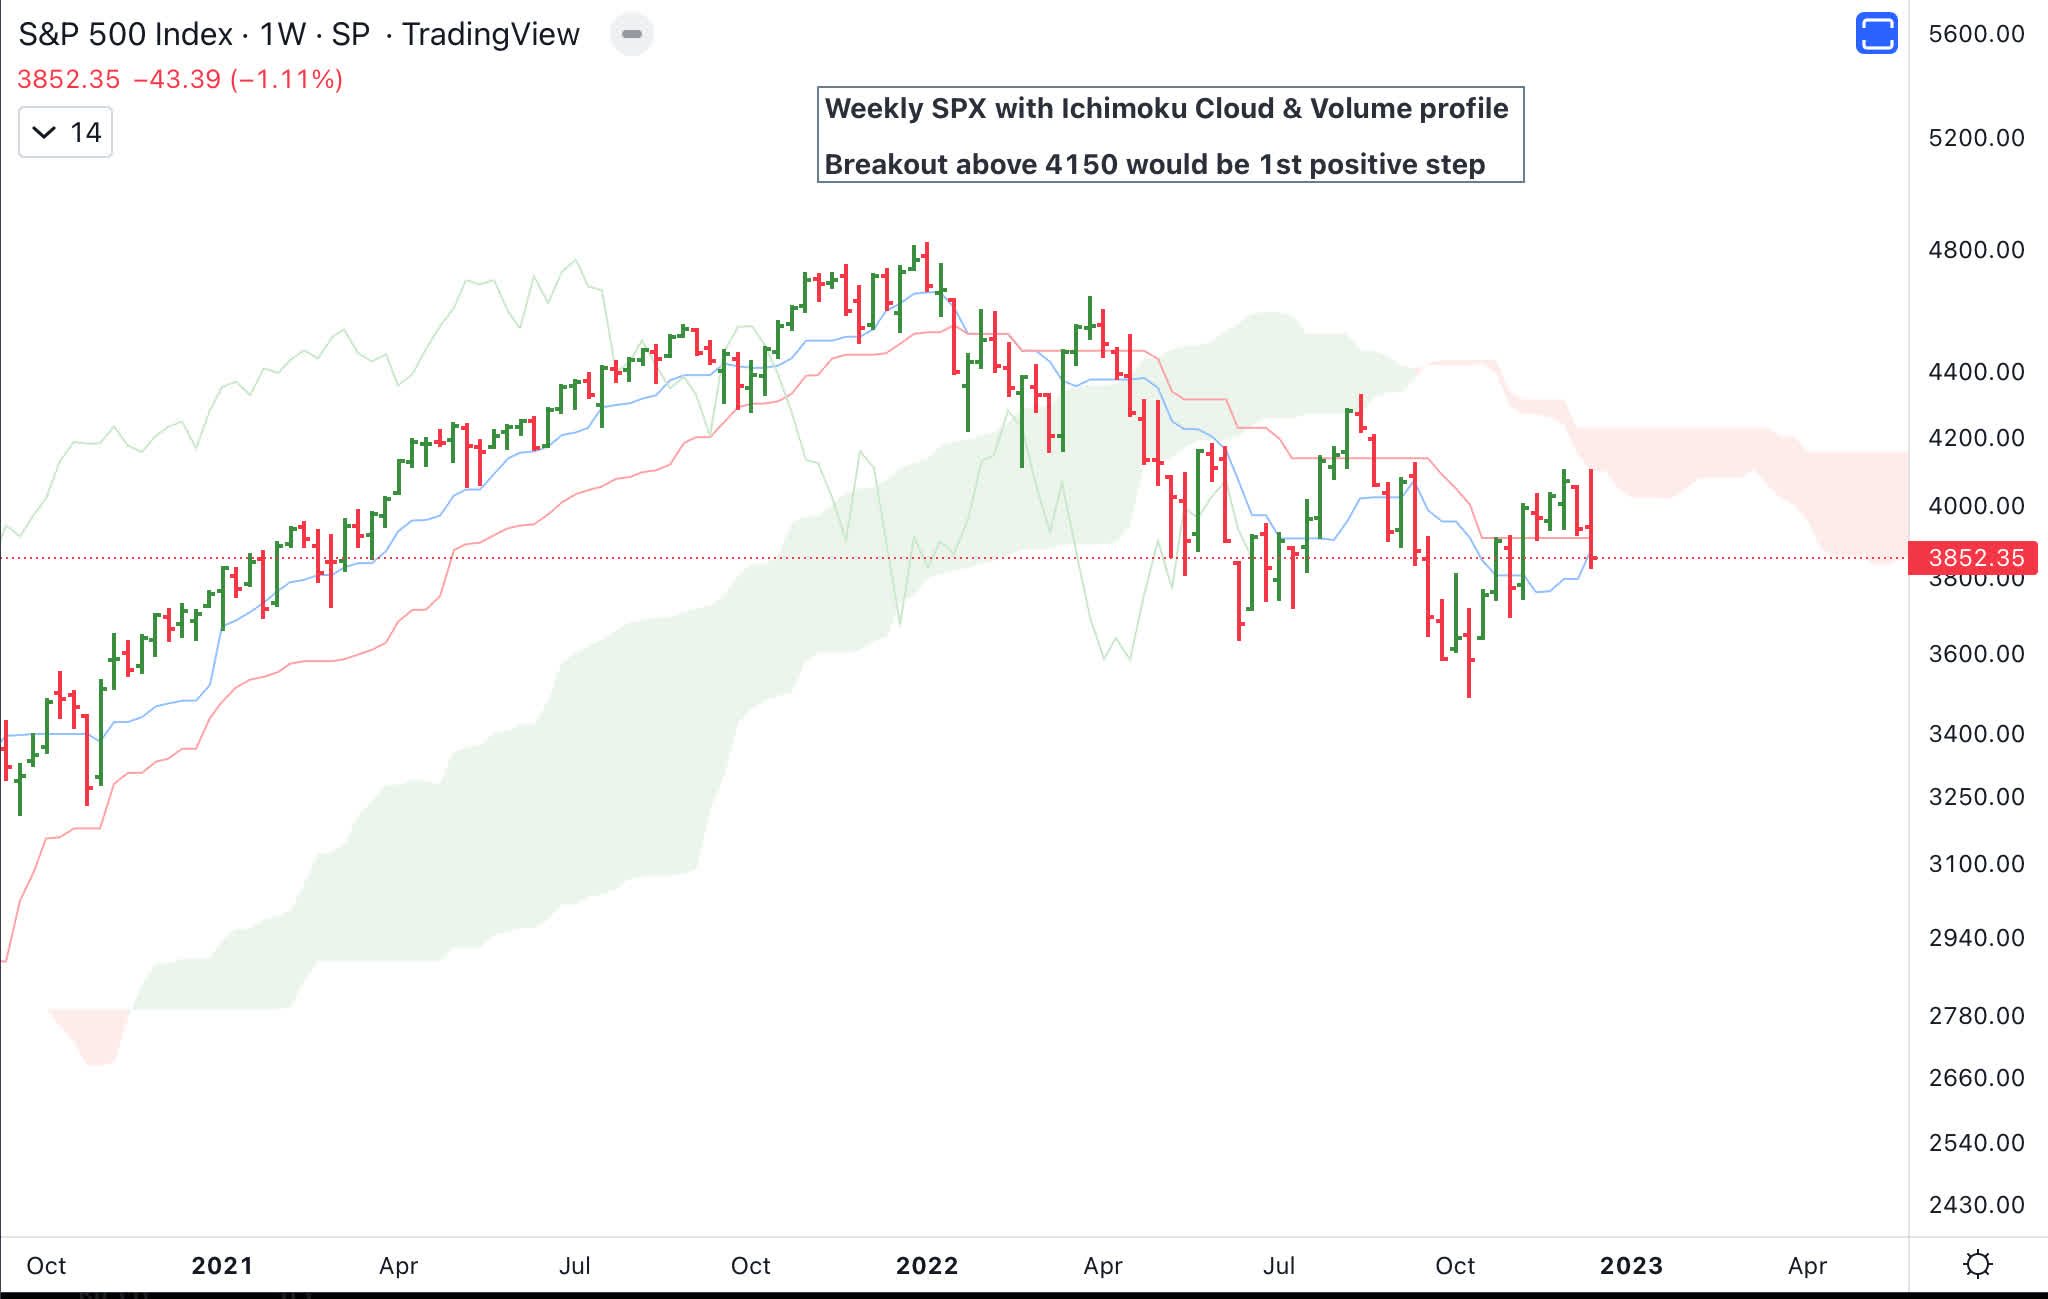
The S&P 500 on the daily chart looks precariously on the edge, and a retest of the lows is likely if we close the year below 3850.
S&P 500 Daily Chart (Author )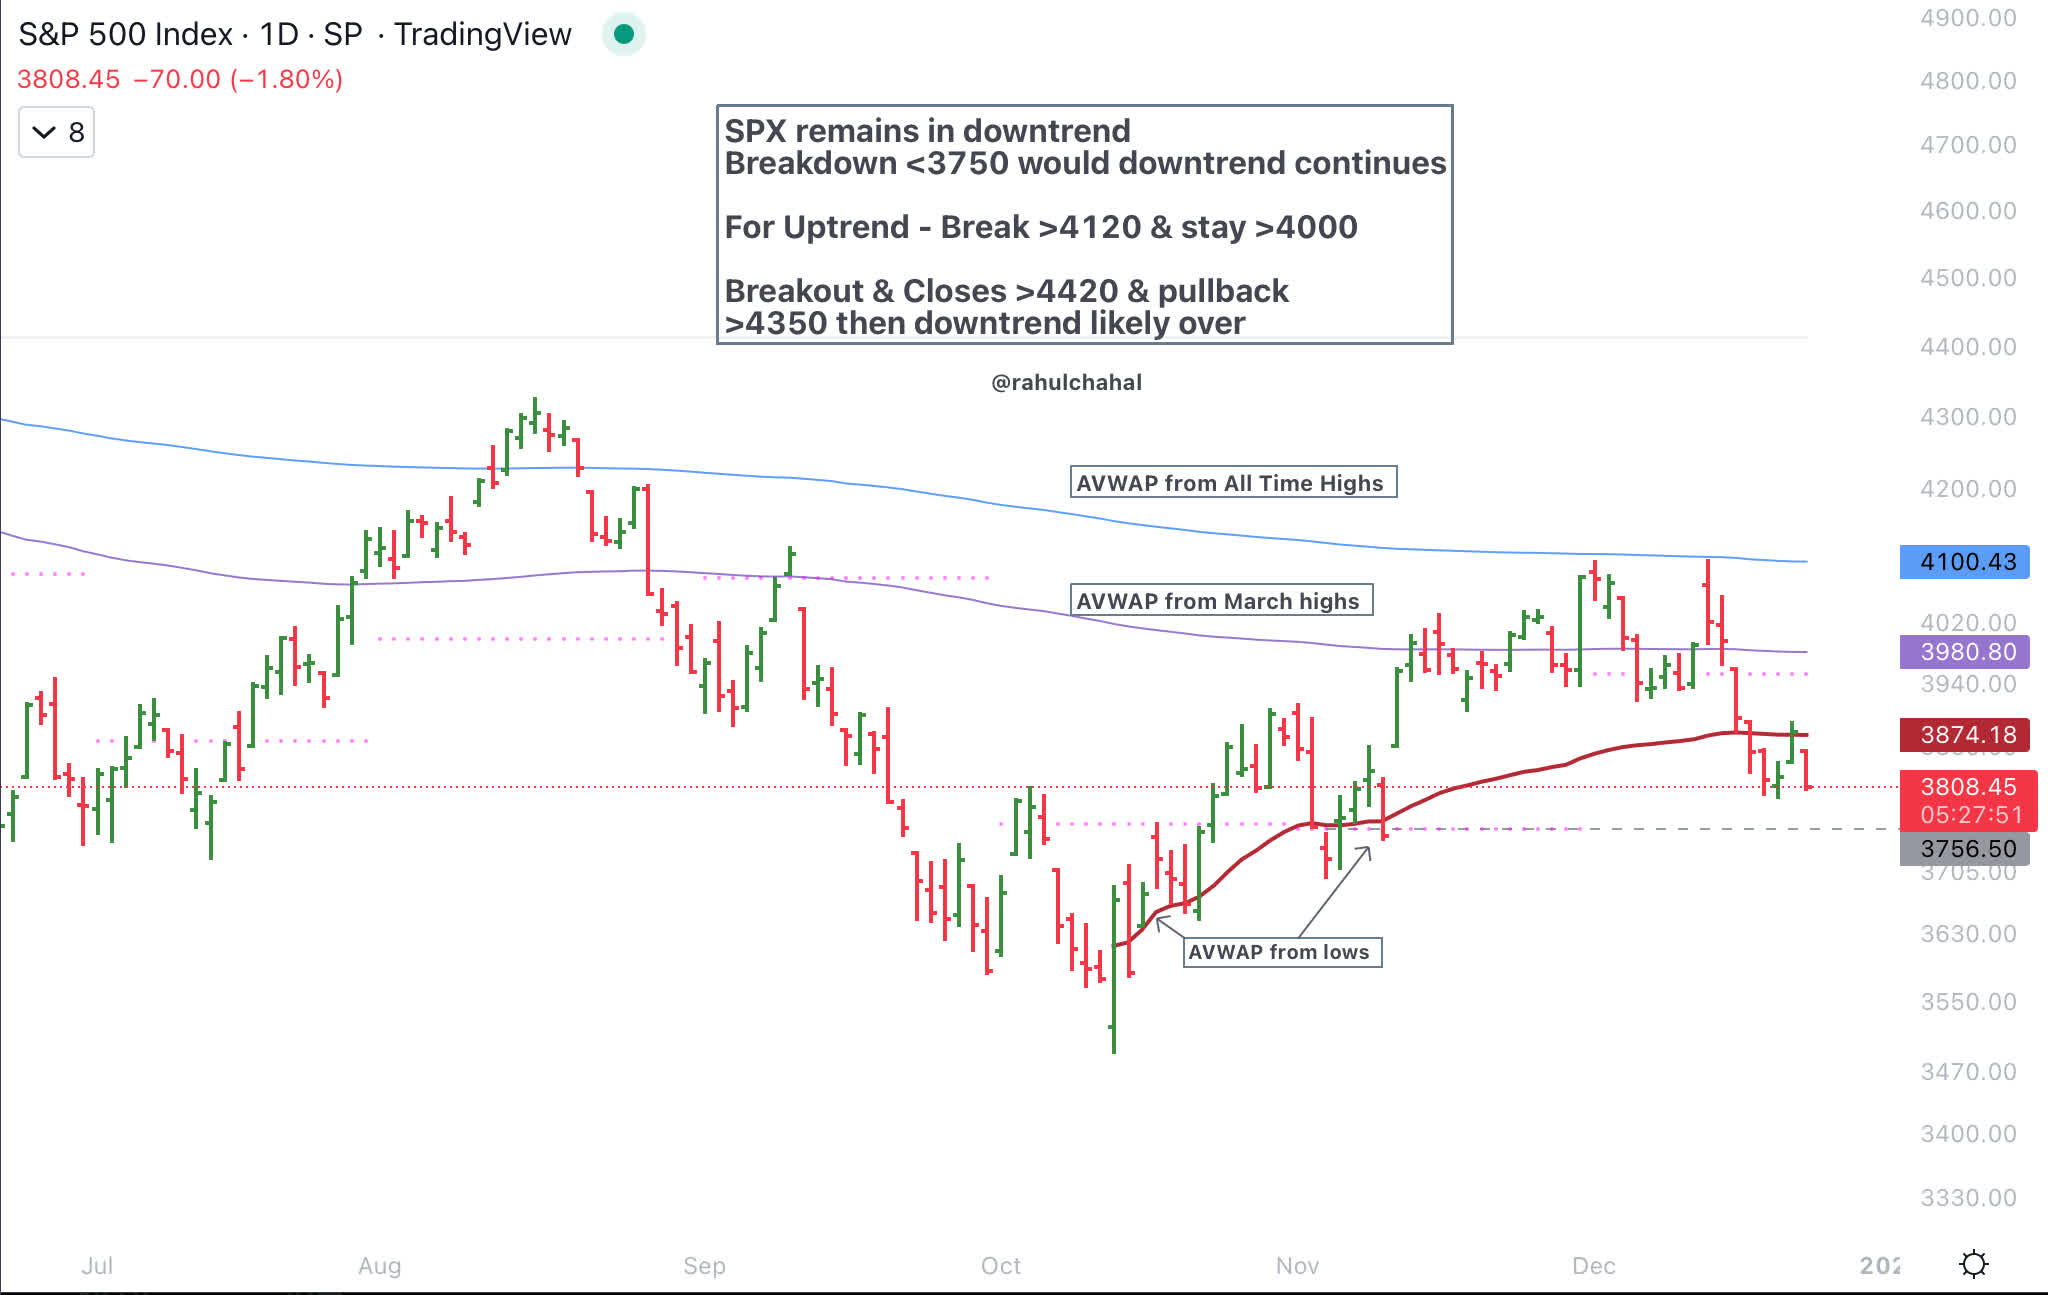
Corporate Bond Index
The corporate bond index (inverted) and the S&P 500 had a divergence in October 2022, which month has so far marked the low for the S&P 500. The corporate bond index is not looking strong, but has not broken below the summer lows.
Corporate Bond Index and S&P 500 Chart (Author )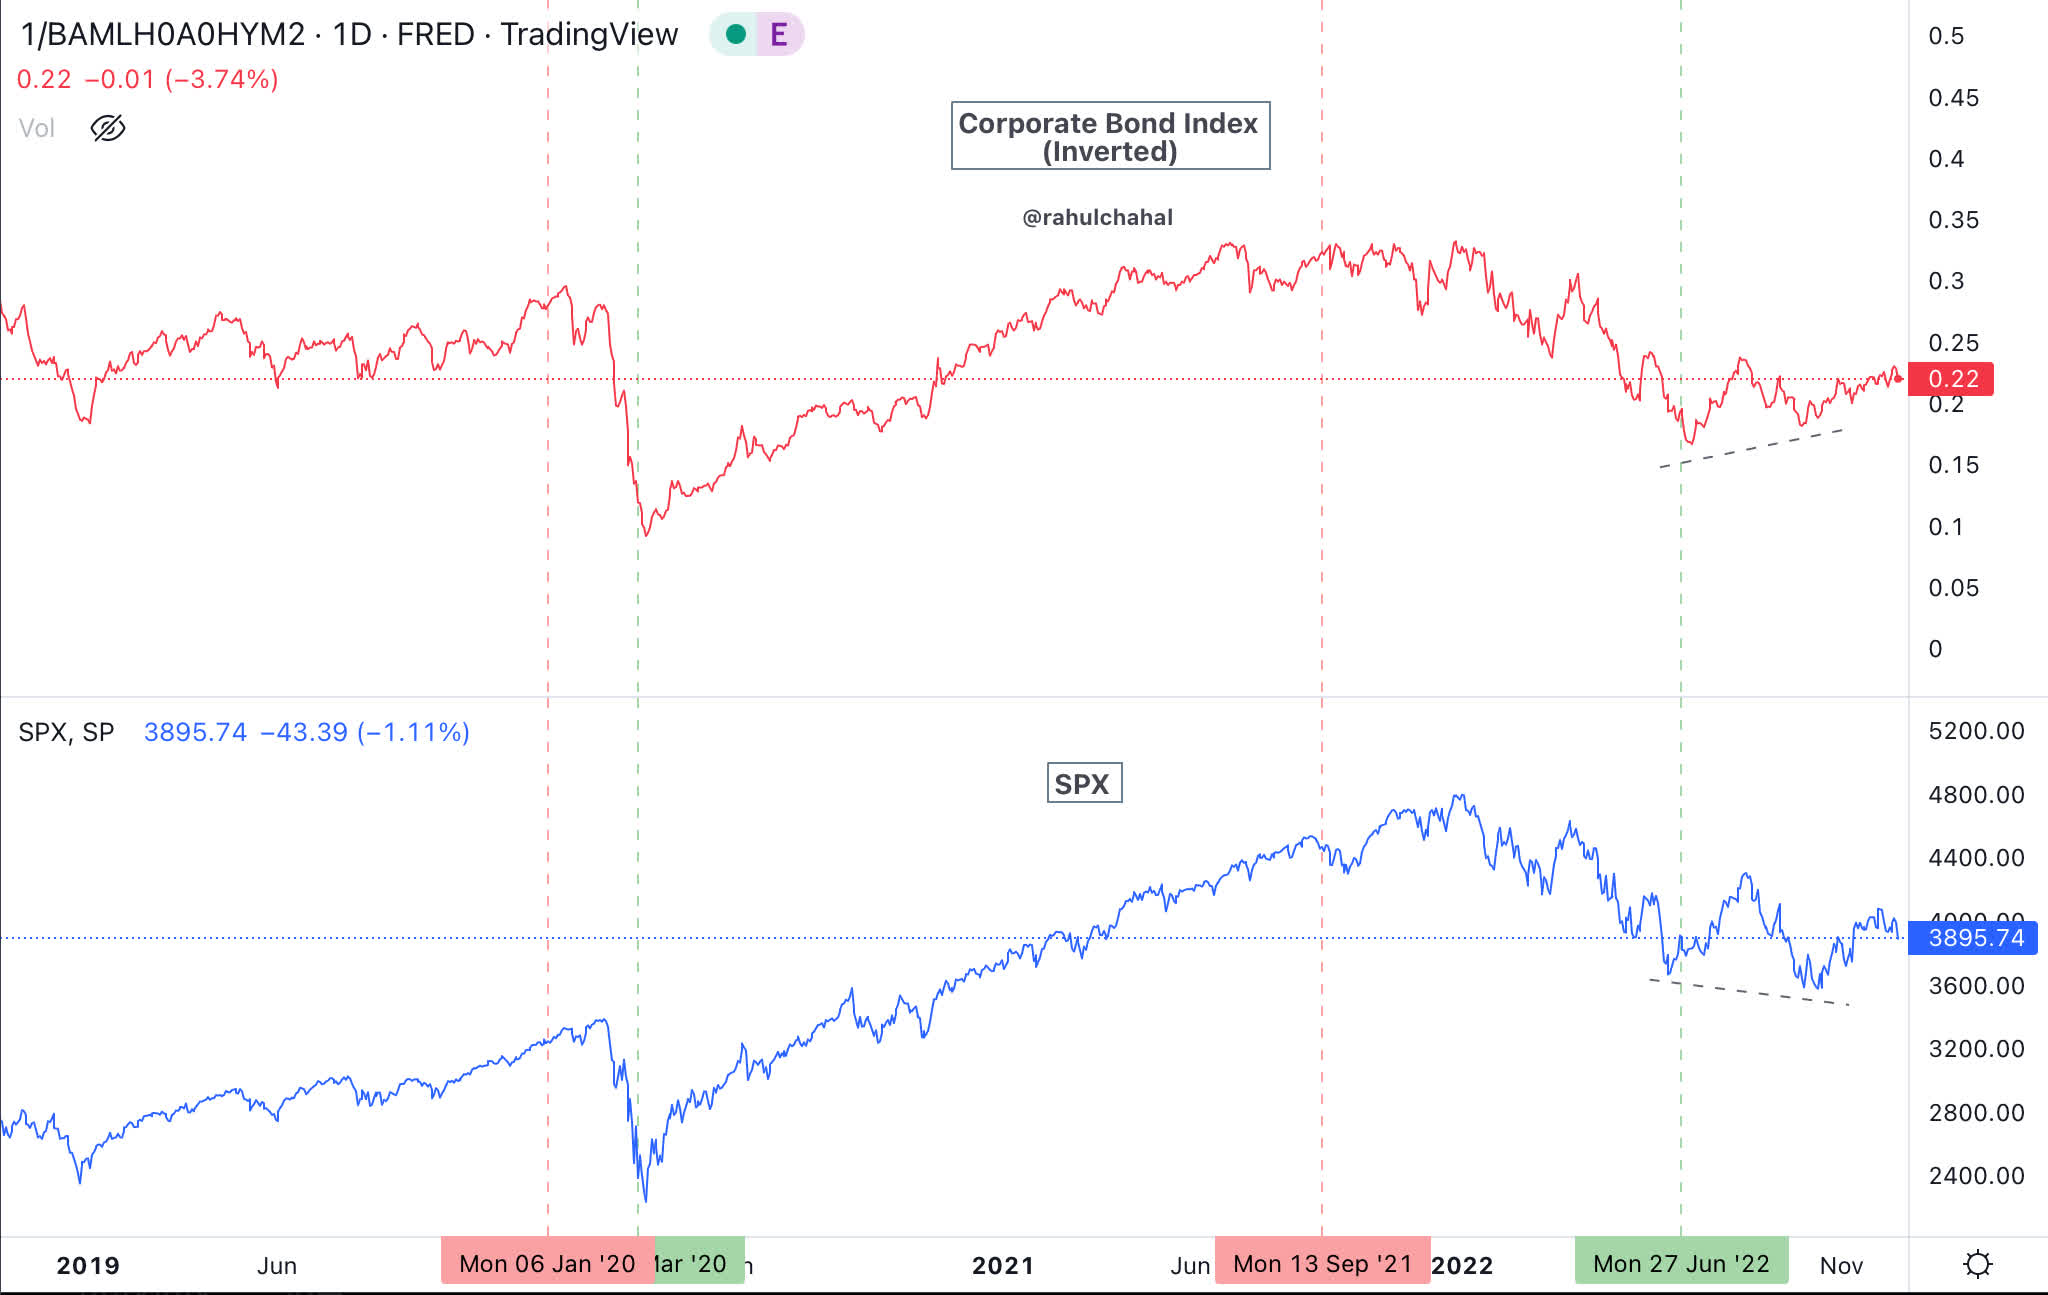
The total net advancing stocks in the S&P 500 have been rolling over. The chart below shows the net advancing stocks (10-day moving average to minimize noise) and the daily chart of the S&P 500. Advancing stocks will have to go on an uptrend for the stock market to stop rolling over.
Advancing stocks and S&P 500 (Author )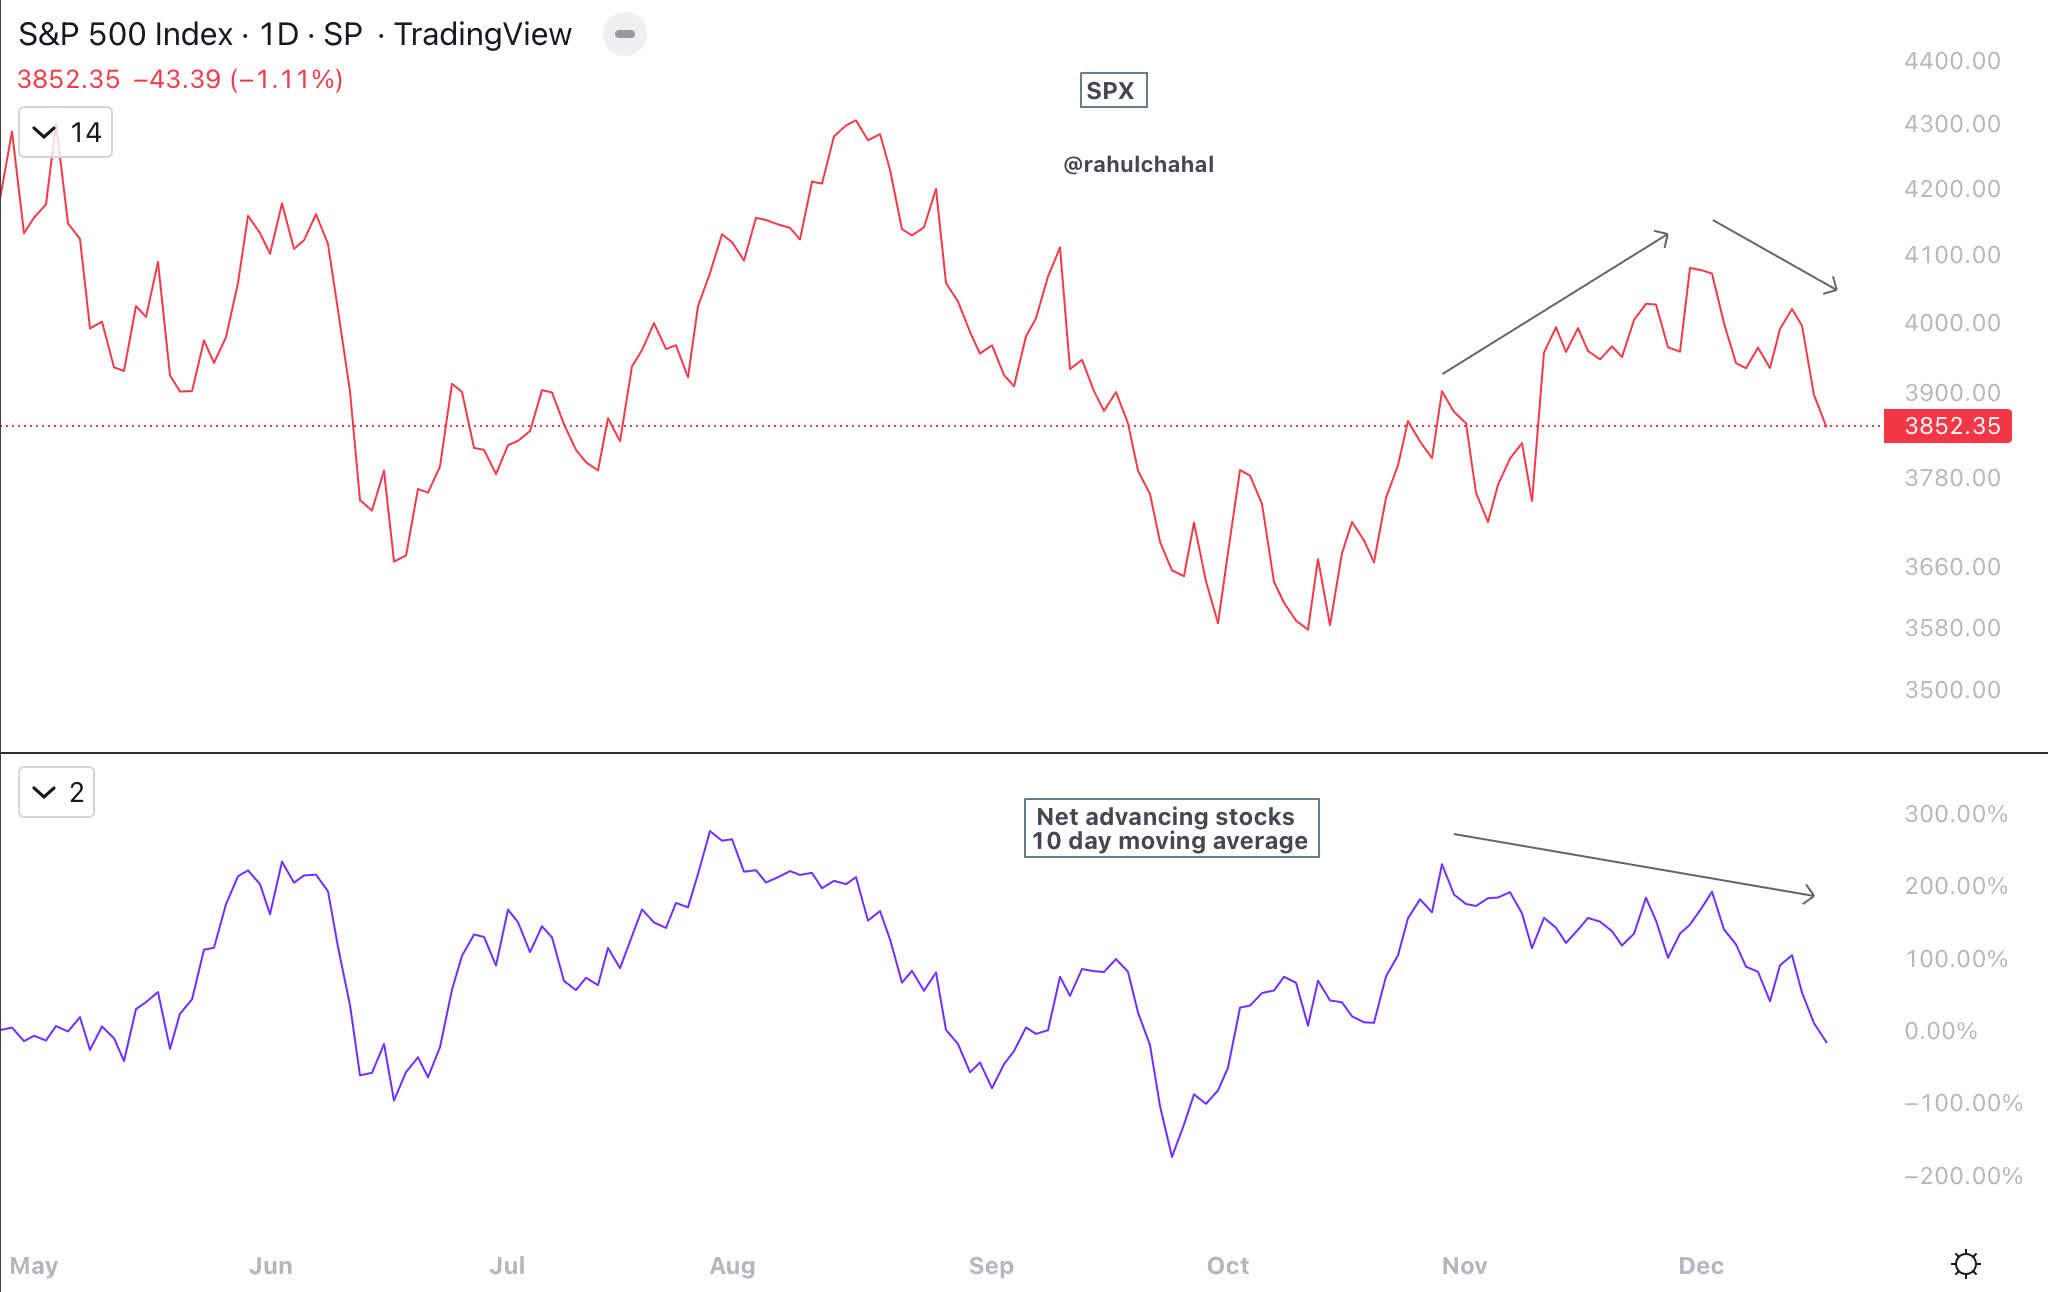
The number of stocks above their 200-day moving average and 50-day moving average has begun to roll over. If the S&P 500 is going to go up, then ideally we want to see stocks continuing to stay above major moving averages.
S&P 500 and Percentage of stocks above 200 day, 50 day moving average (Author )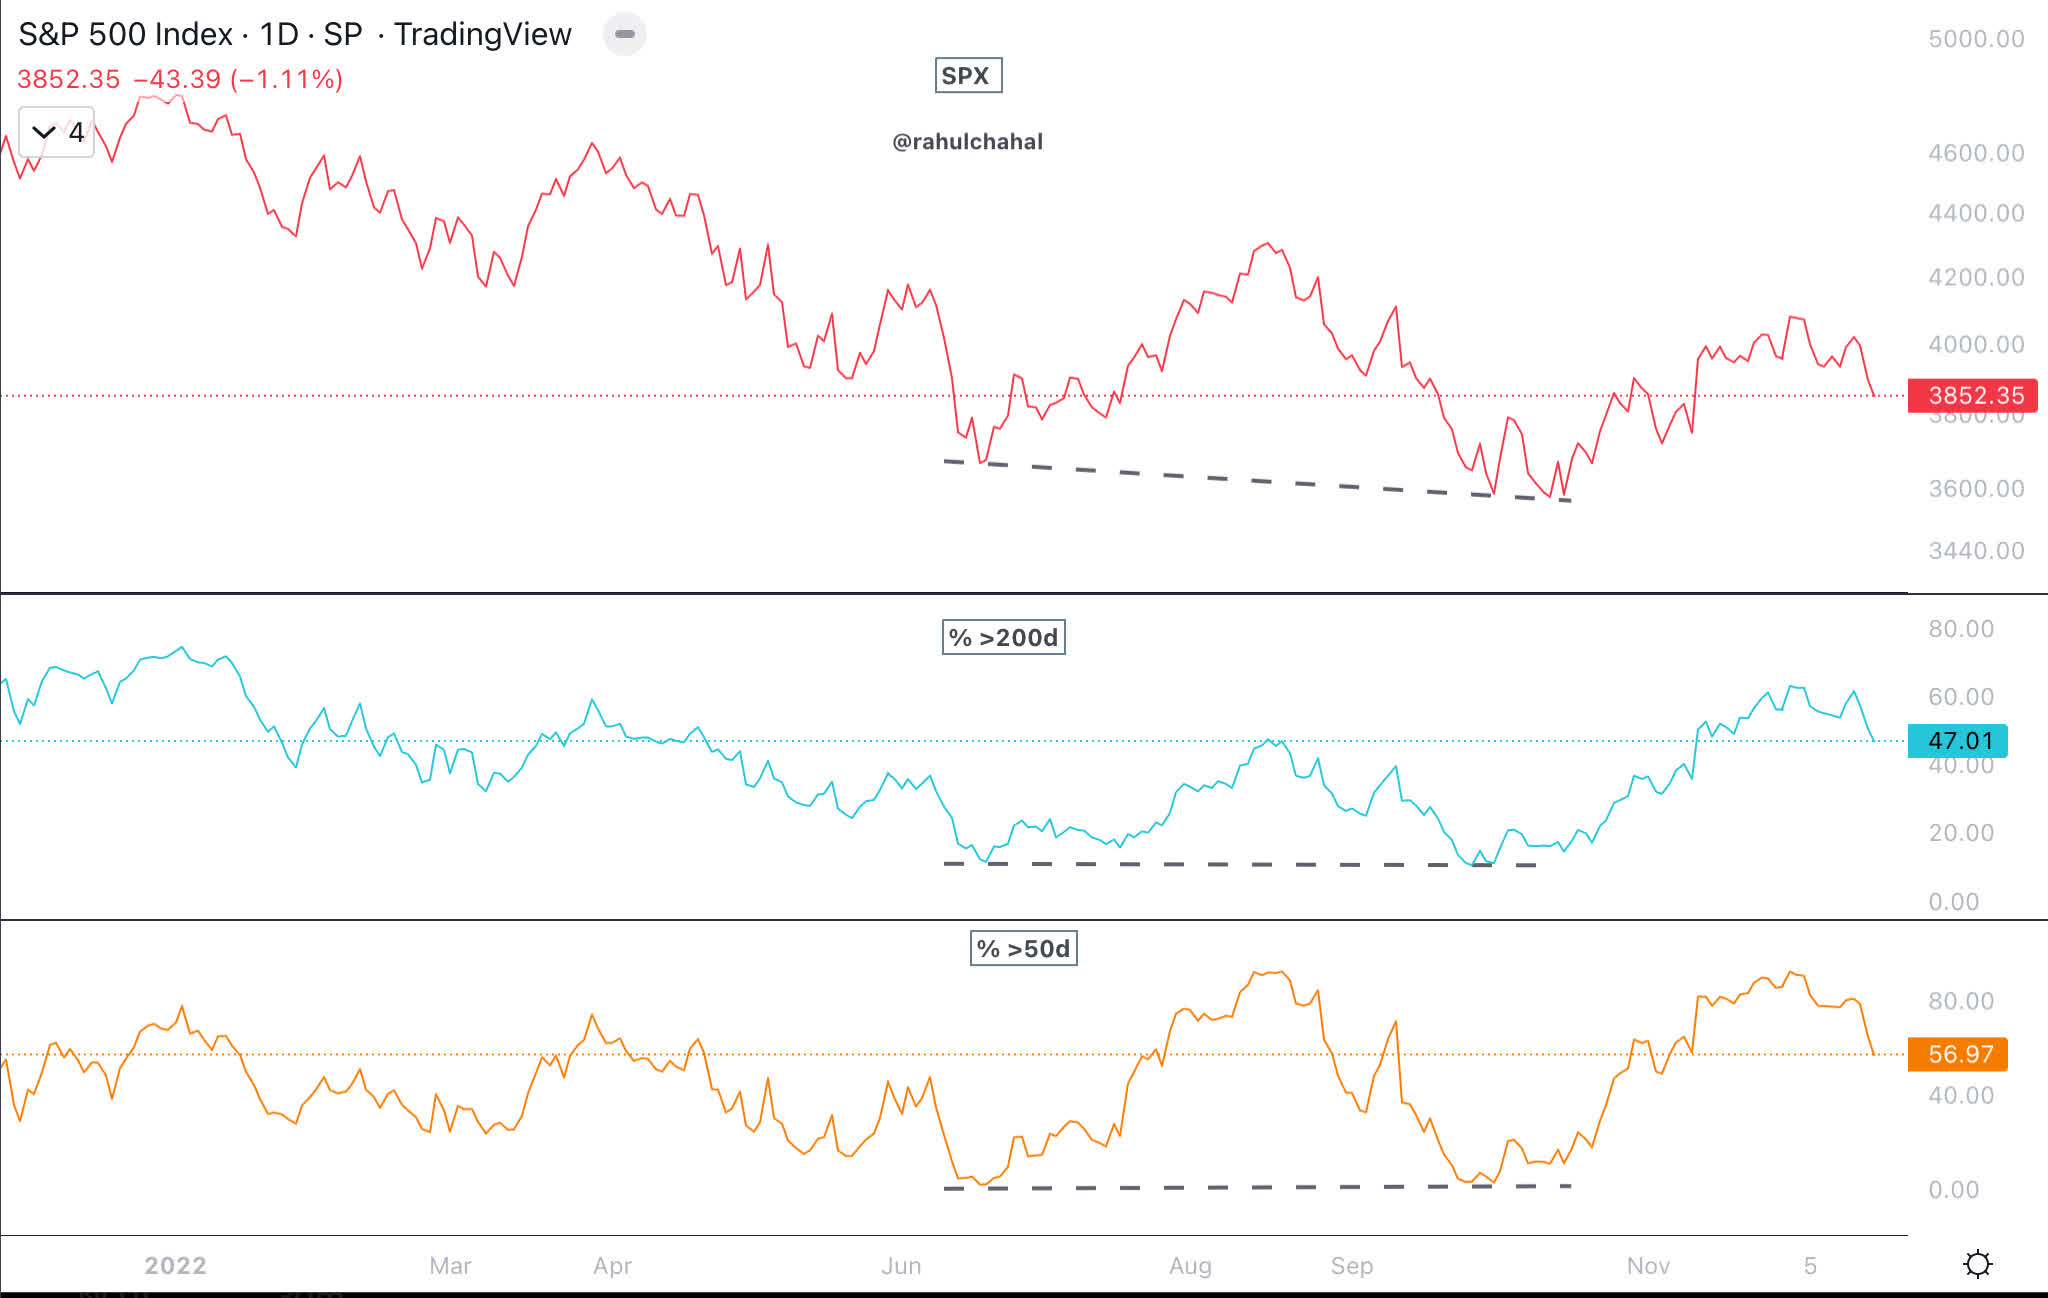
The put/call ratio for equities is on the higher end of the scale, and if the S&P 500 were to head higher, then it could provide liquidity as put options are closed.
Put Call Ratio and S&P 500 (Author )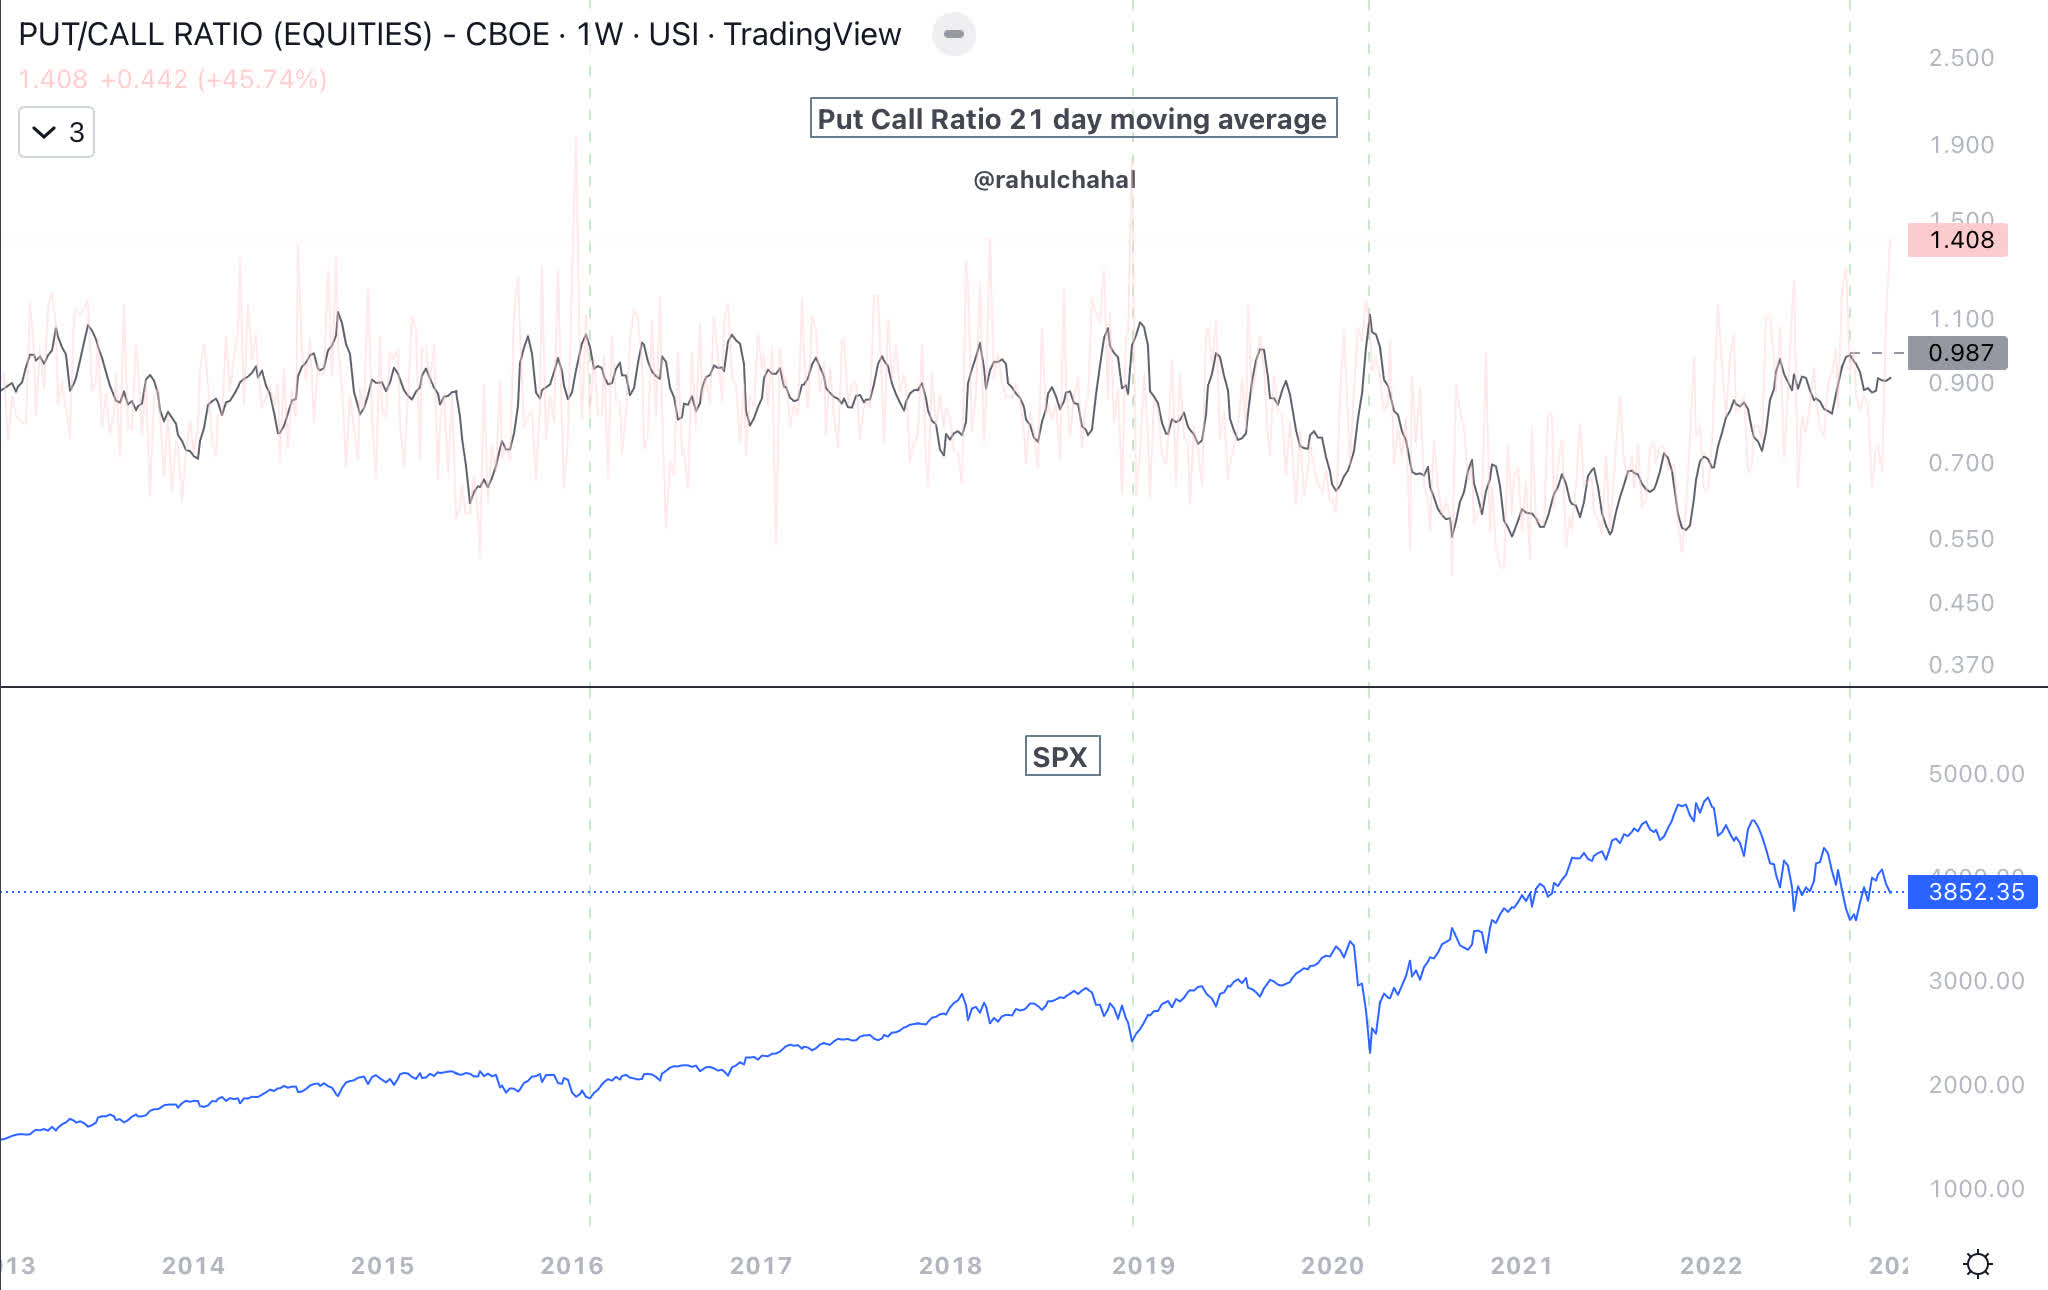
Dow Transports (DJT) is holding up, but barely. When both the S&P 500 and Dow transports breakout higher, then it provides confirmation of an uptrend.
S&P 500 and Transports Chart (Author )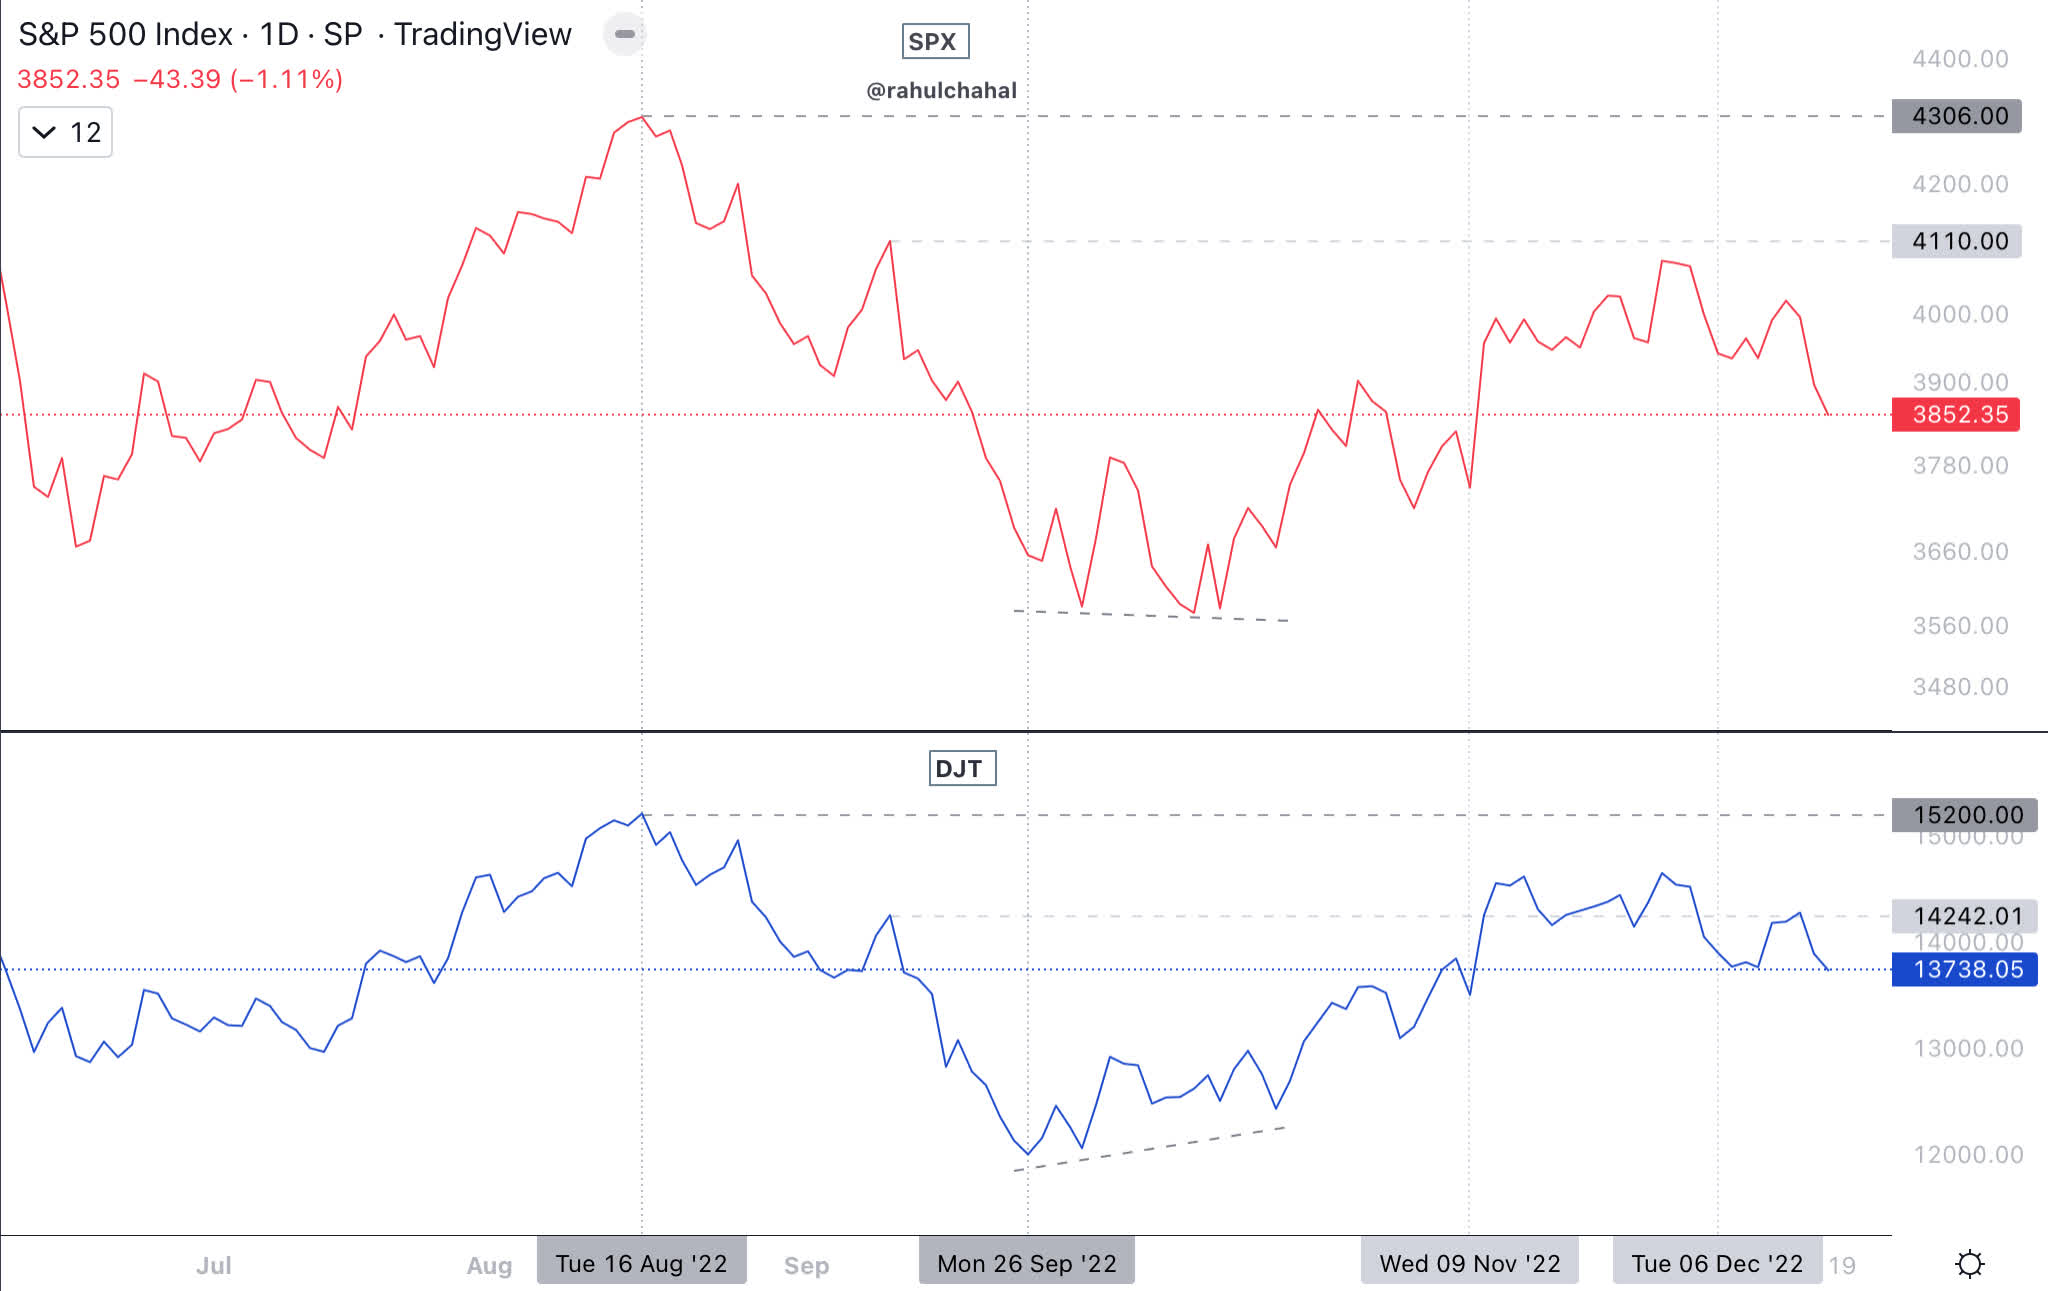
Considering the downtrend in the S&P 500, volatility as measured by VIX has remained subdued. A VIX below 18 as well as other supportive measures are required for a new uptrend to begin.
S&P 500 and VIX Chart (Author )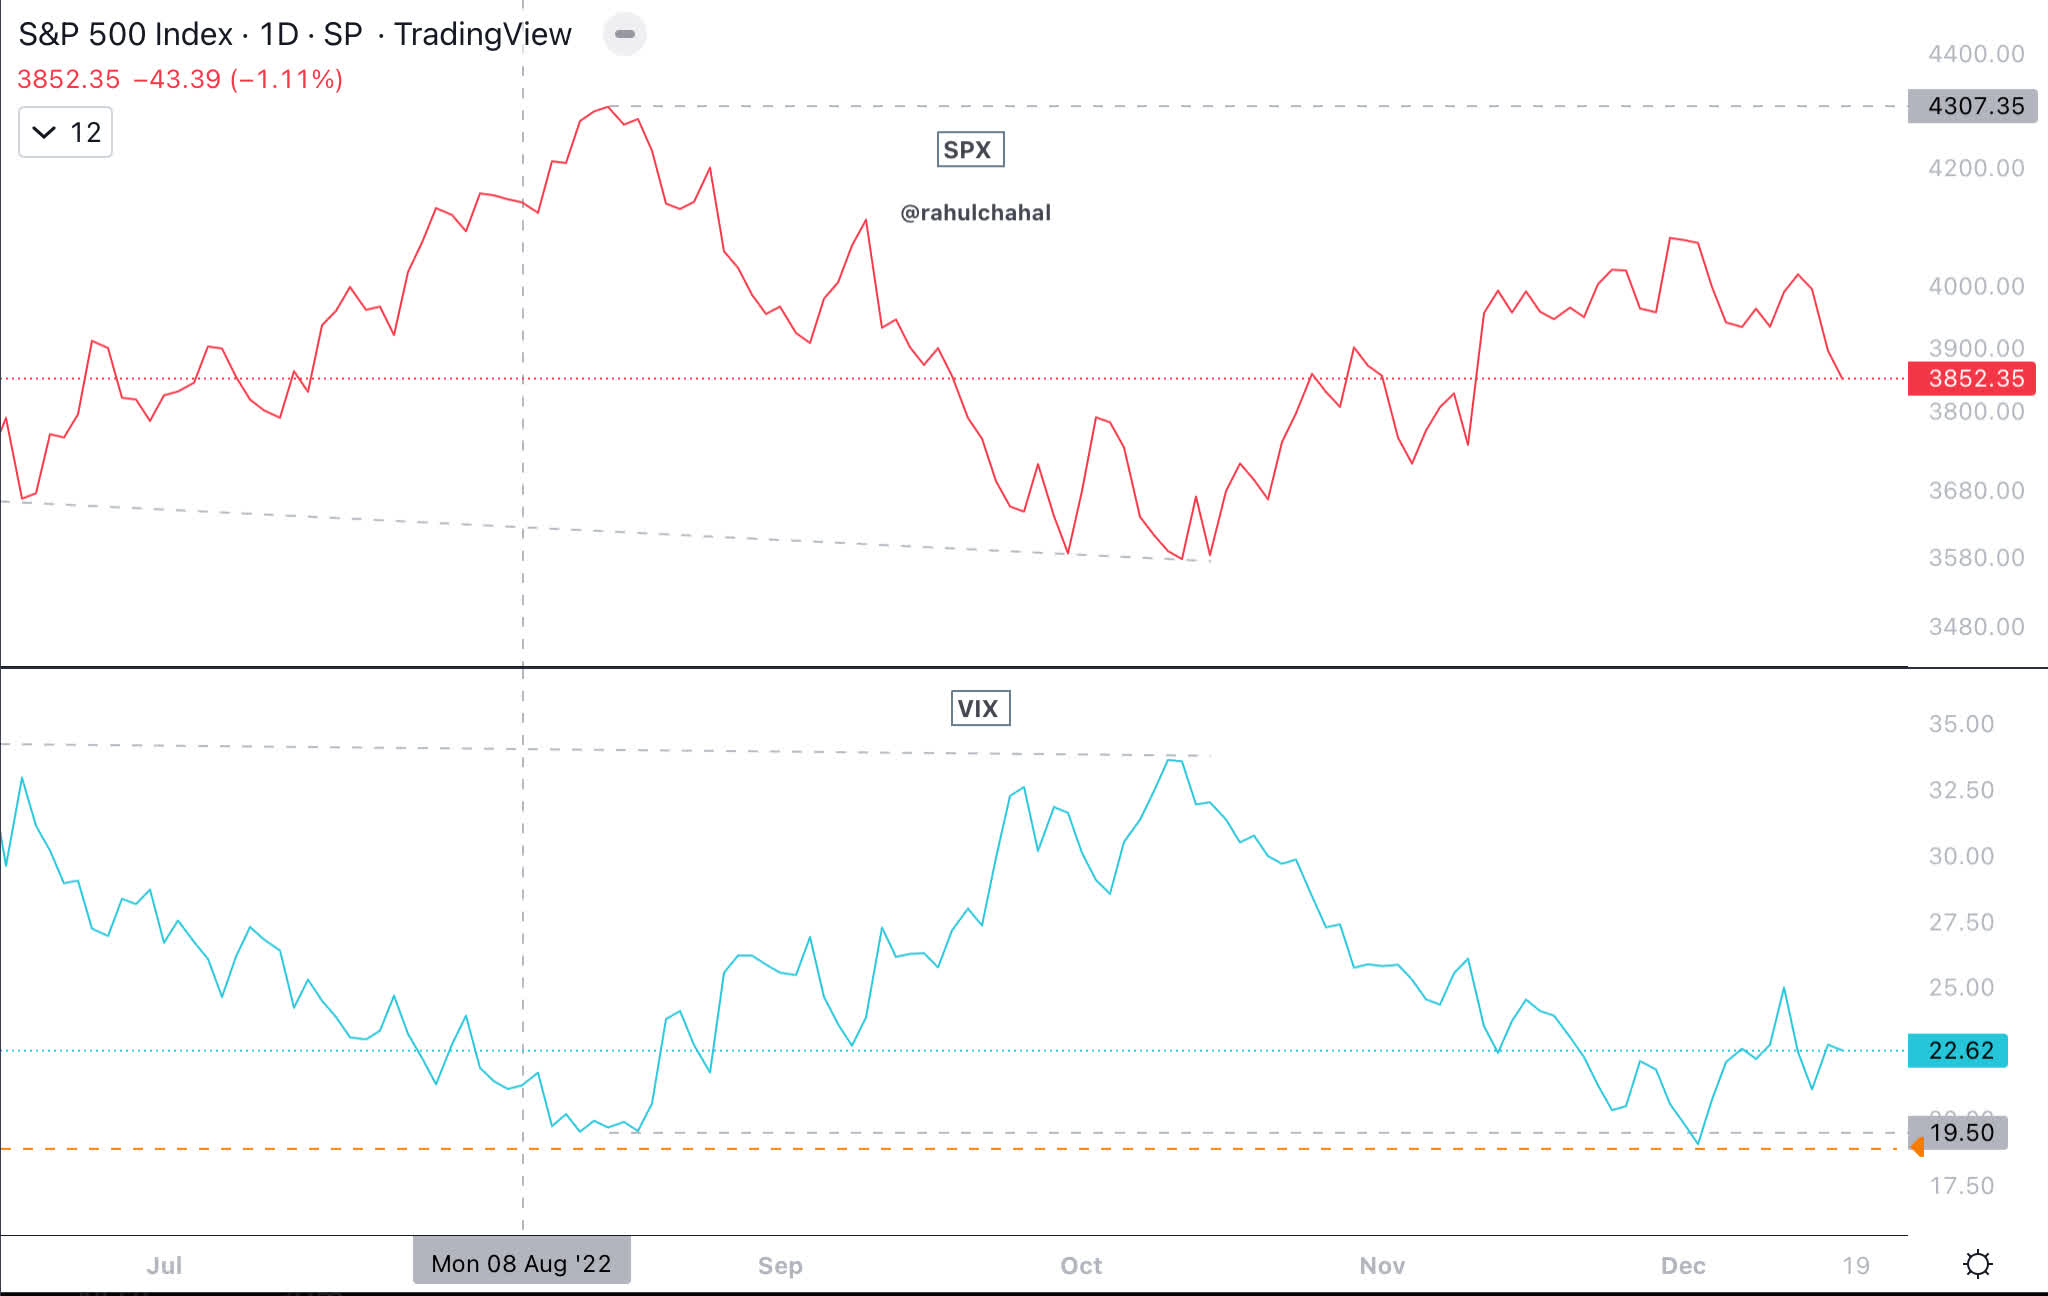
High Yield ETF (HYG) and S&P 500 are rolling over.
S&P 500 and Corporate High Yield (SPX & HYG)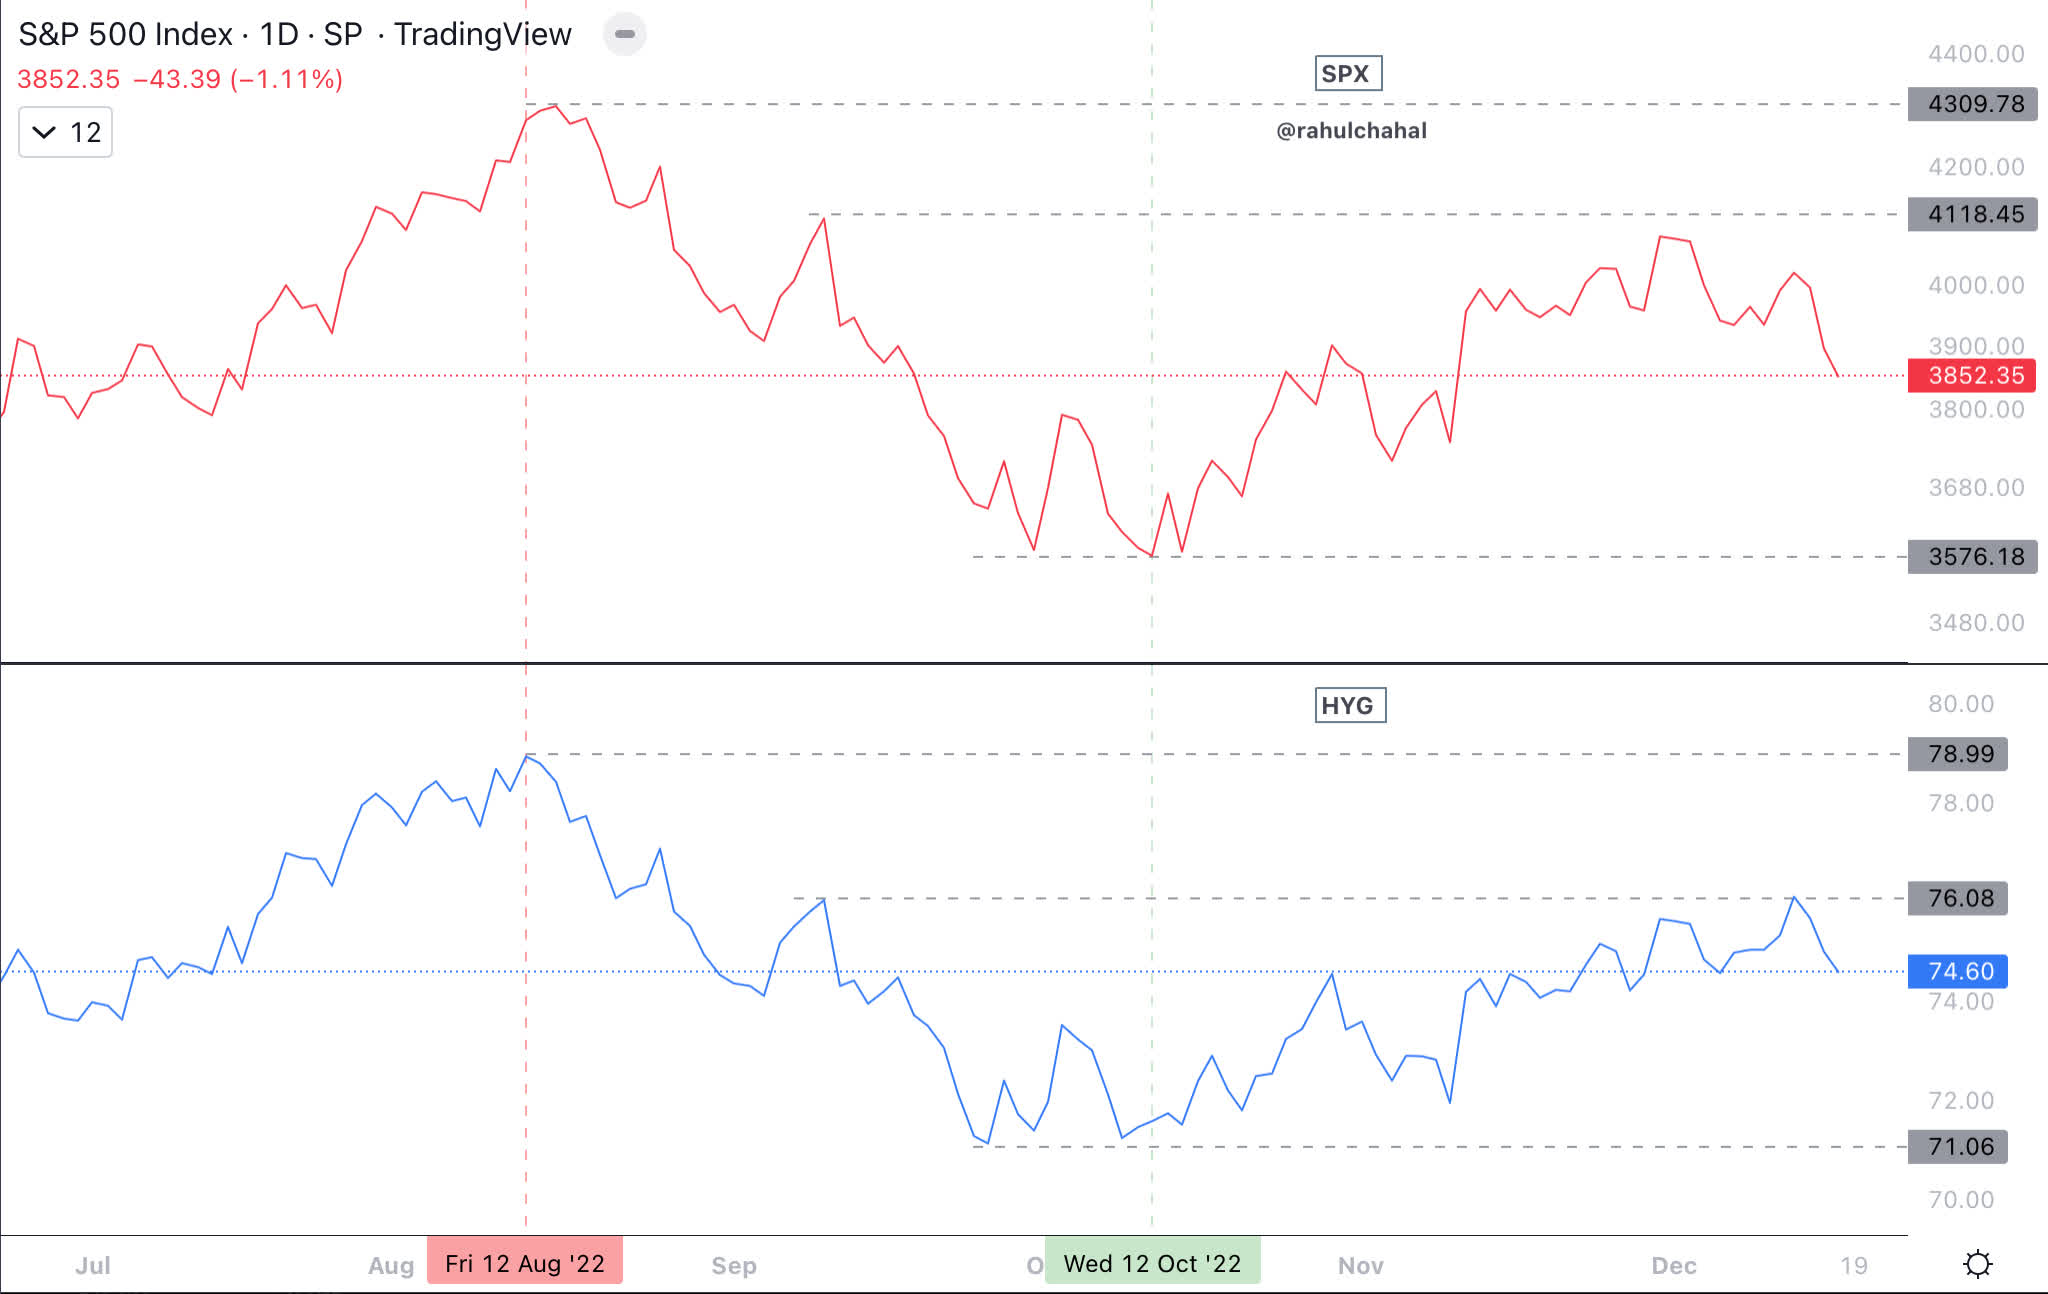
In the past, for the stock market to bottom and for it to go into an uptrend, the 30-day moving average of net new highs spiked and stayed consistently above zero. “Net new highs” is defined as new highs minus new lows. We have not had a 30-day moving average of net new highs consistently above the zero line in 2022.
Net new highs 30 day moving average (Author )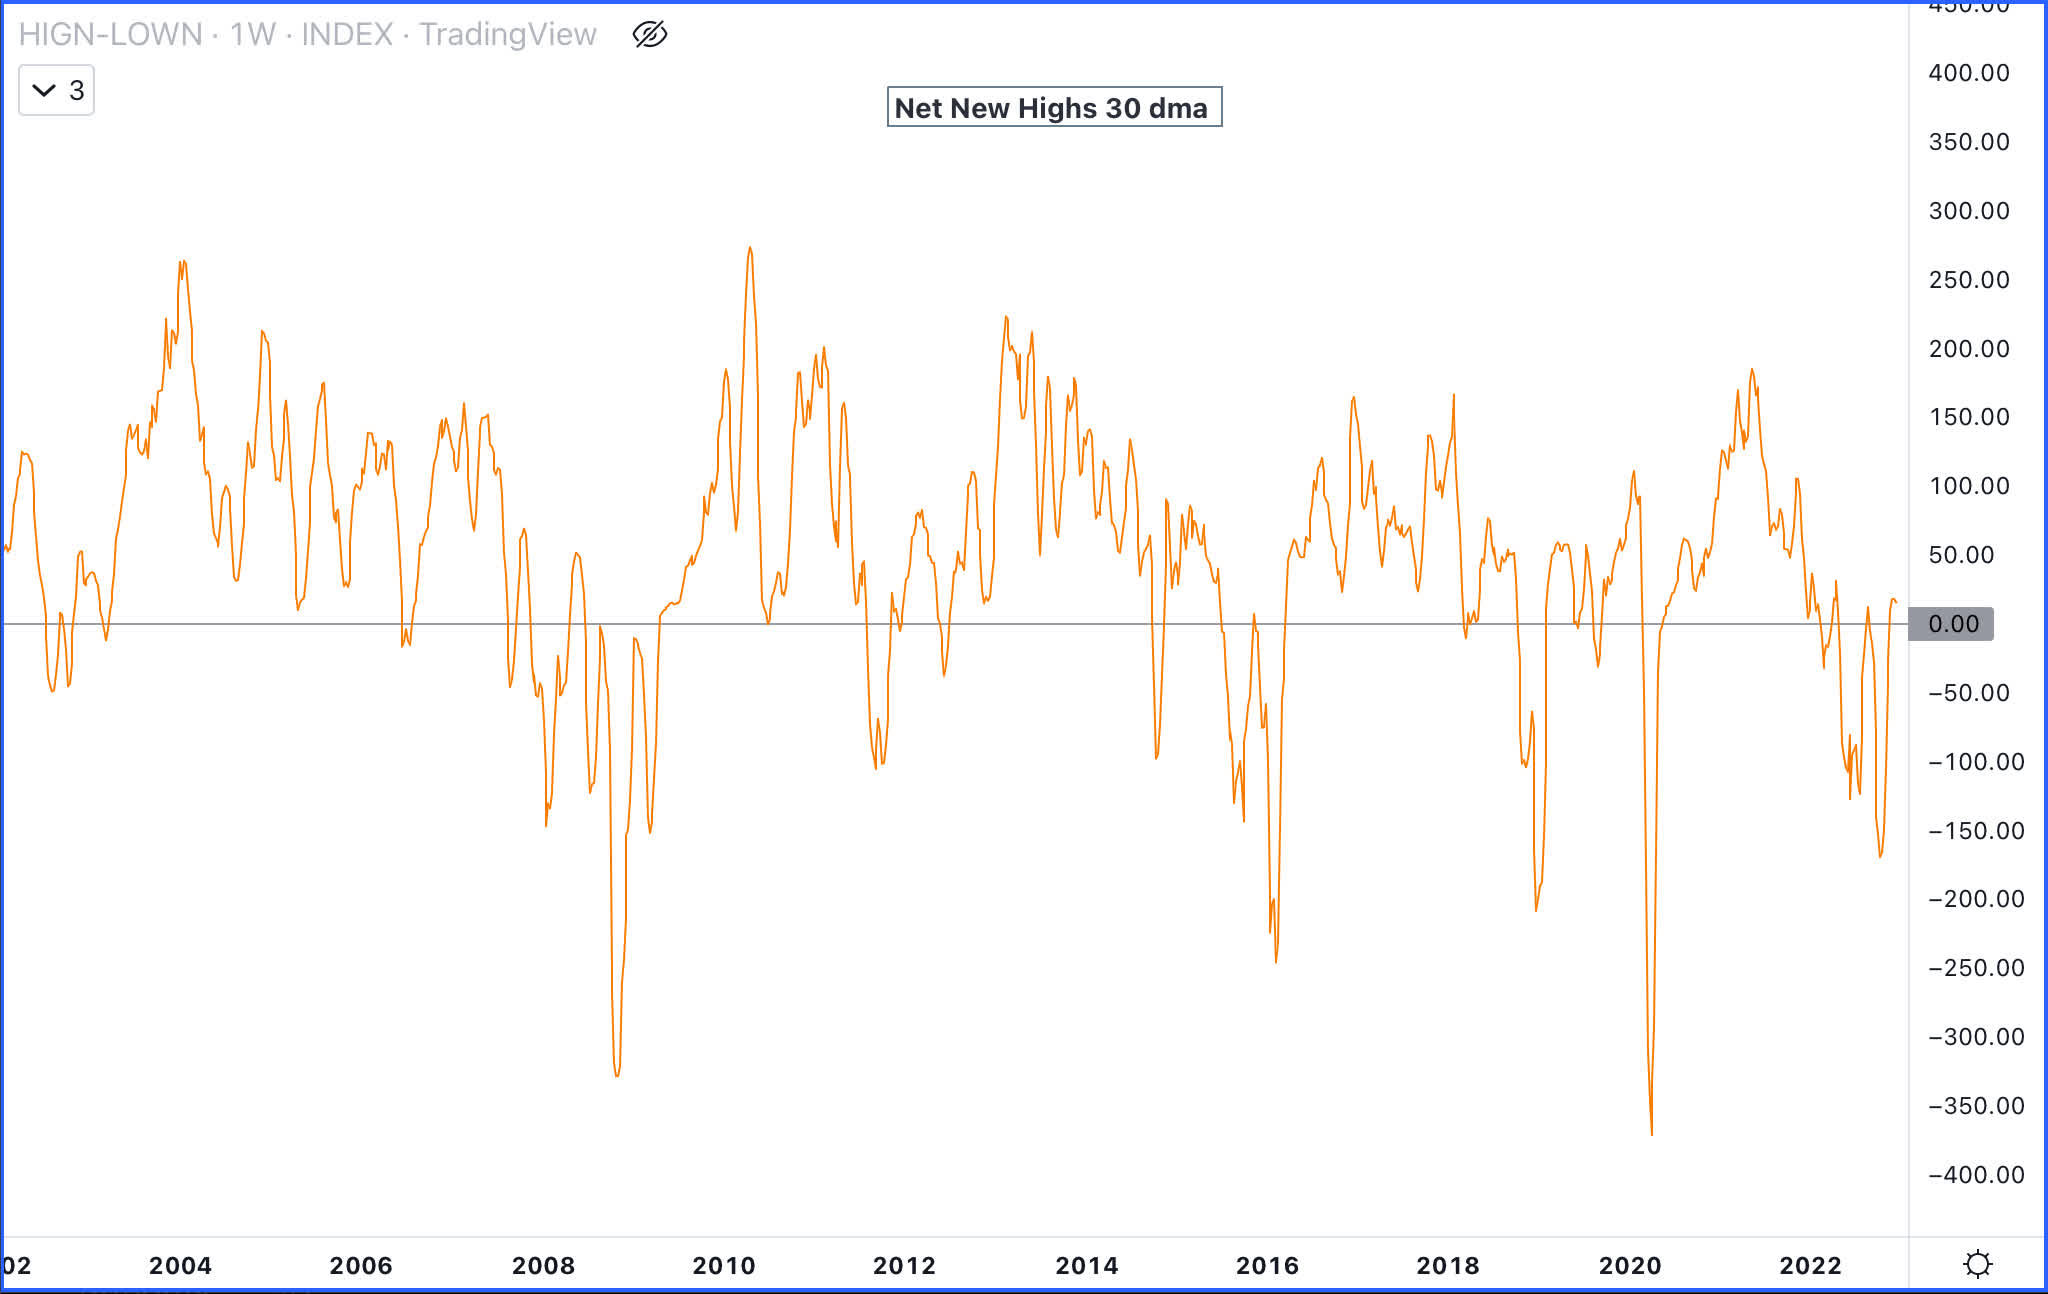
Similar to the chart above, the one below measures new highs and lows with a 10-day moving average. If one looks carefully, one can see where stocks made a bottom and the change in behavior between highs and lows.
New Lows New Highs S&P 500 Chart (Author )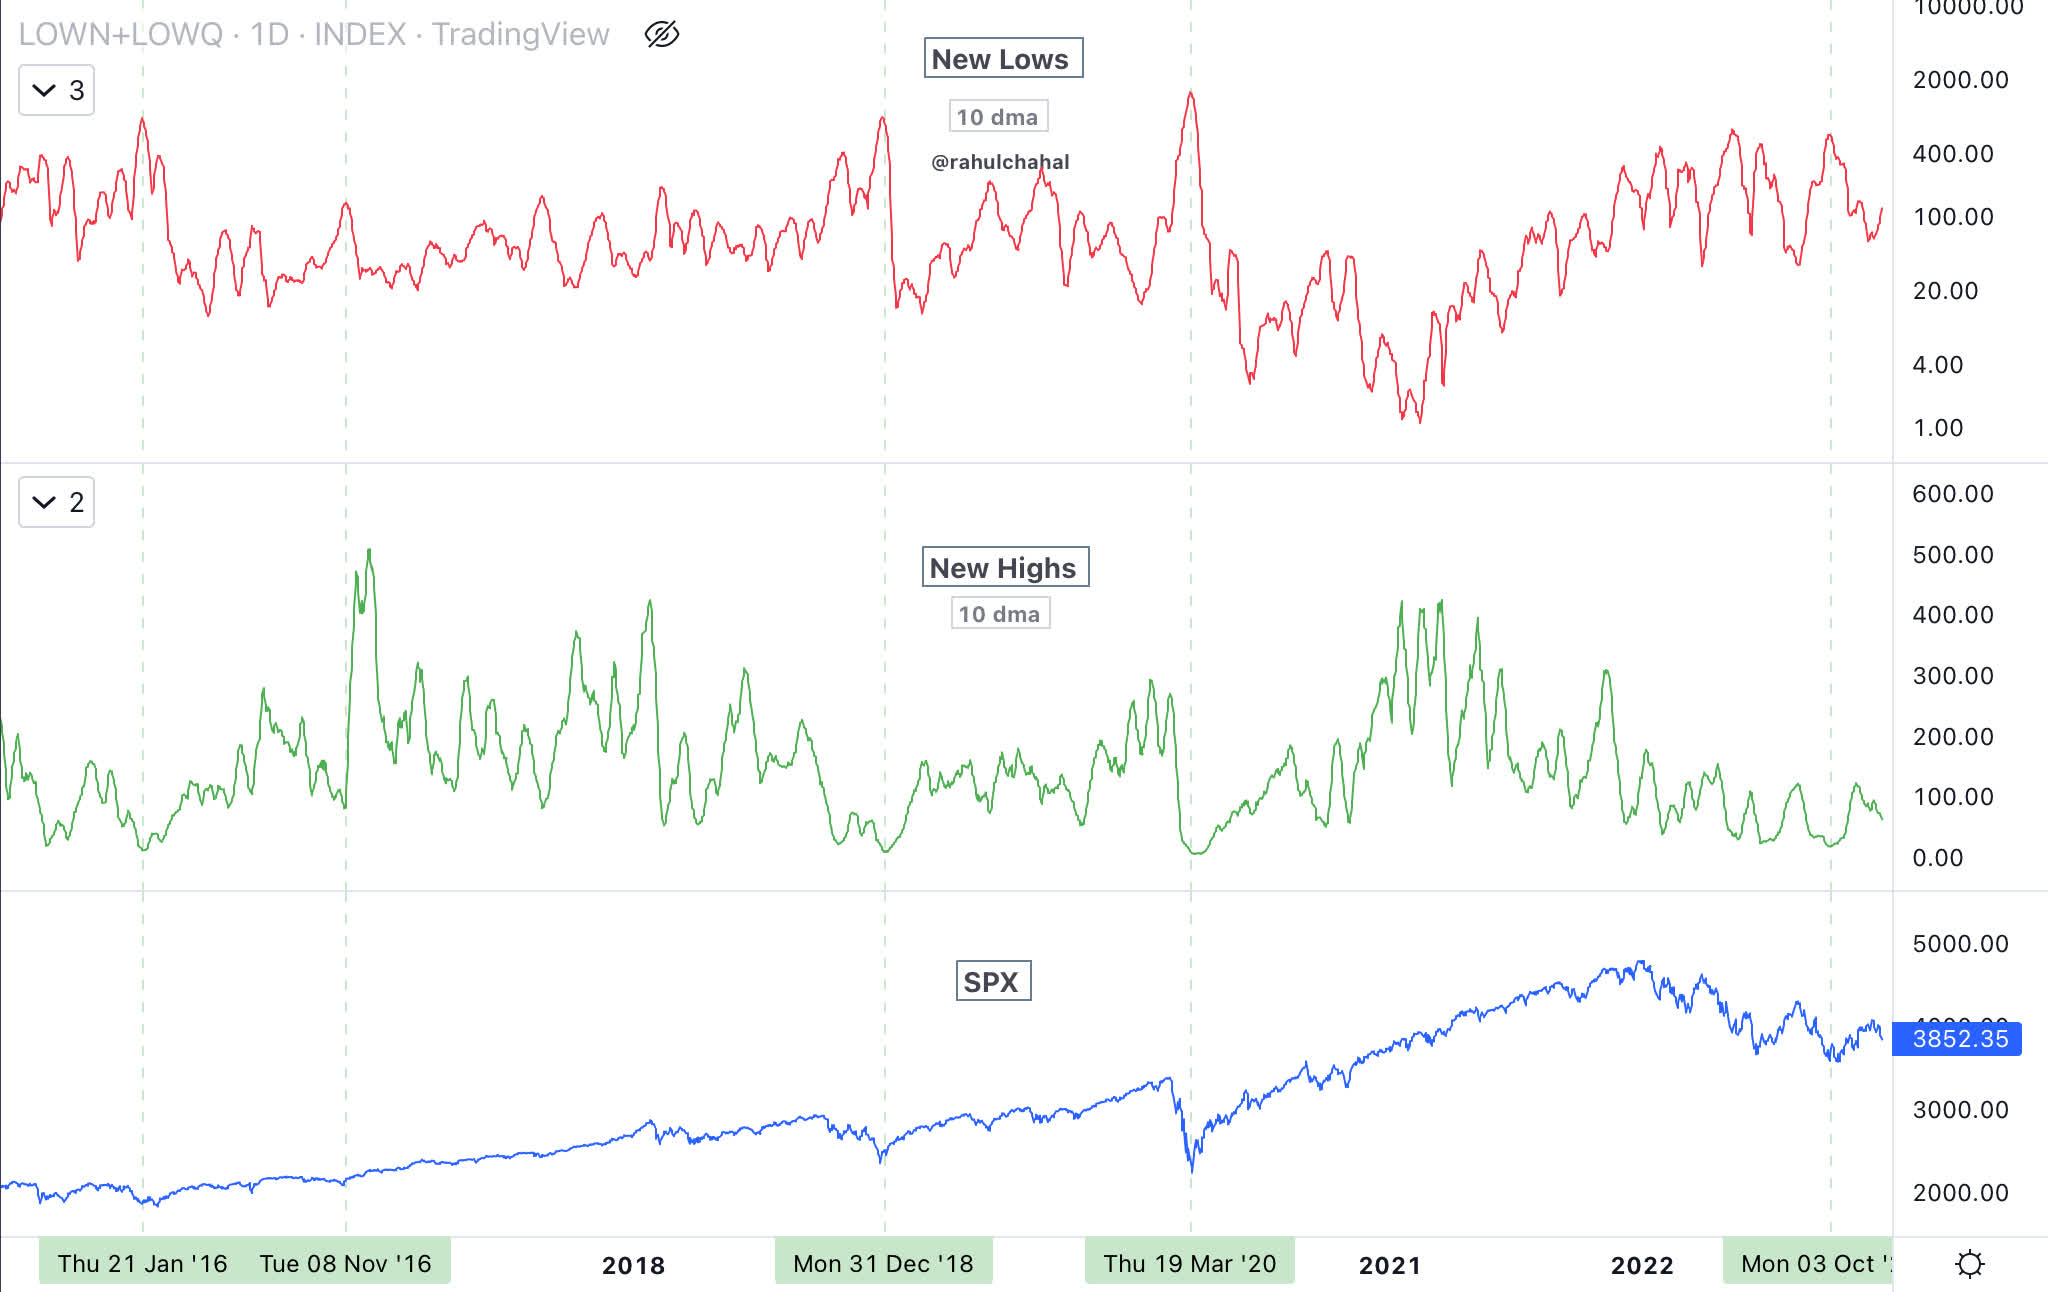
The equally weighted ratio of discretionary to staples has stayed flat for the past few weeks. A break below the June lows would be detrimental to the stock markets.
Discretionary Staples ratio and S&P 500 (Author )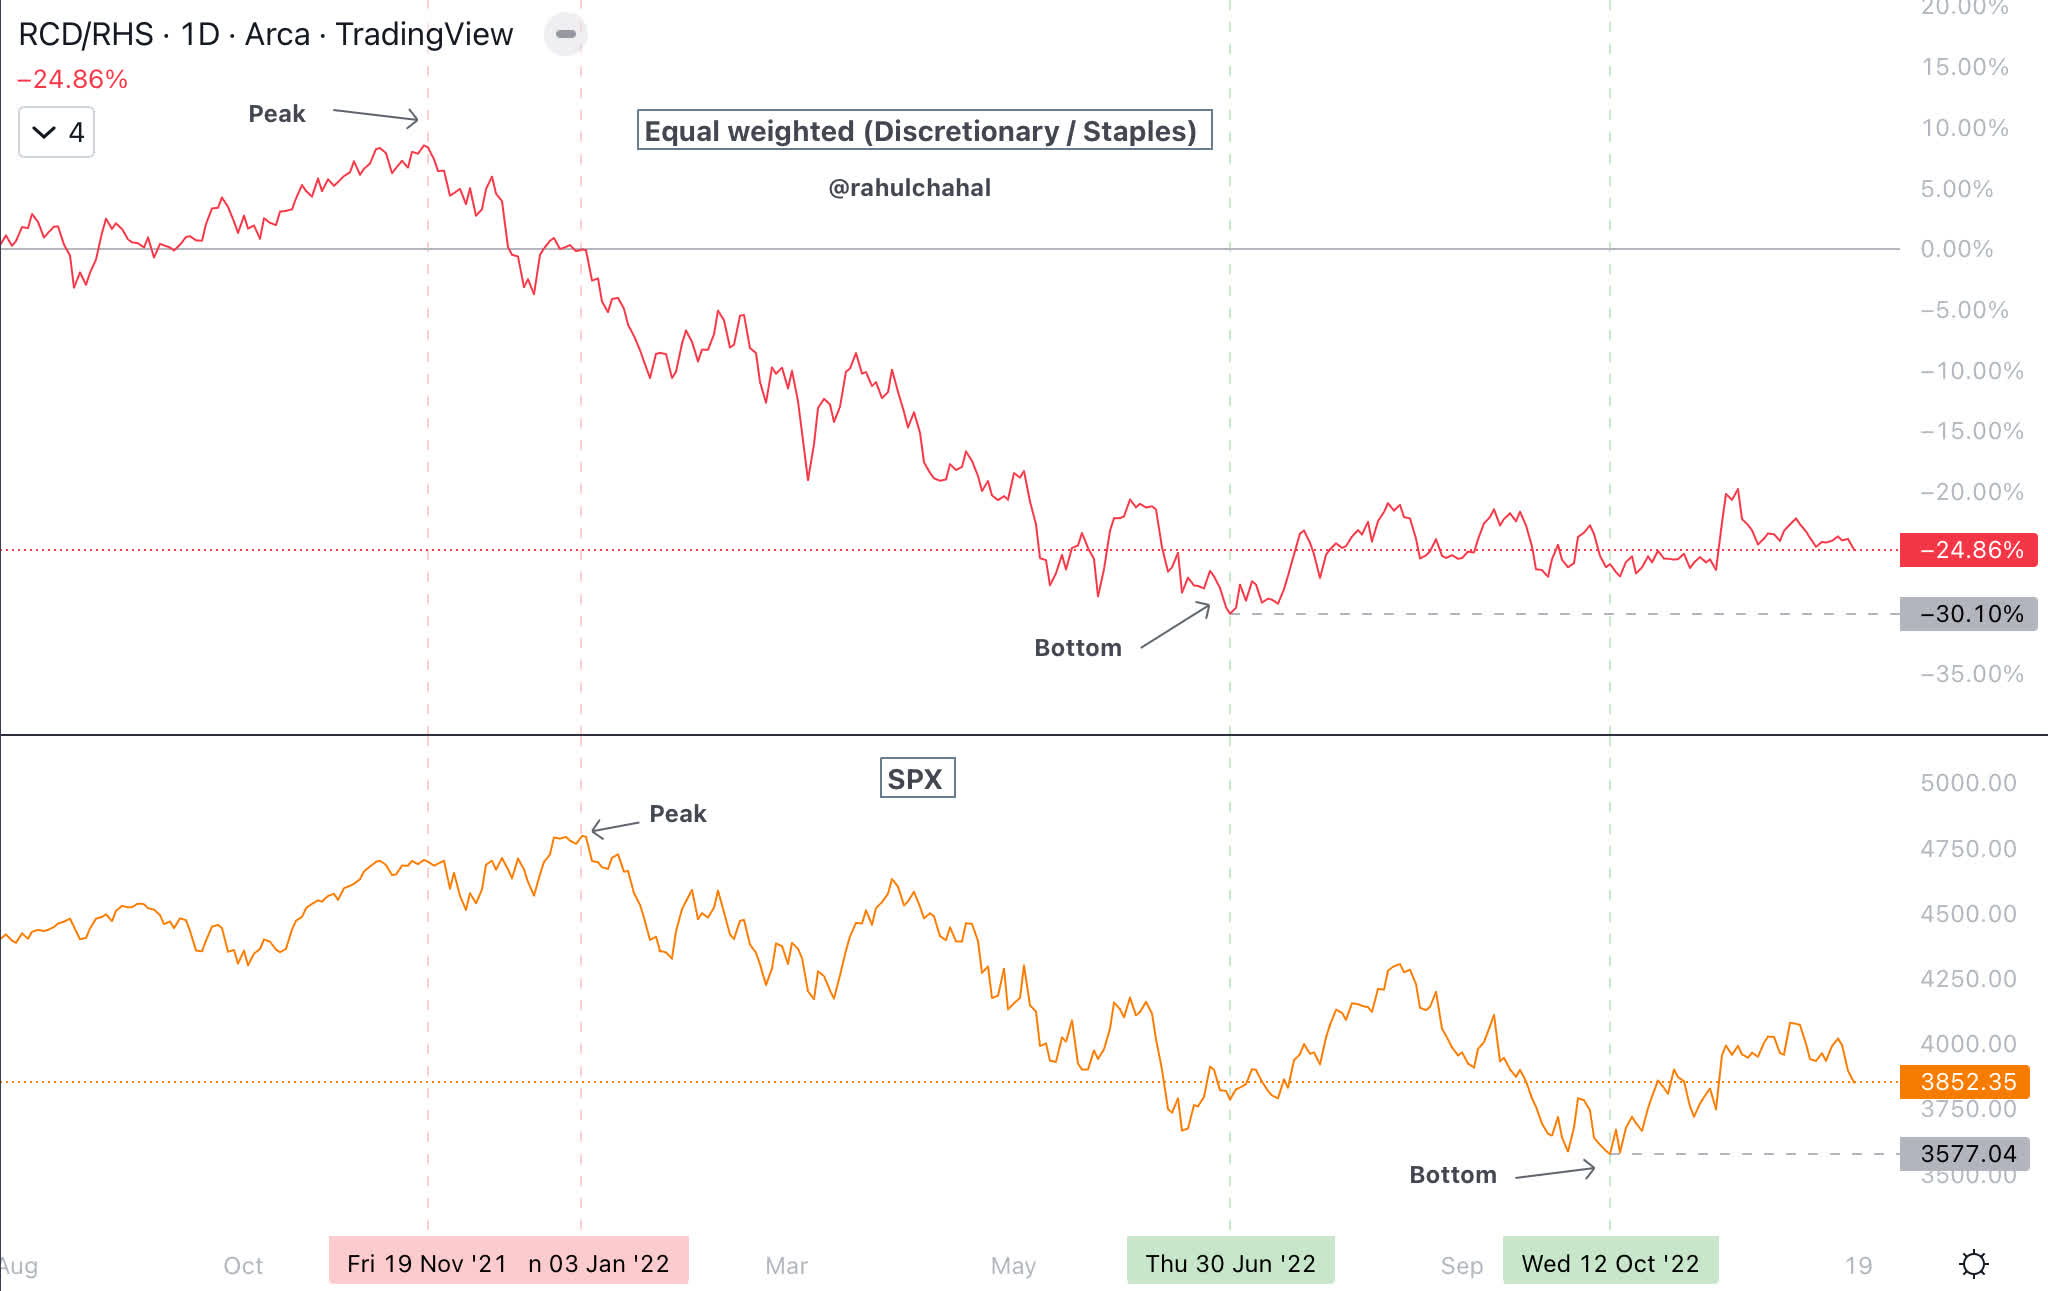
Ten-year US Treasury Bill minus Federal Funds A negative rate is not considered a positive development. Until overnight federal funds rates stop rising, we would have to expect a continued downtrend in the S&P 500.
S&P 500 and 10 year minus FFR (Author )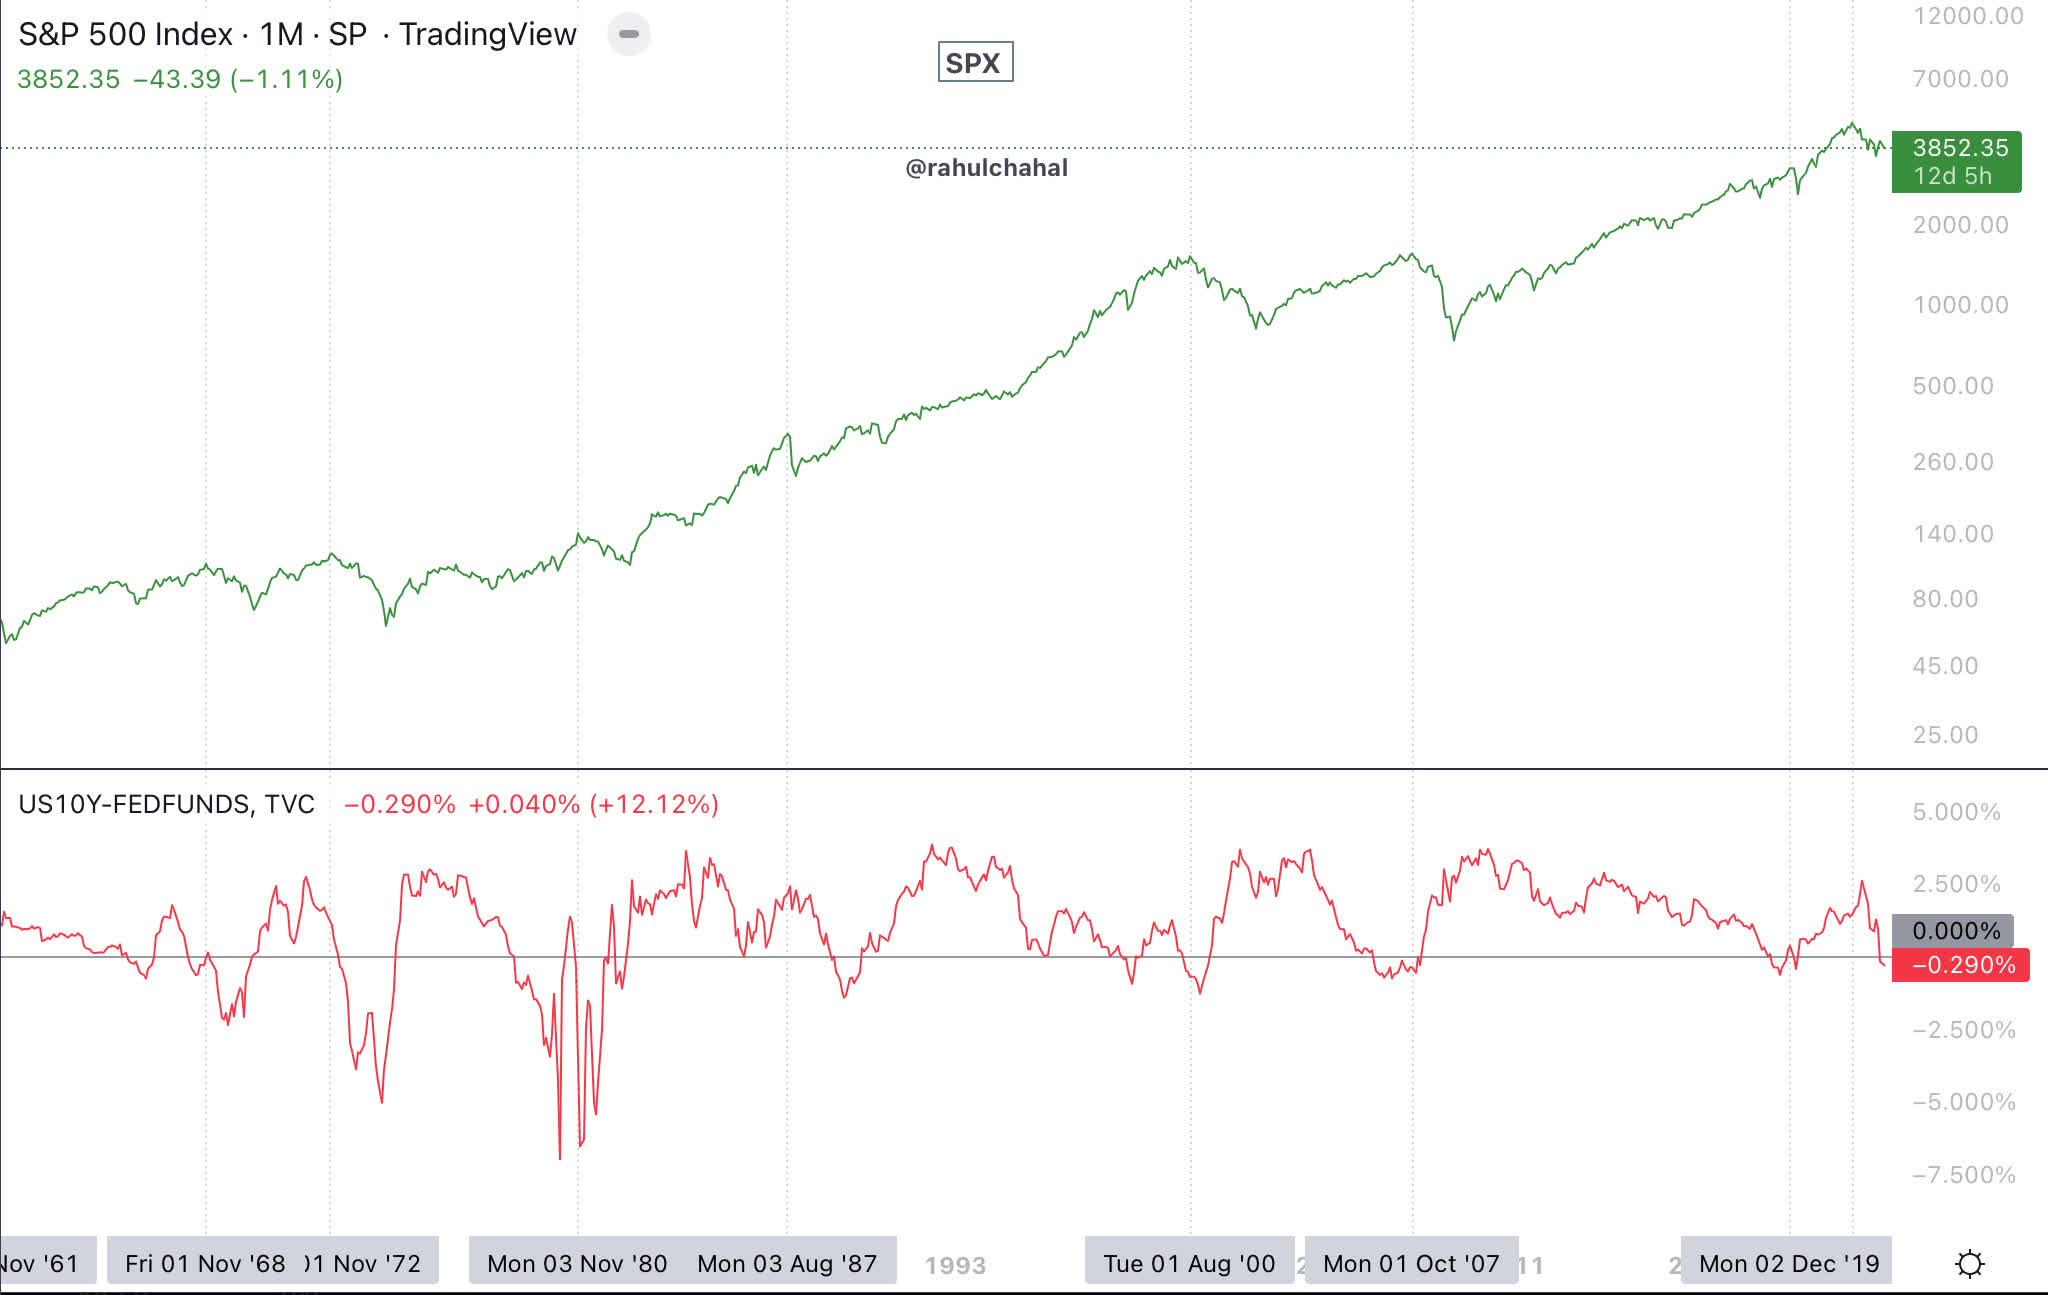
Interest Rates
The inversion of 10 and 2 years is concerning, especially if it lasts more than a few days and is deep. Since early July 2022, the 10 year and 2 year charts have been inverted, and the inversion bottomed at around 0.83%.
10 year minus 2 year treasury (Federal Reserve Bank of St Louis)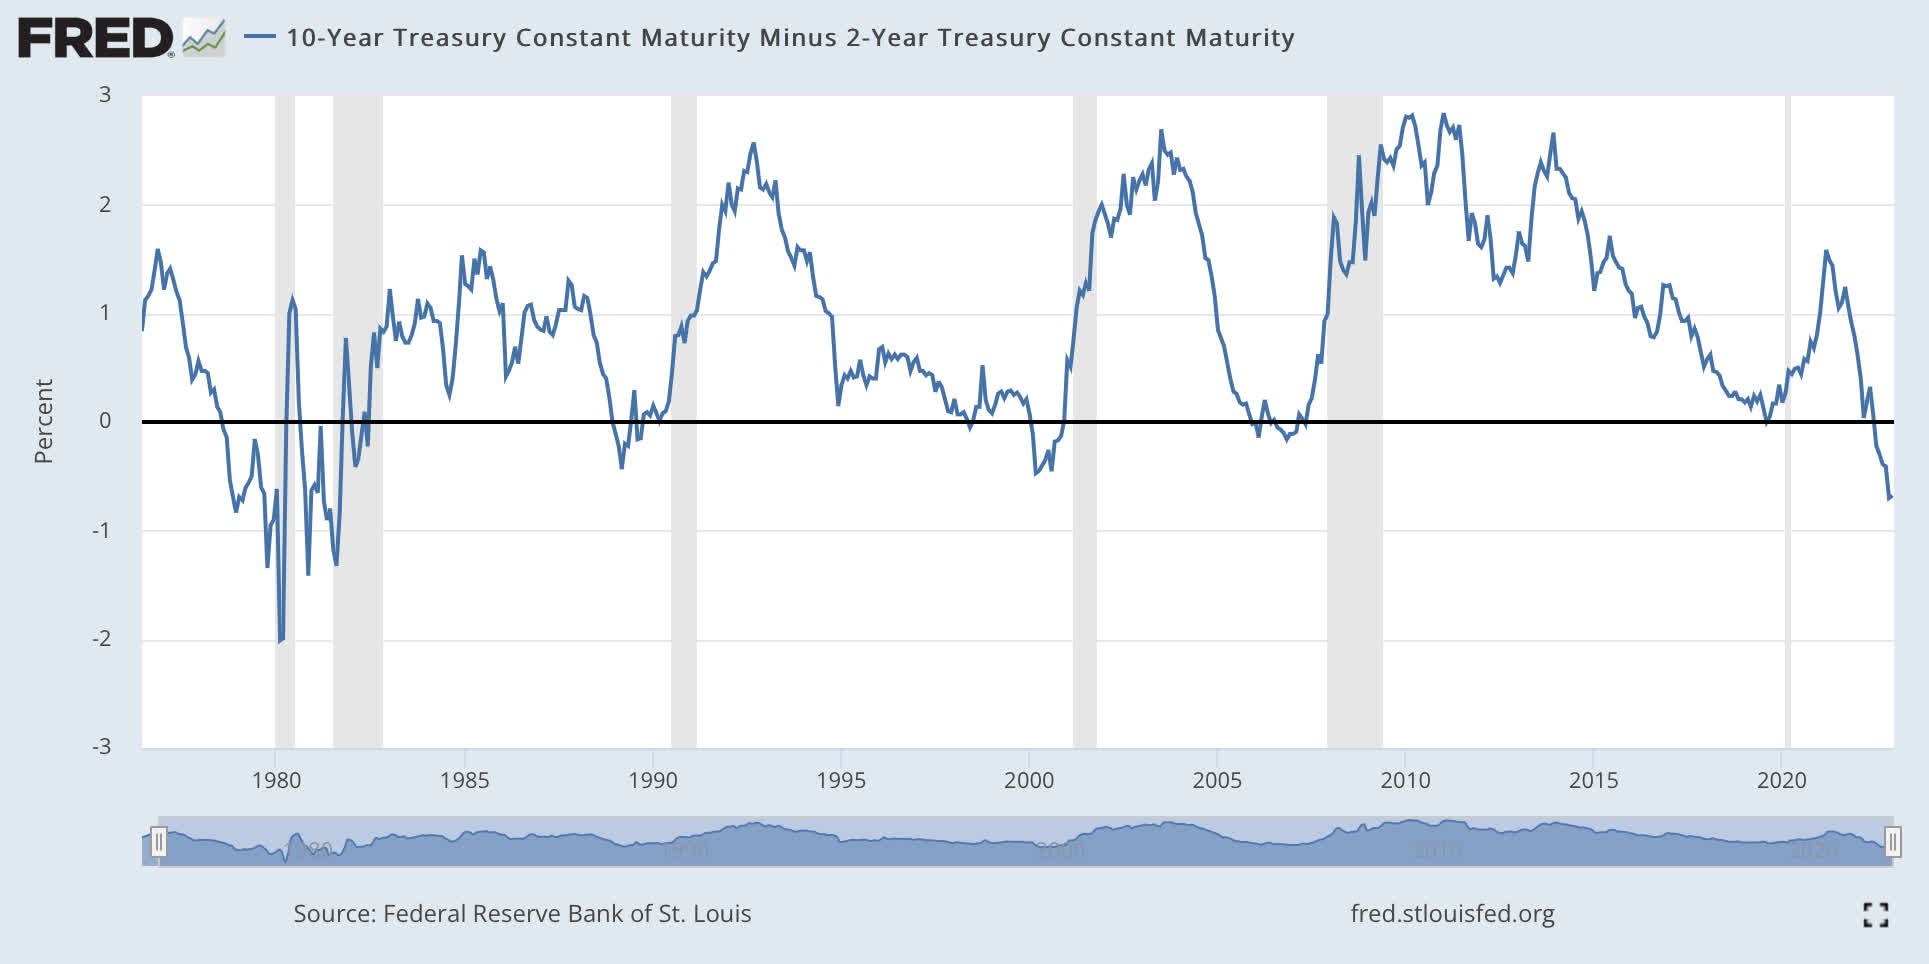
The other inversion that is closely followed is the 10 year and 3 month, which has been inverted since late October 2022.
10 year minus 3 month (Federal Bank of St Louis)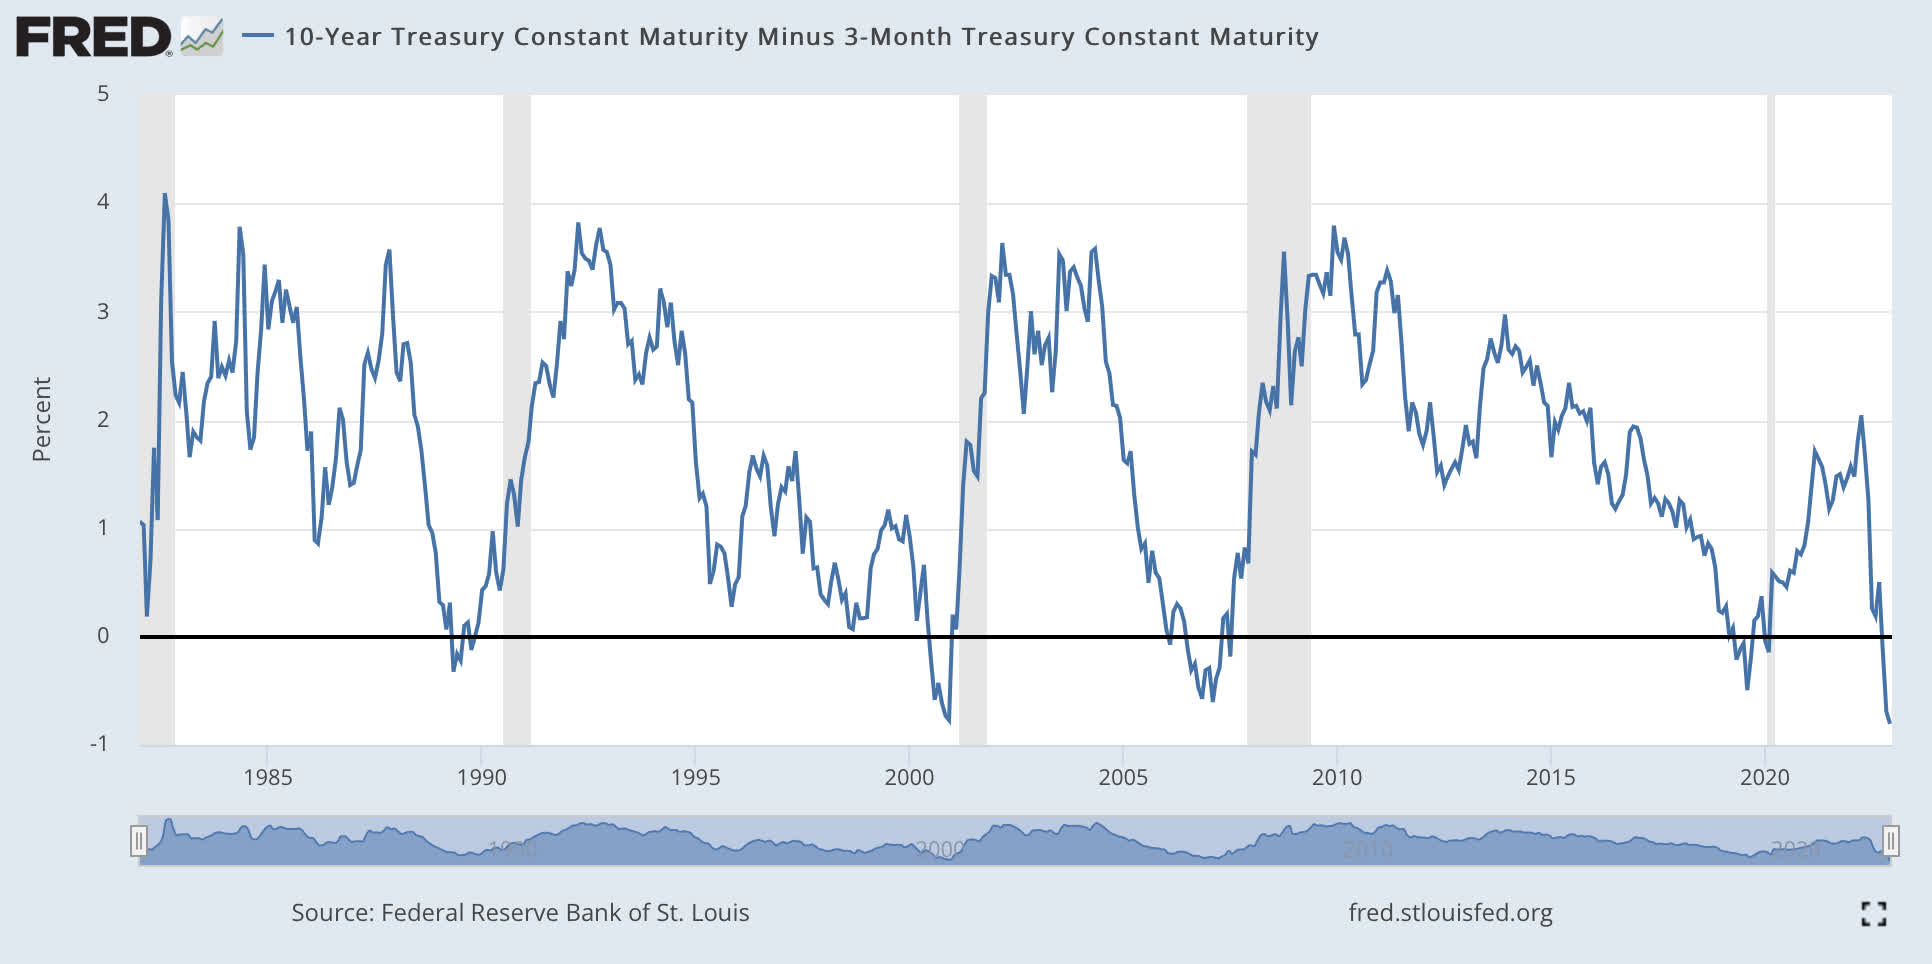
Yield curve is inverted across the rate spectrum.
Yield Curve (GuruFocus)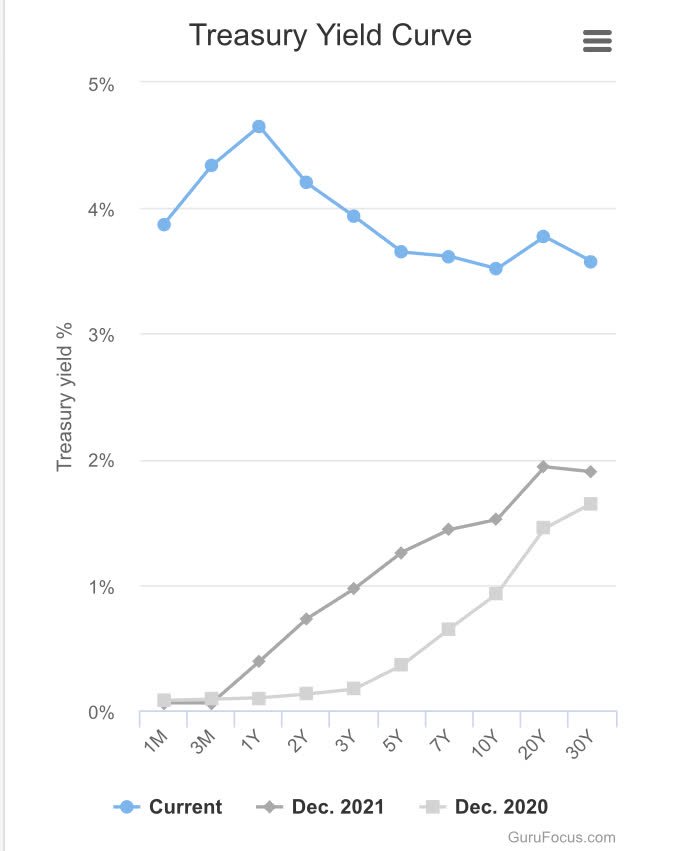
VIX futures are in contango, though VIX levels across the board are high.
VIX Term Structure (VIX Central )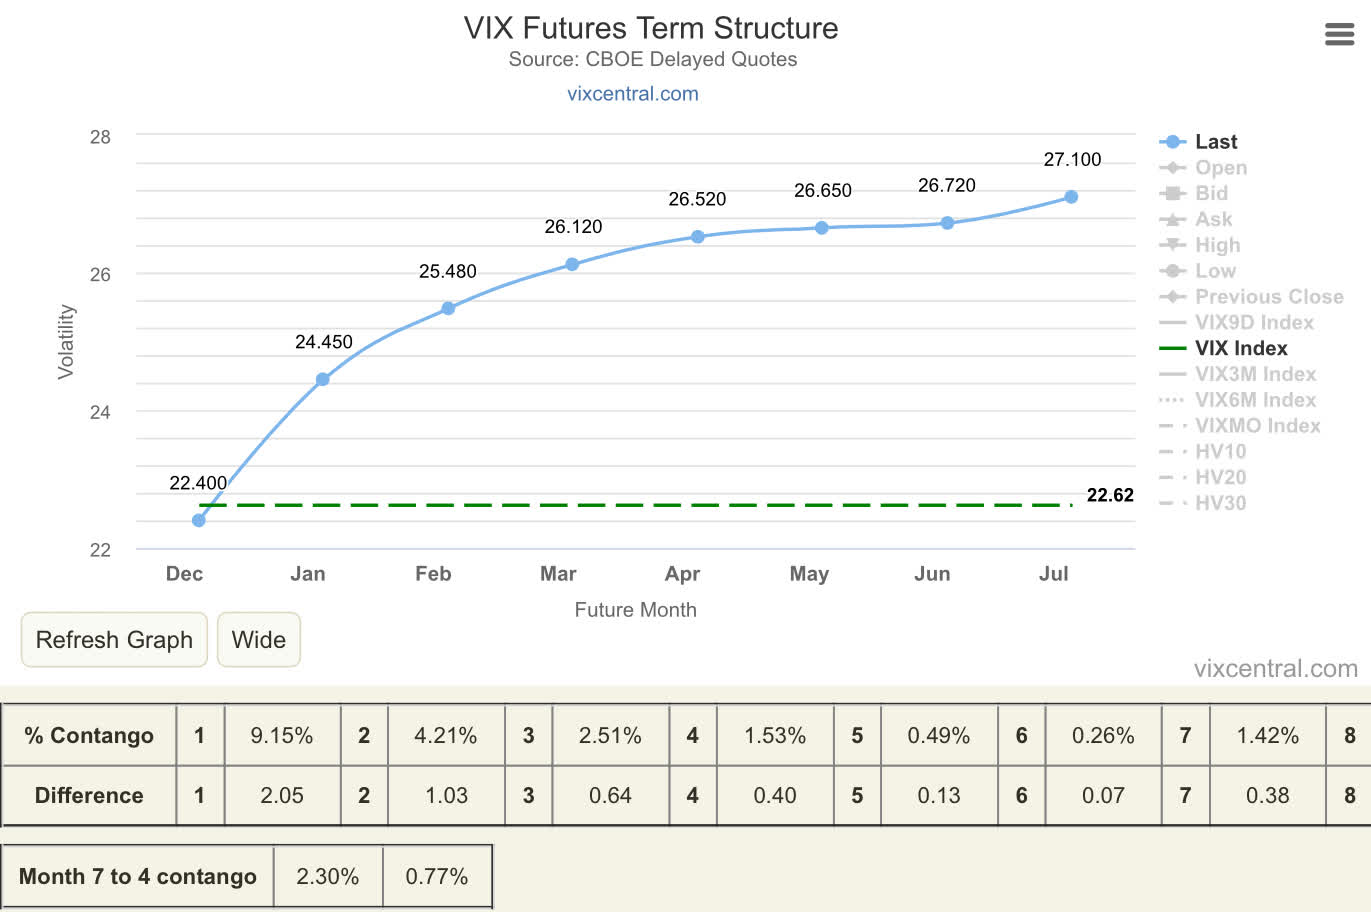
Market exposure and Sentiment
National Association of Accredited Investment Managers (NAAIM) allocation to the stock market has been increasing steadily for the past few weeks.
NAAIM and S&P 500 (NAAIM Website )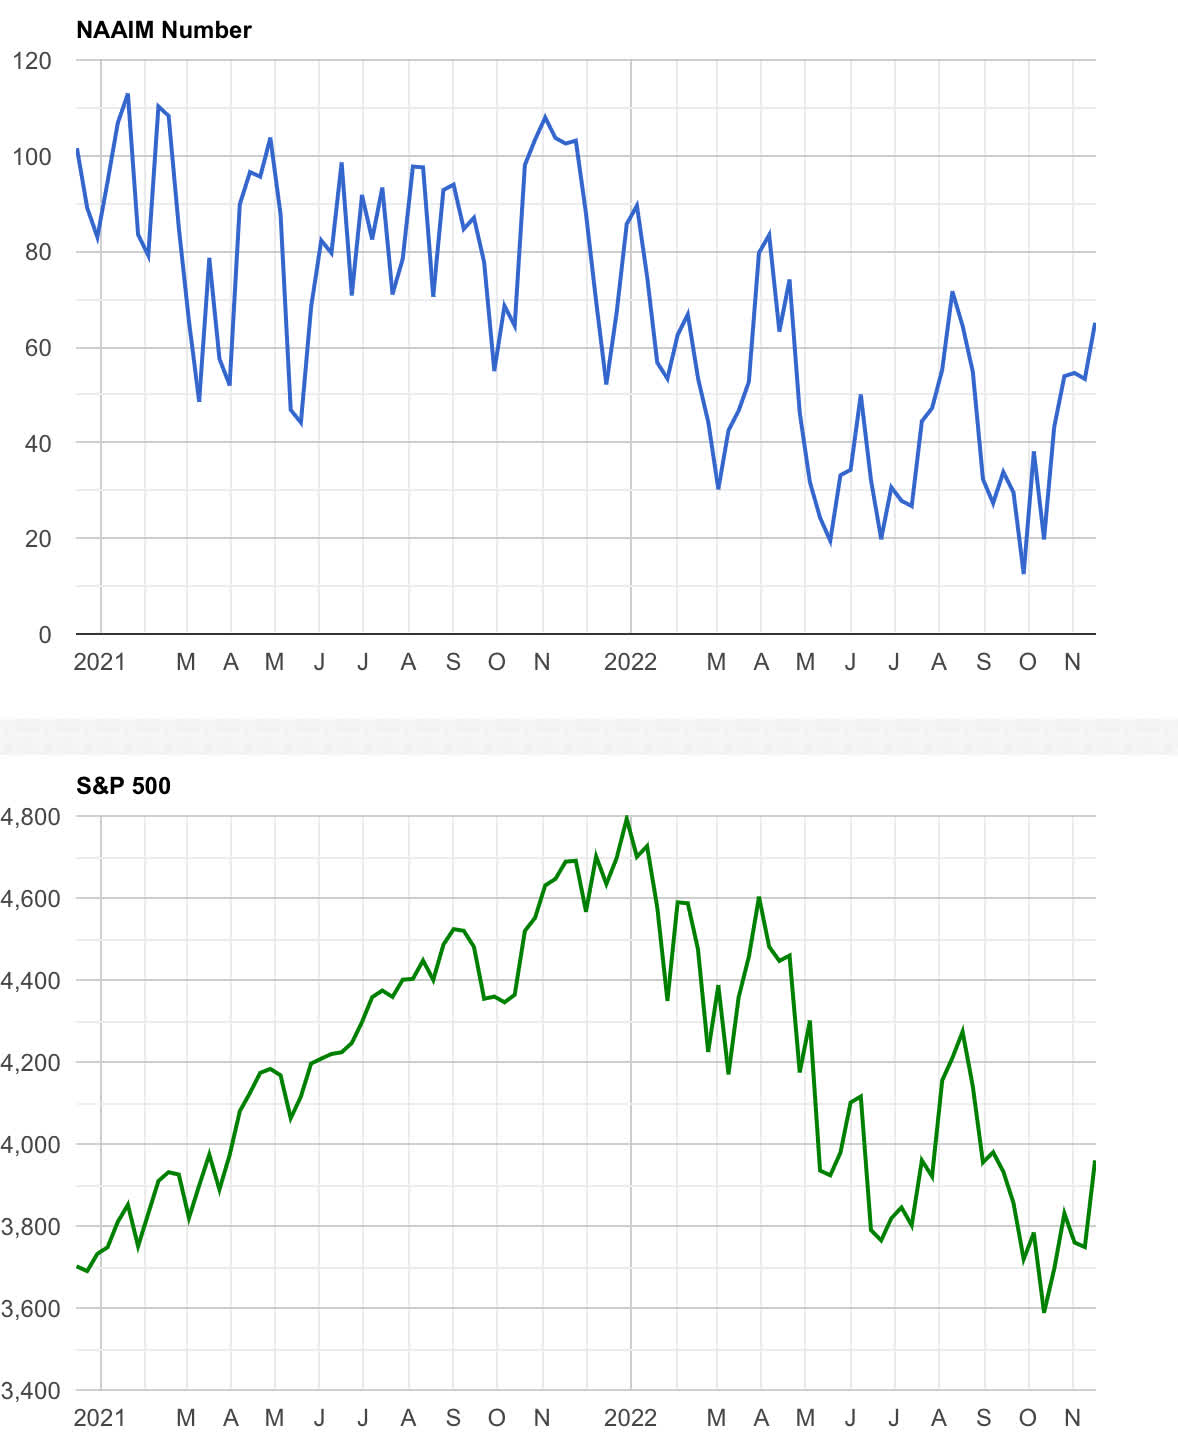
Sentiment as measured by AAII survey continues to show high bearish reading and low bullish reading continuously for weeks.
AAII Sentiment (AAII)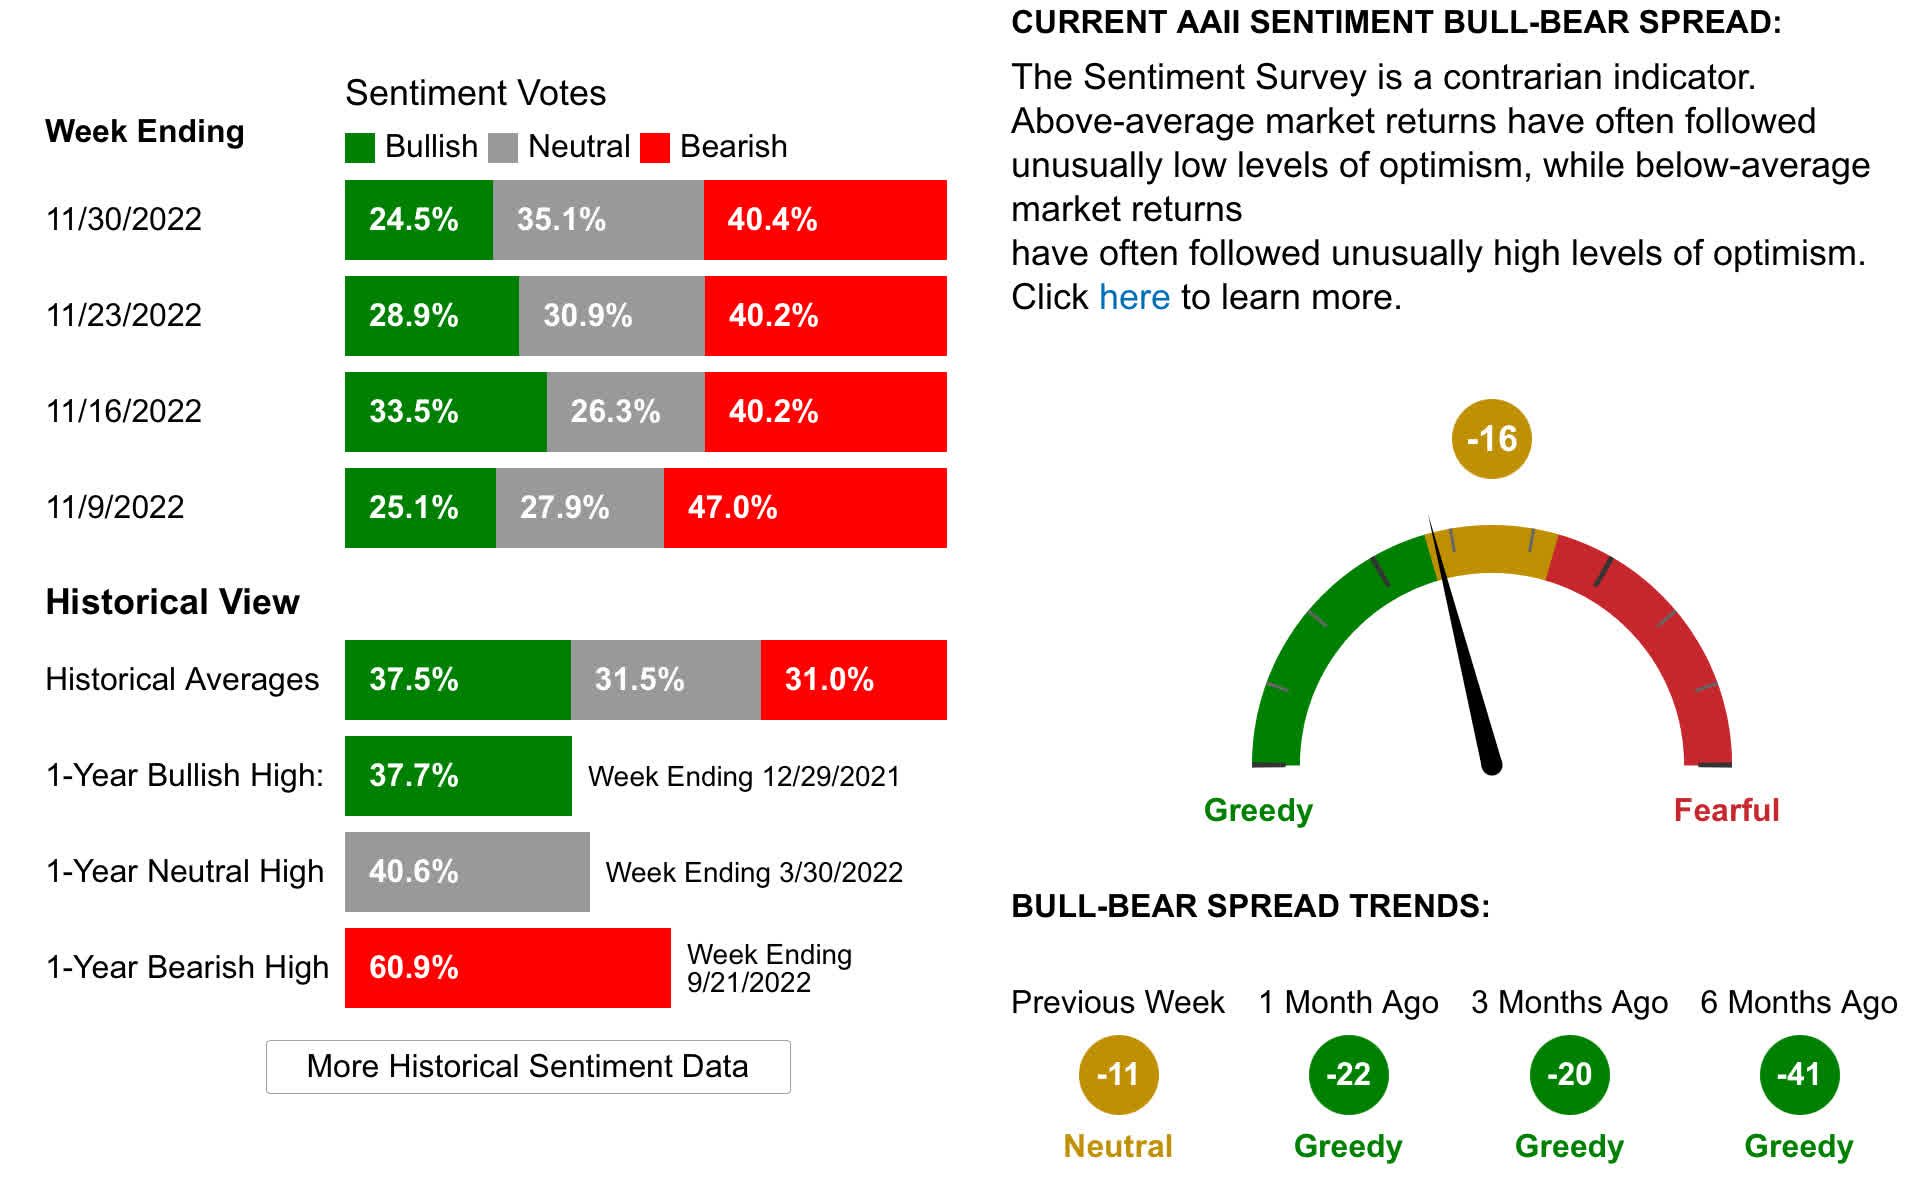
Commodity Prices
The series of charts below are for about a year and show that commodity prices for crude oil, natural gas, copper, lumber, silver, wheat, and corn increased. Most of these commodities have been declining since reaching a high in late spring or early summer, and some are now trading at prices lower than a year ago.
Crude oil prices are roughly where they were a year ago.
Crude Oil Chart (Author )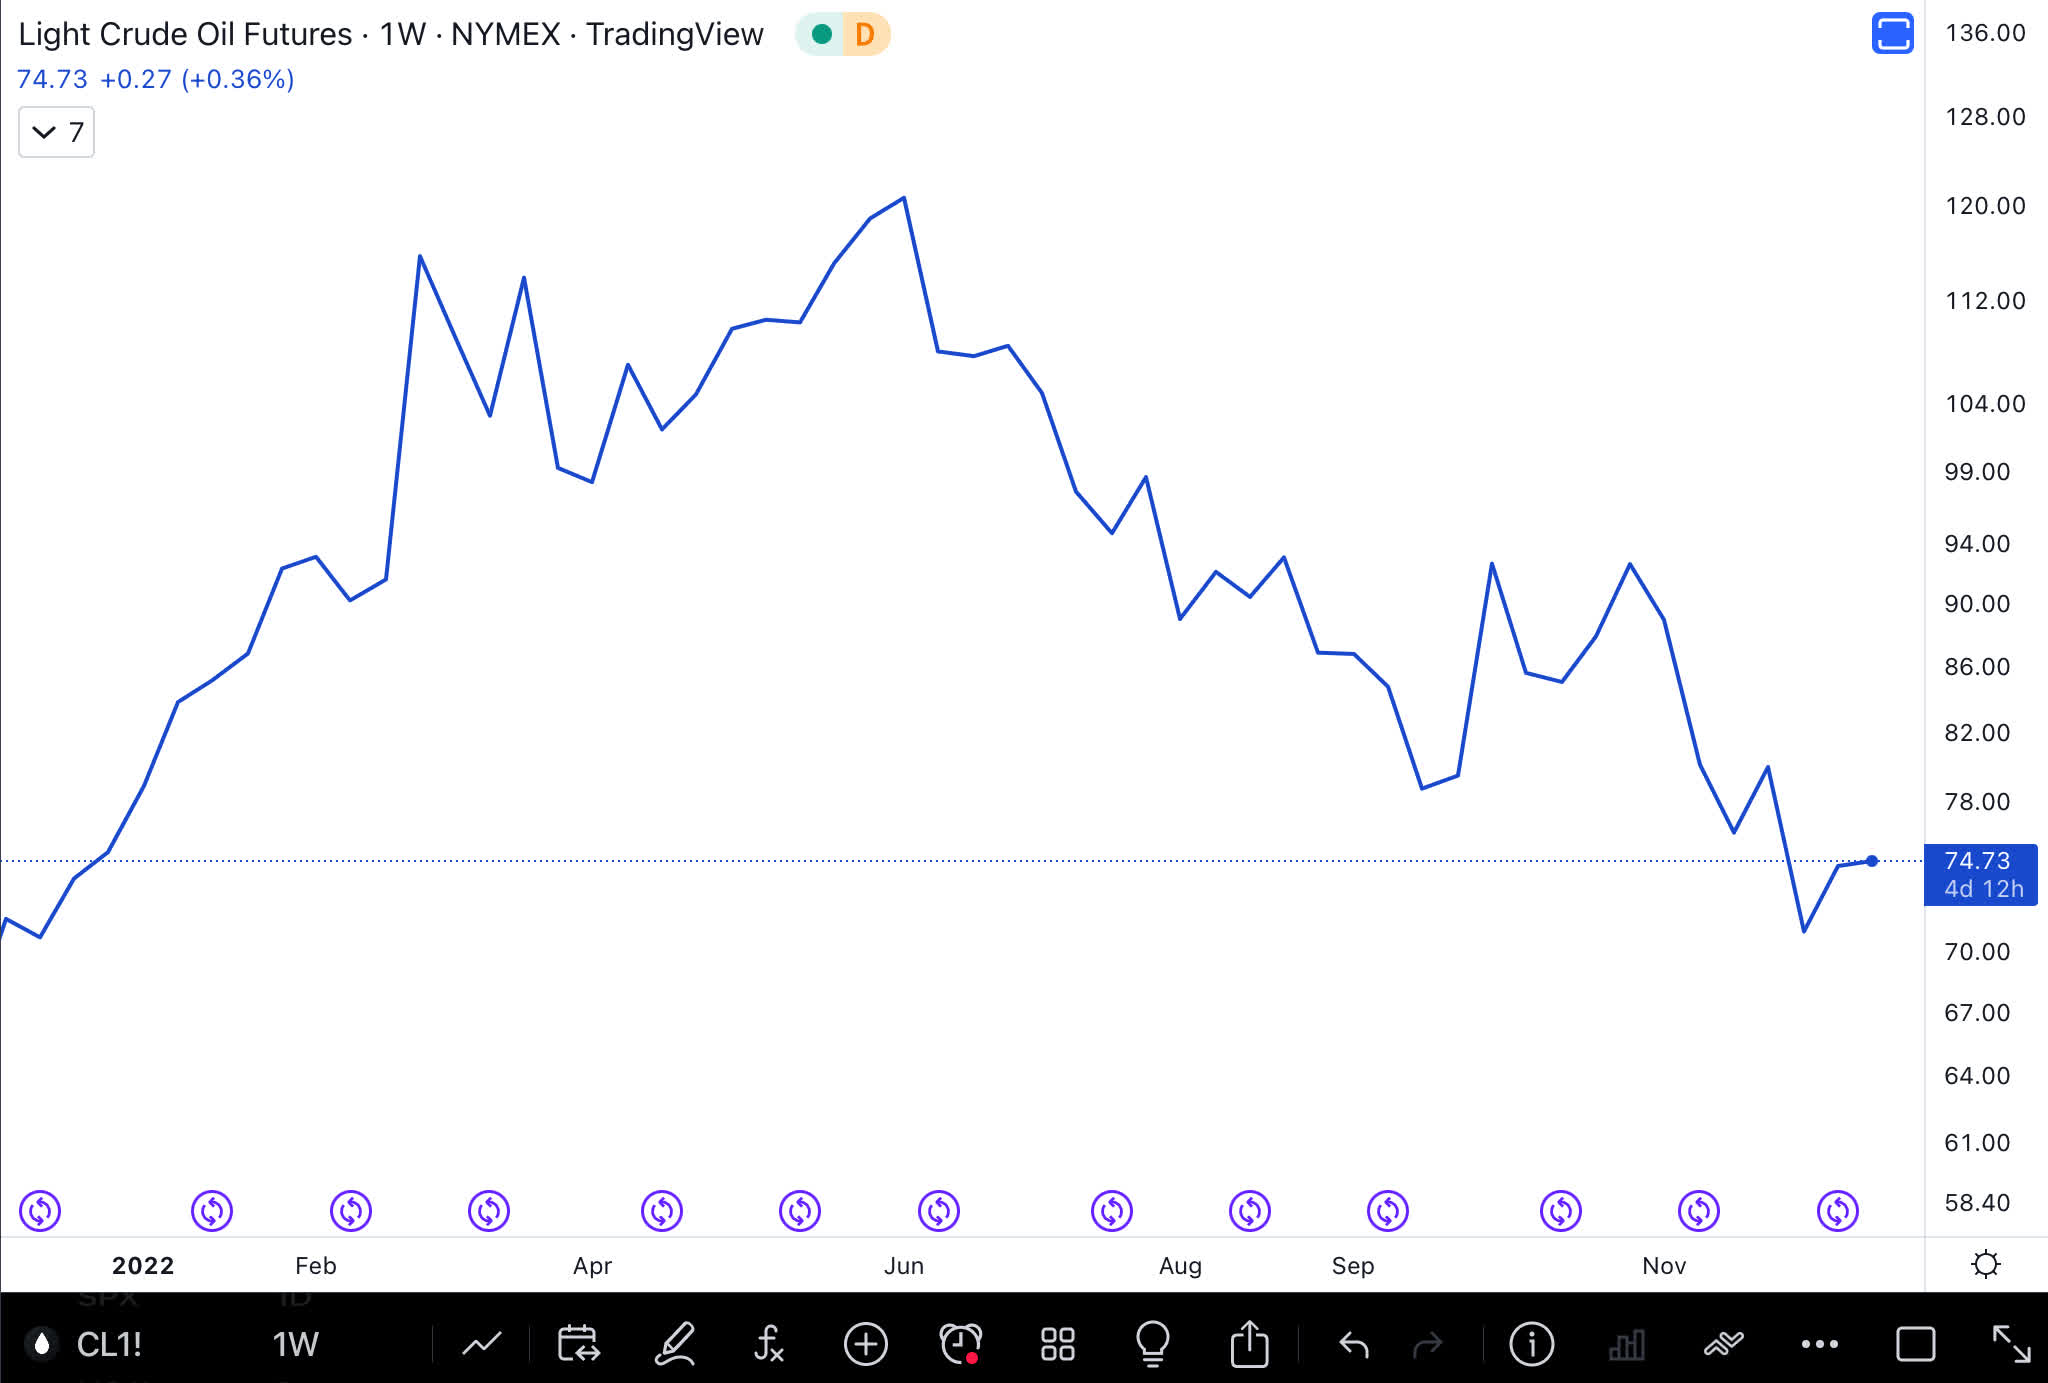
Natural gas futures have been declining well below the summer peak.
Natural Gas (Author )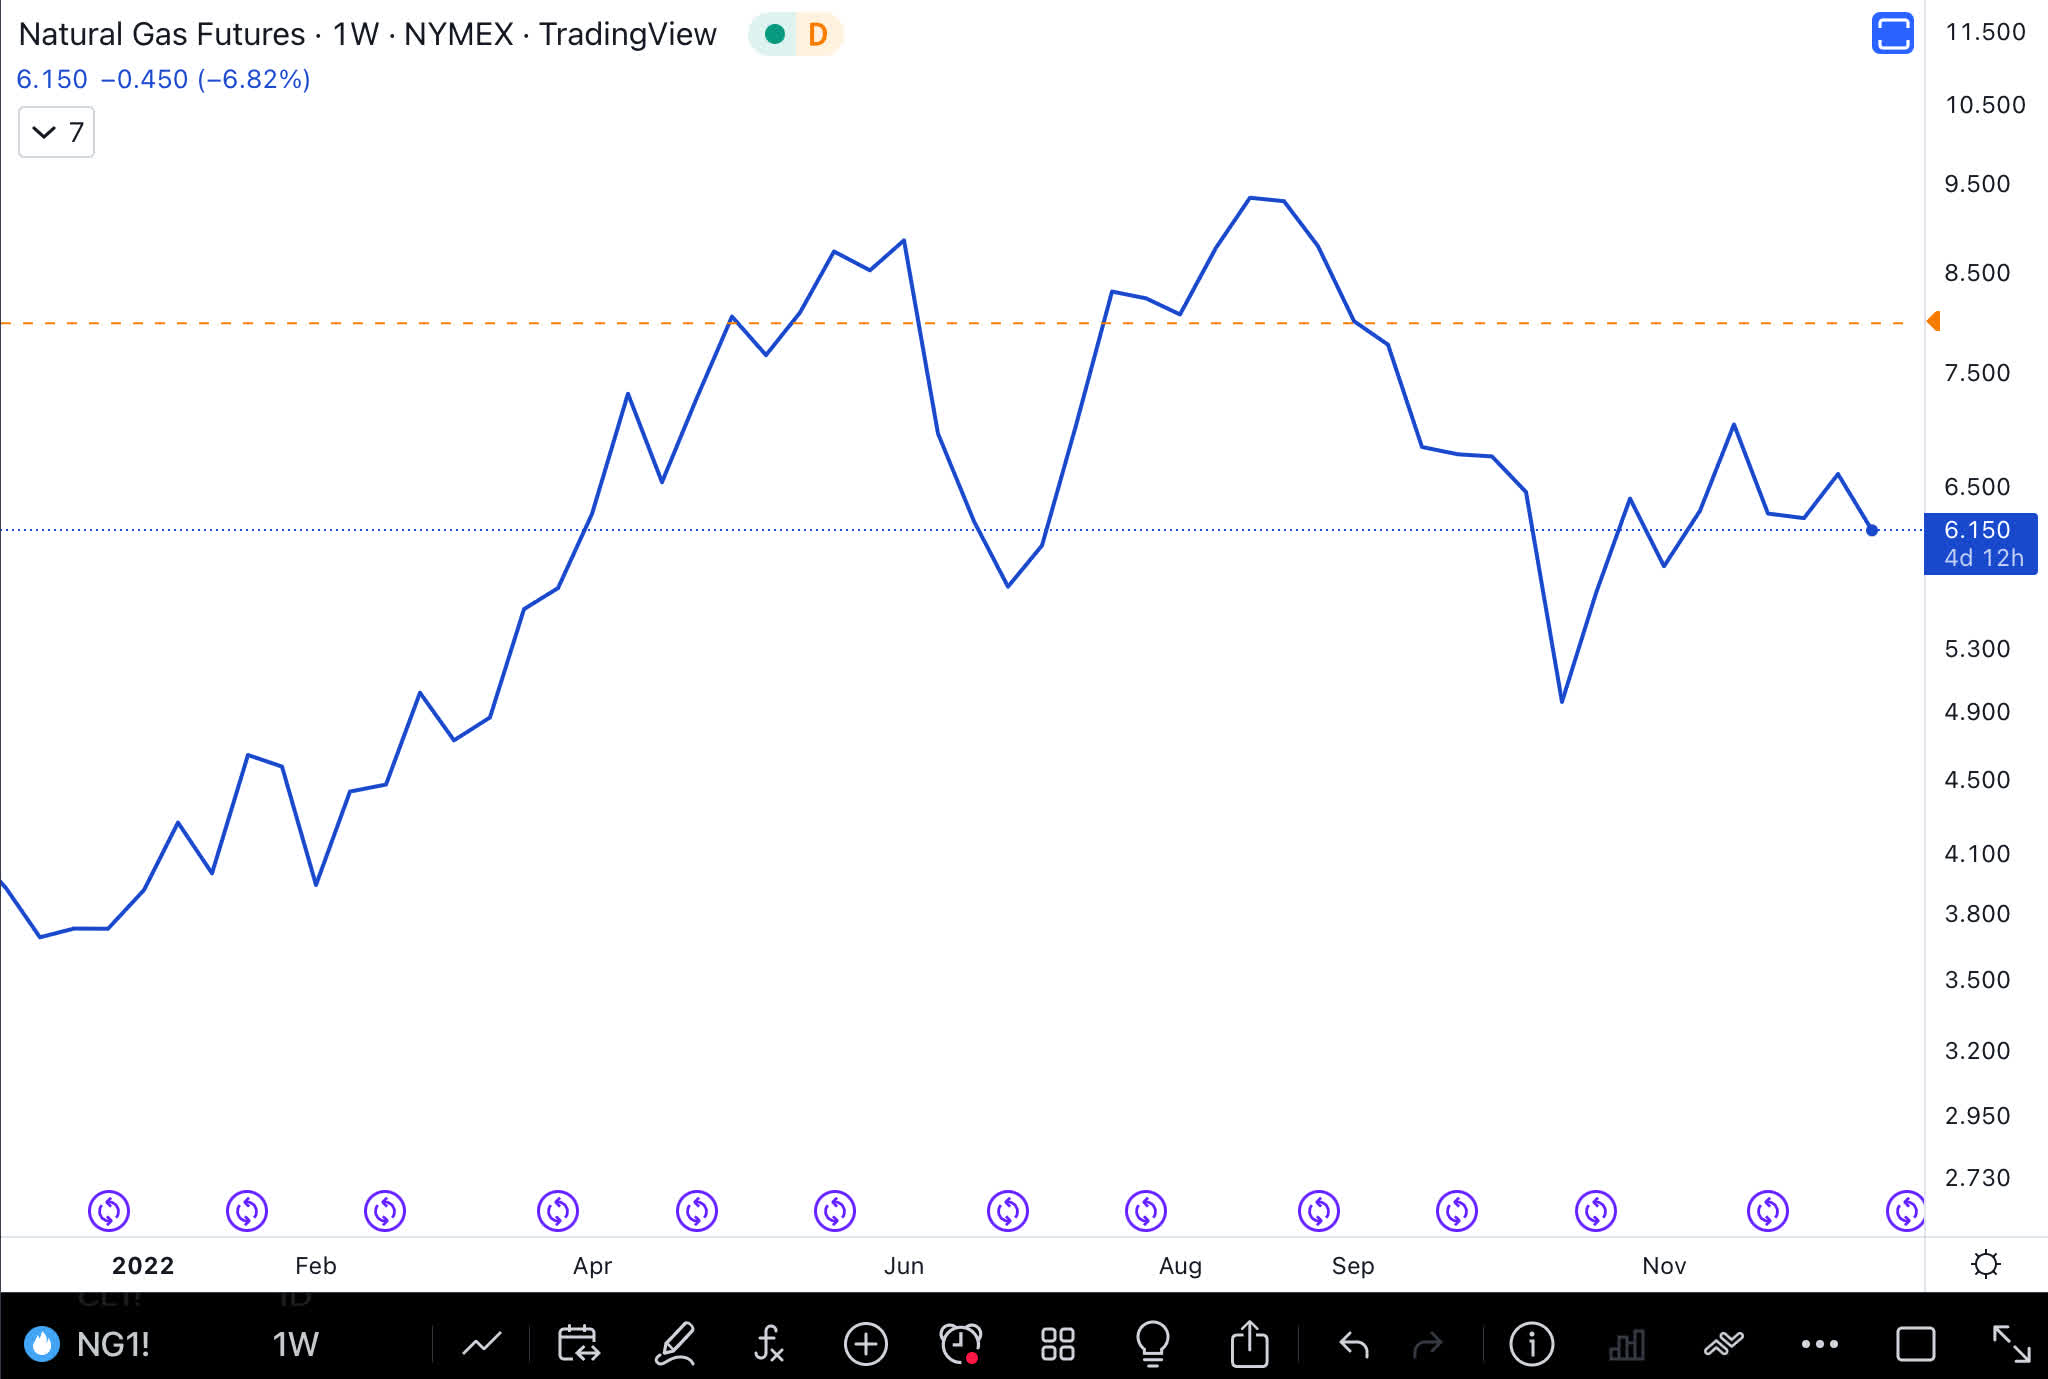
Copper futures are lower than a year ago.
Copper (Author )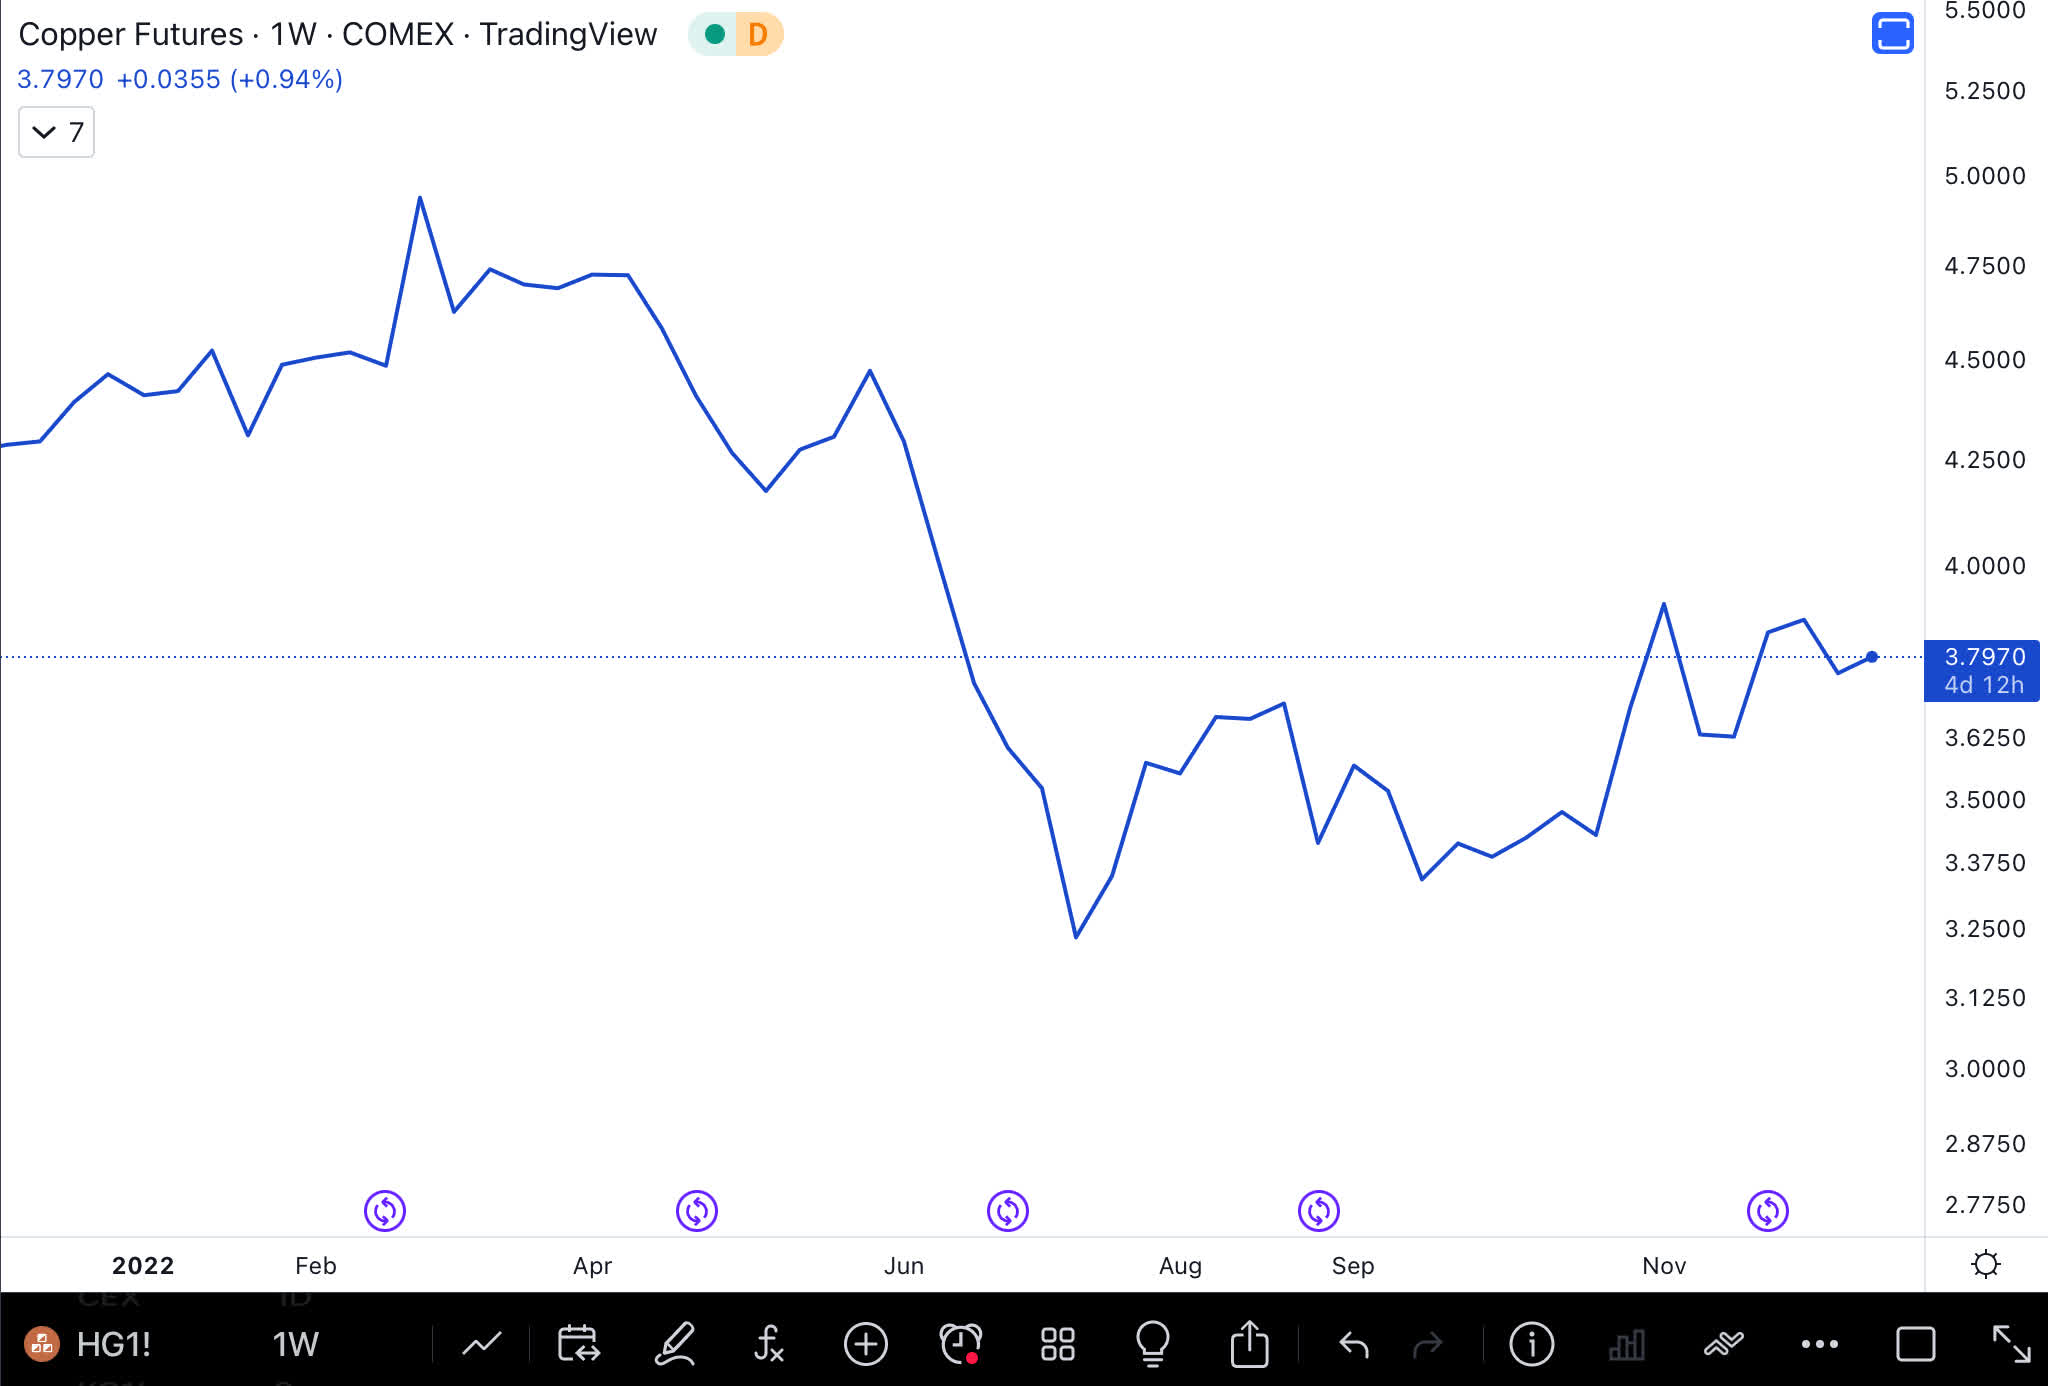
Lumber futures started dropping off before the slow down in housing demand.
Lumber Chart (Author ) Silver Chart (Author )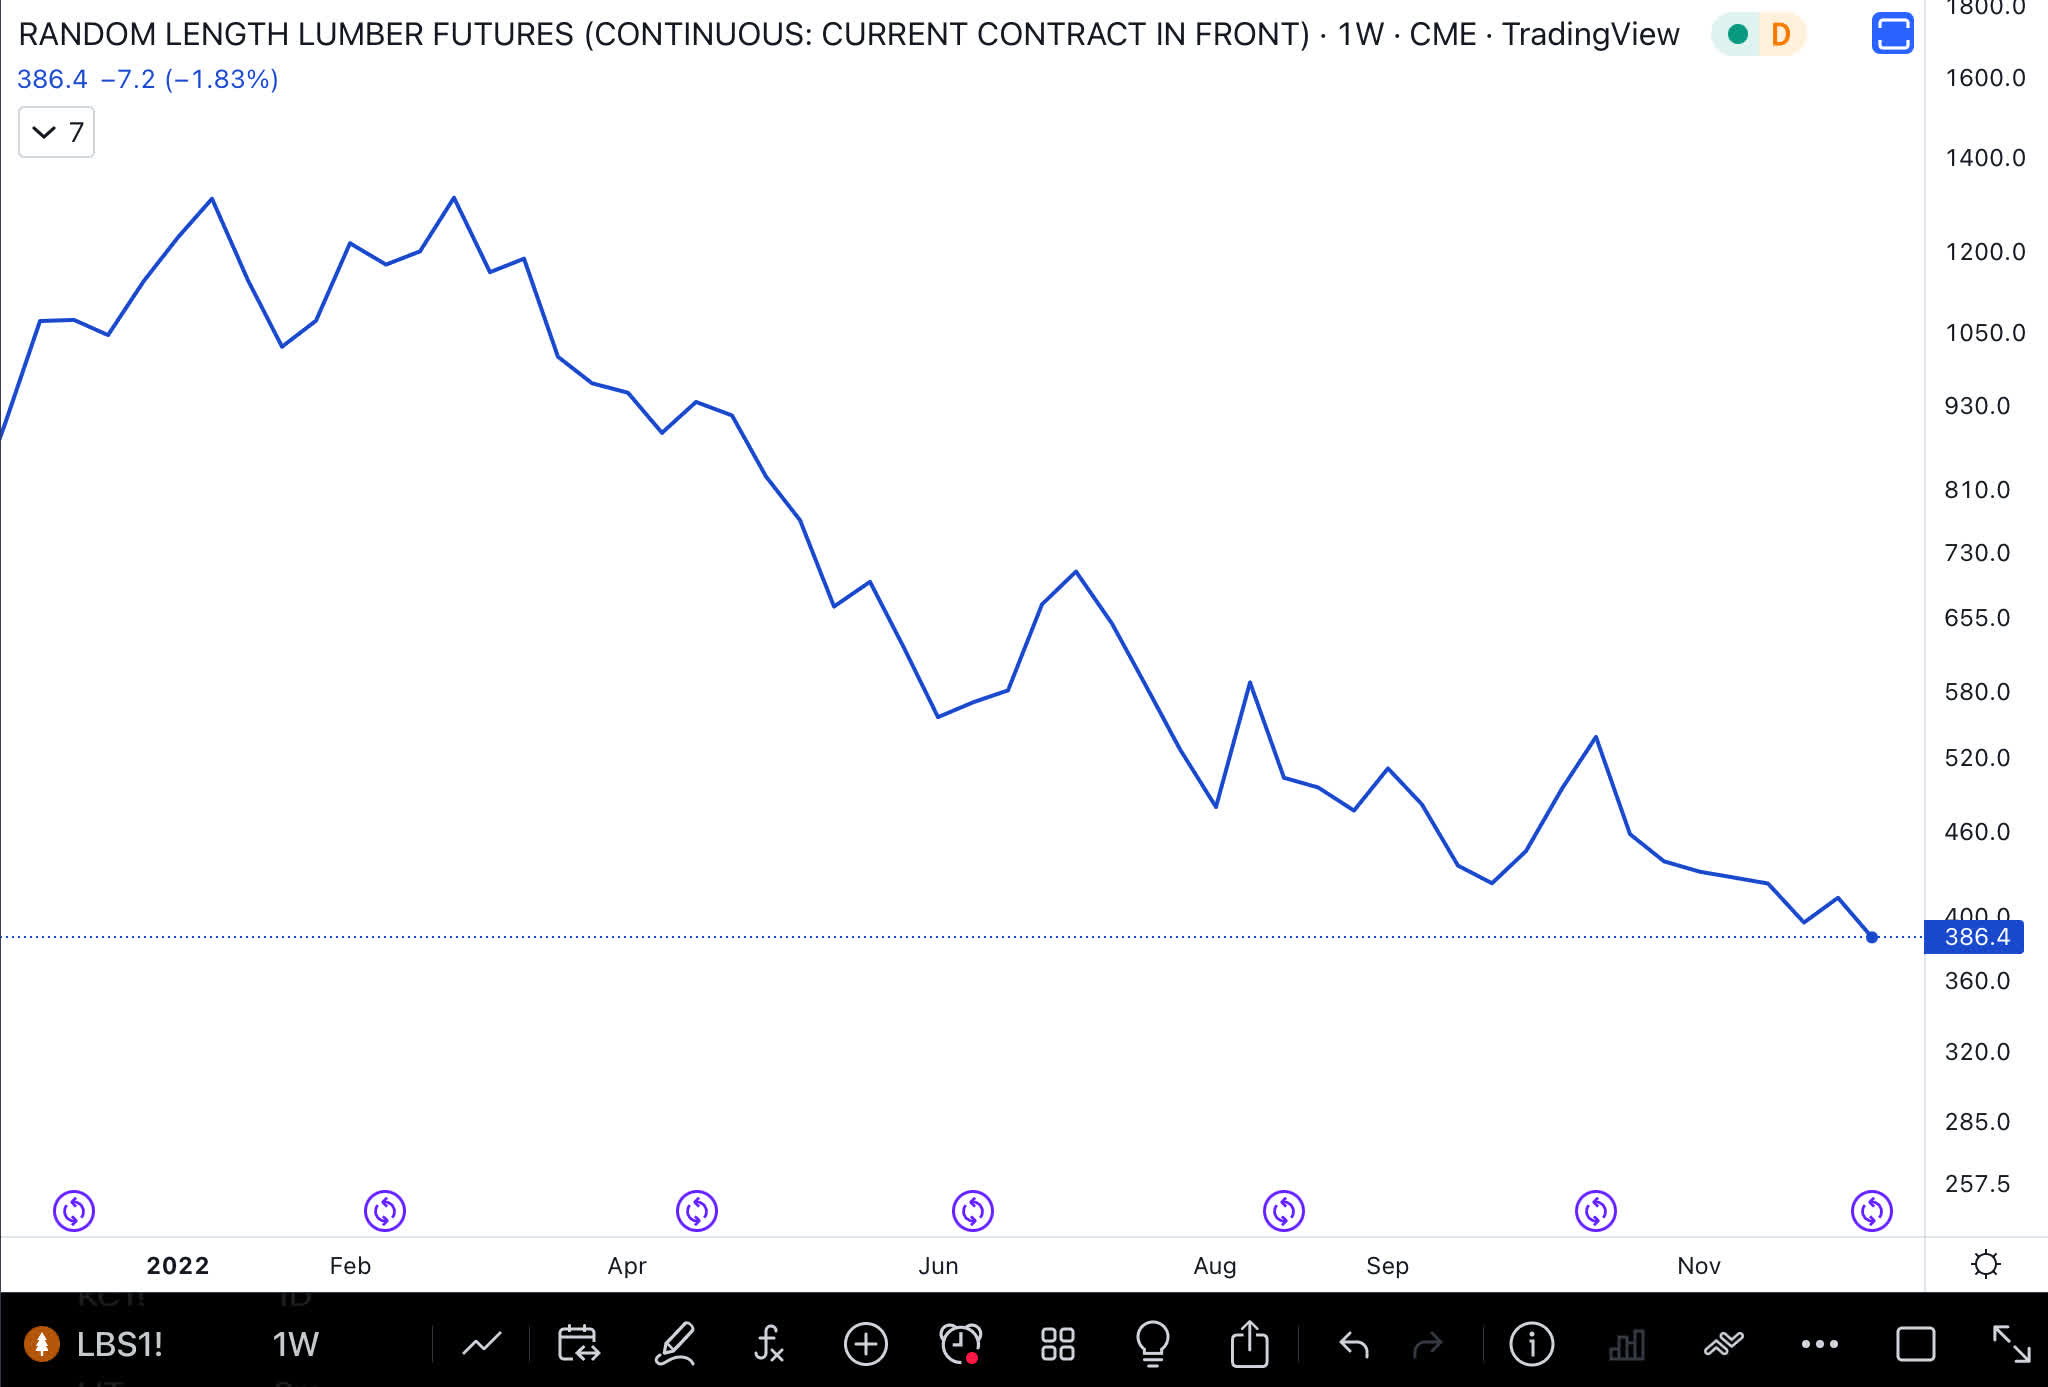
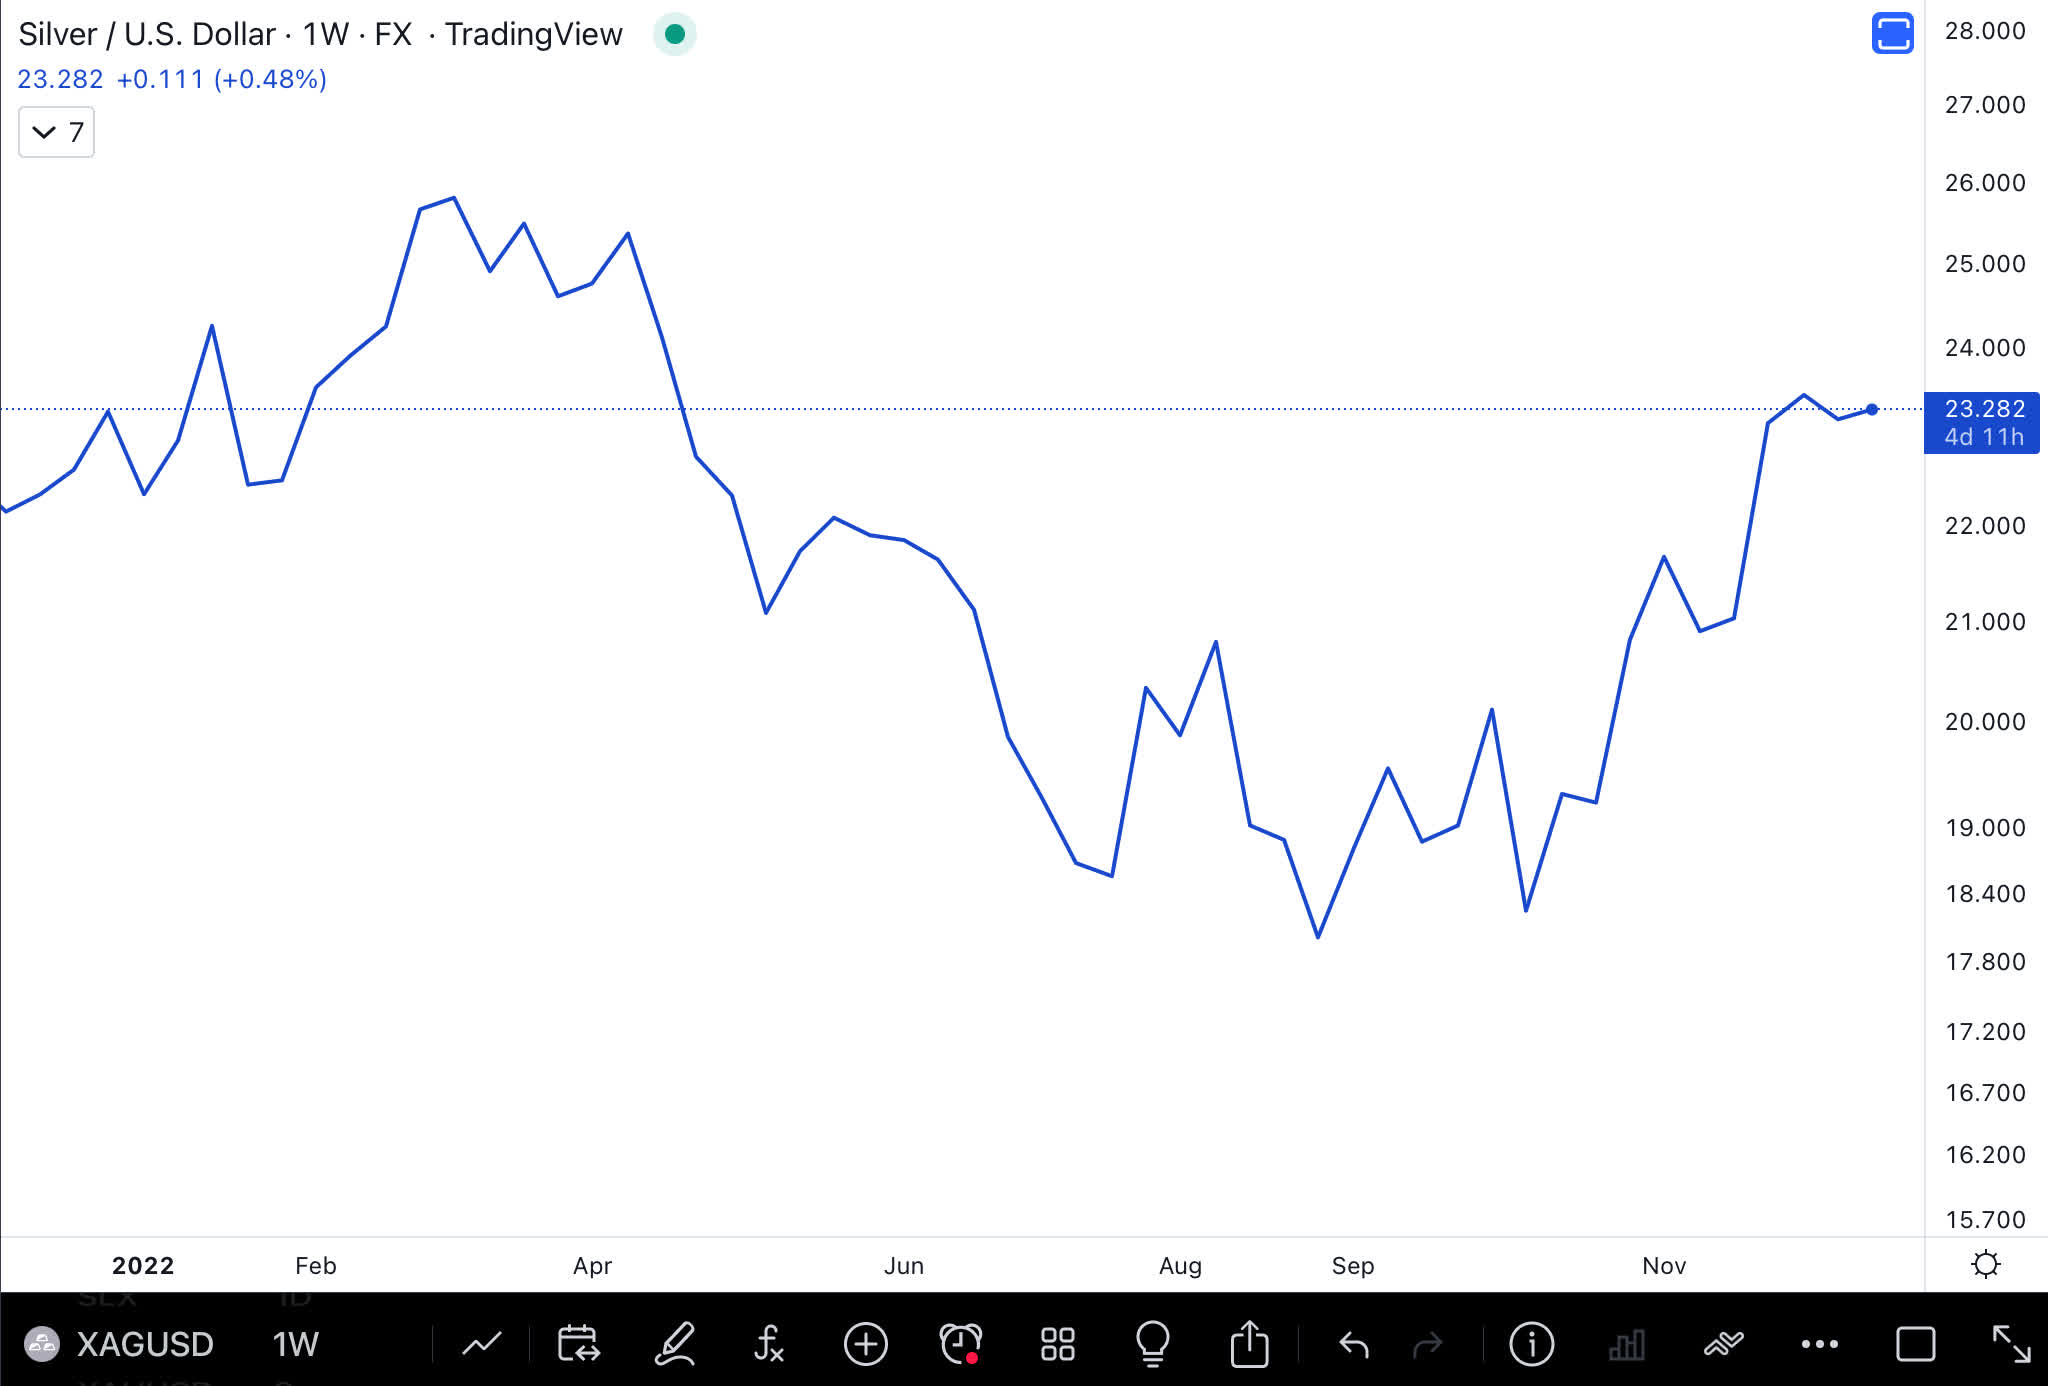
Silver futures in the chart above are about where they were a year ago.
Wheat futures dropped off after a sharp increase in early spring, and prices are now about where they were a year ago.
Wheat Chart (Author )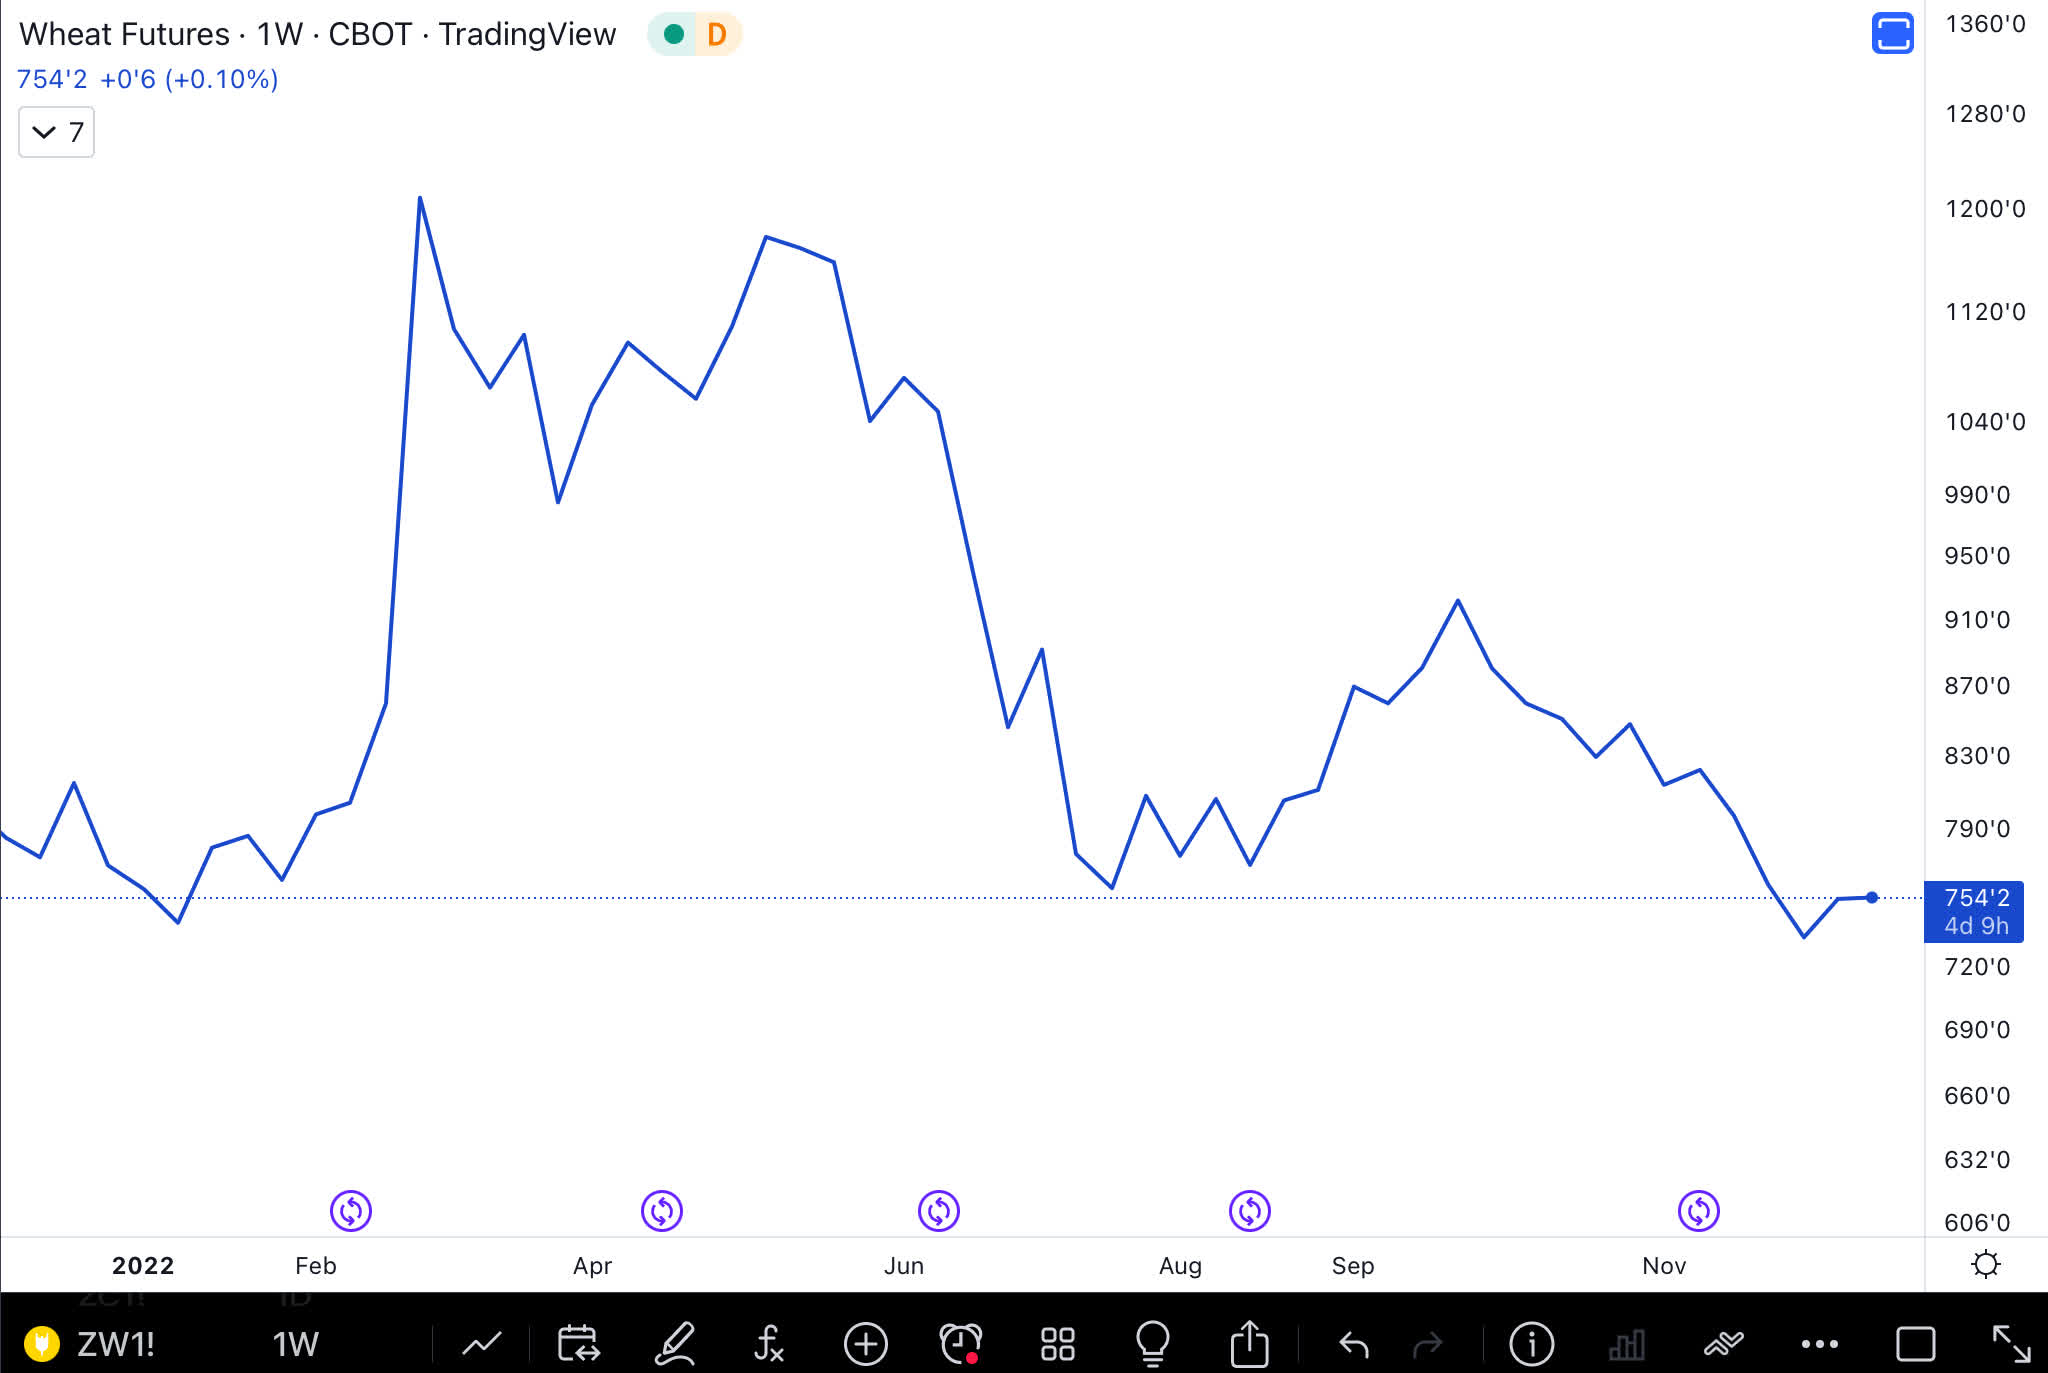
Corn prices are also about where they were a year ago.
Corn Chart (Author )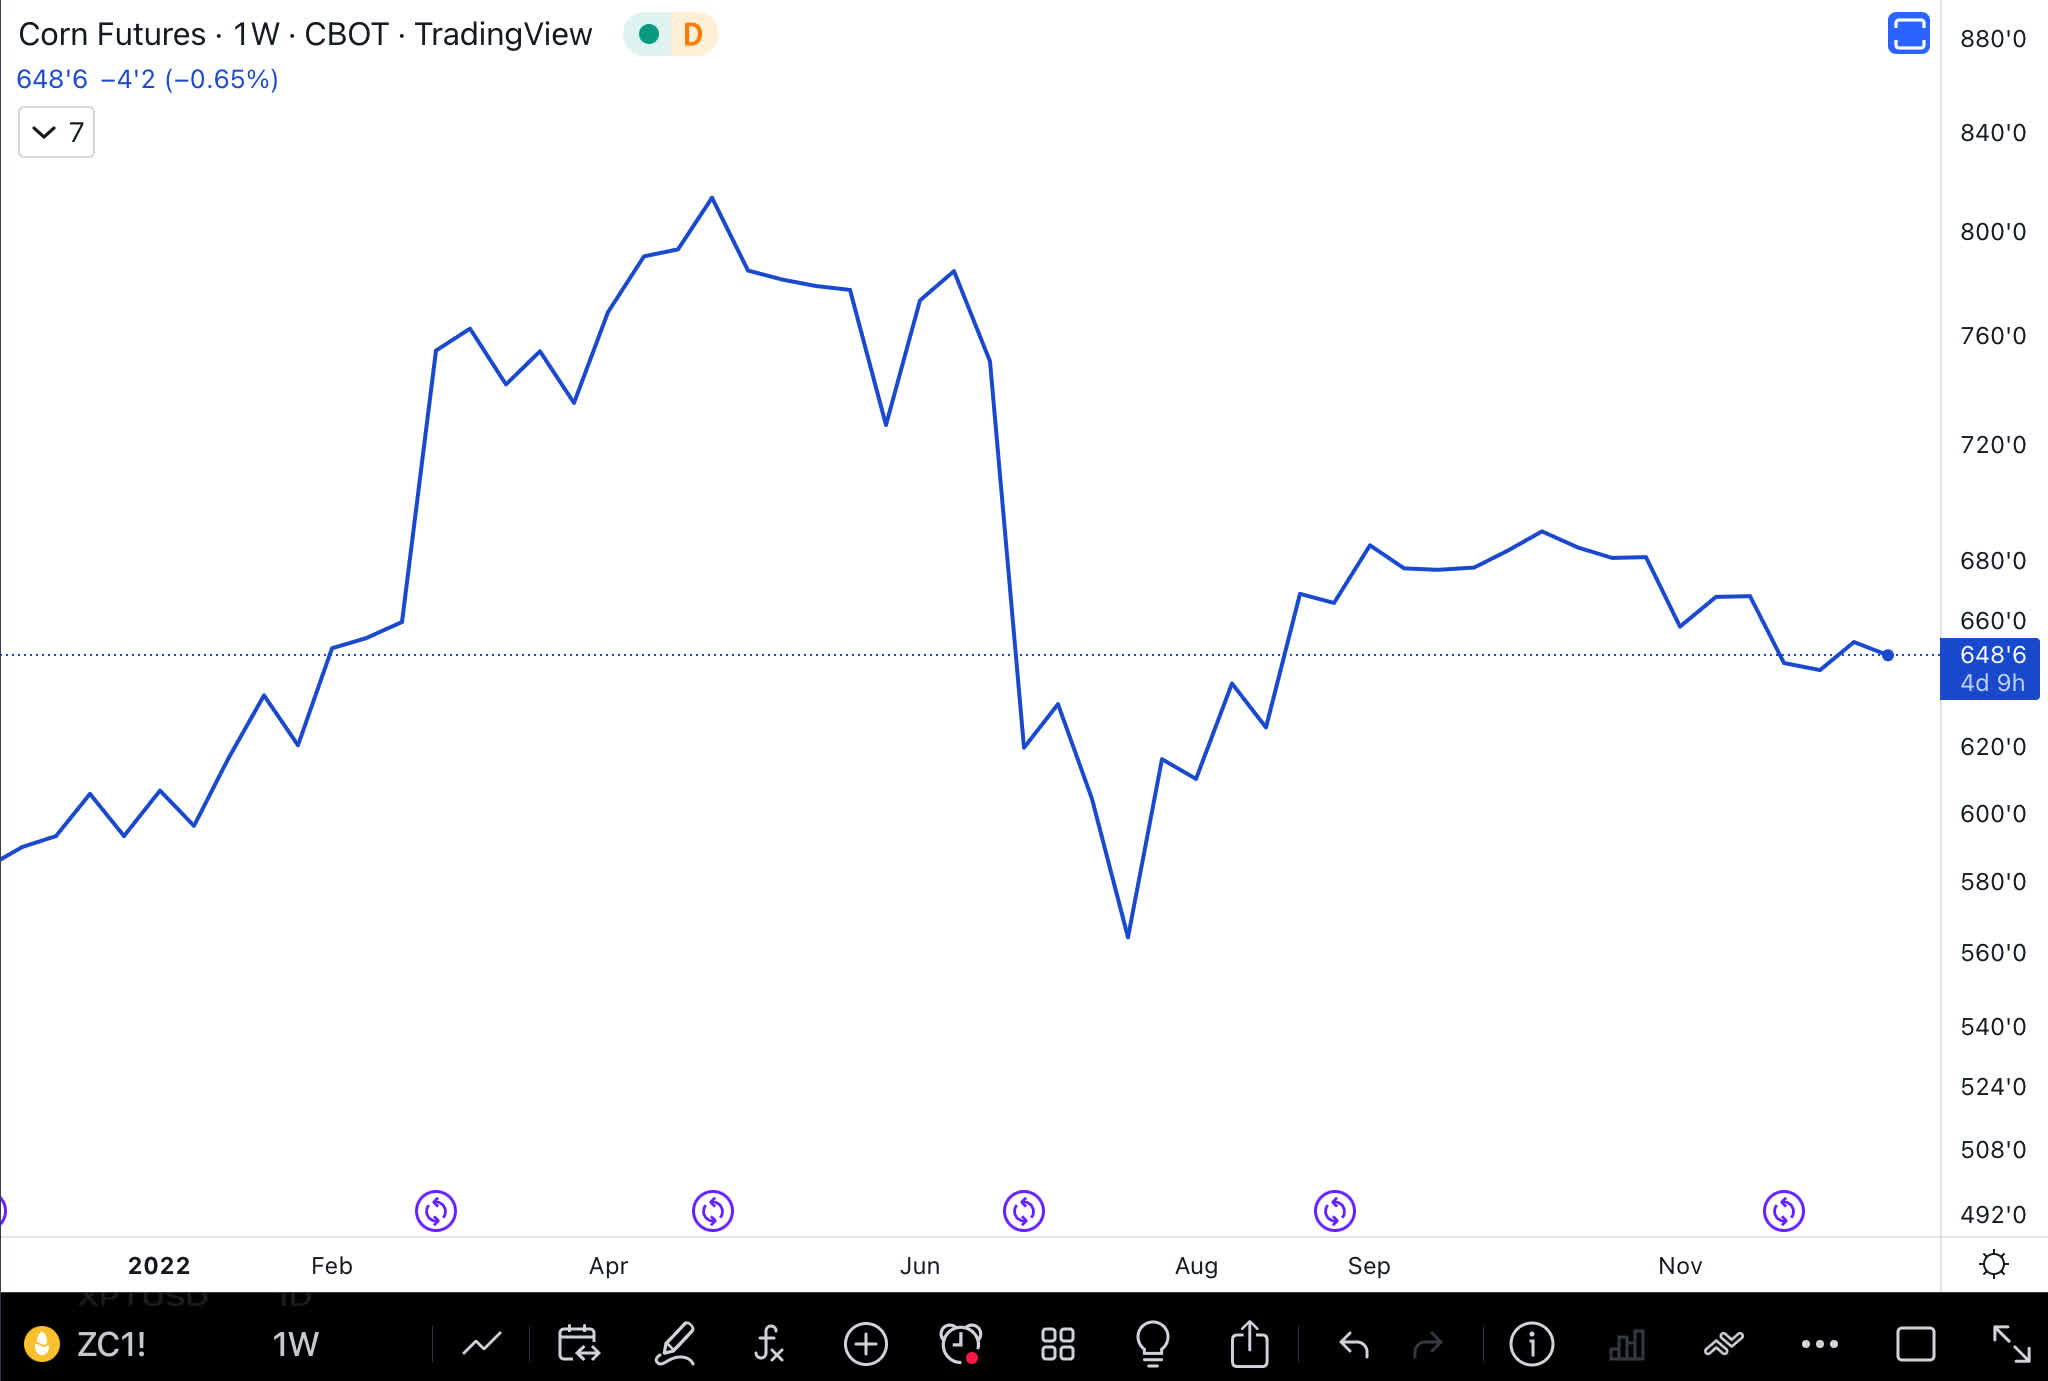
PMI Services and Manufacturing
The Federal Reserve is raising rates to slow the economy, and it is working. The Services PMI has been dropping since fall 2021, but above the 50% level.
PMI Services (ISM)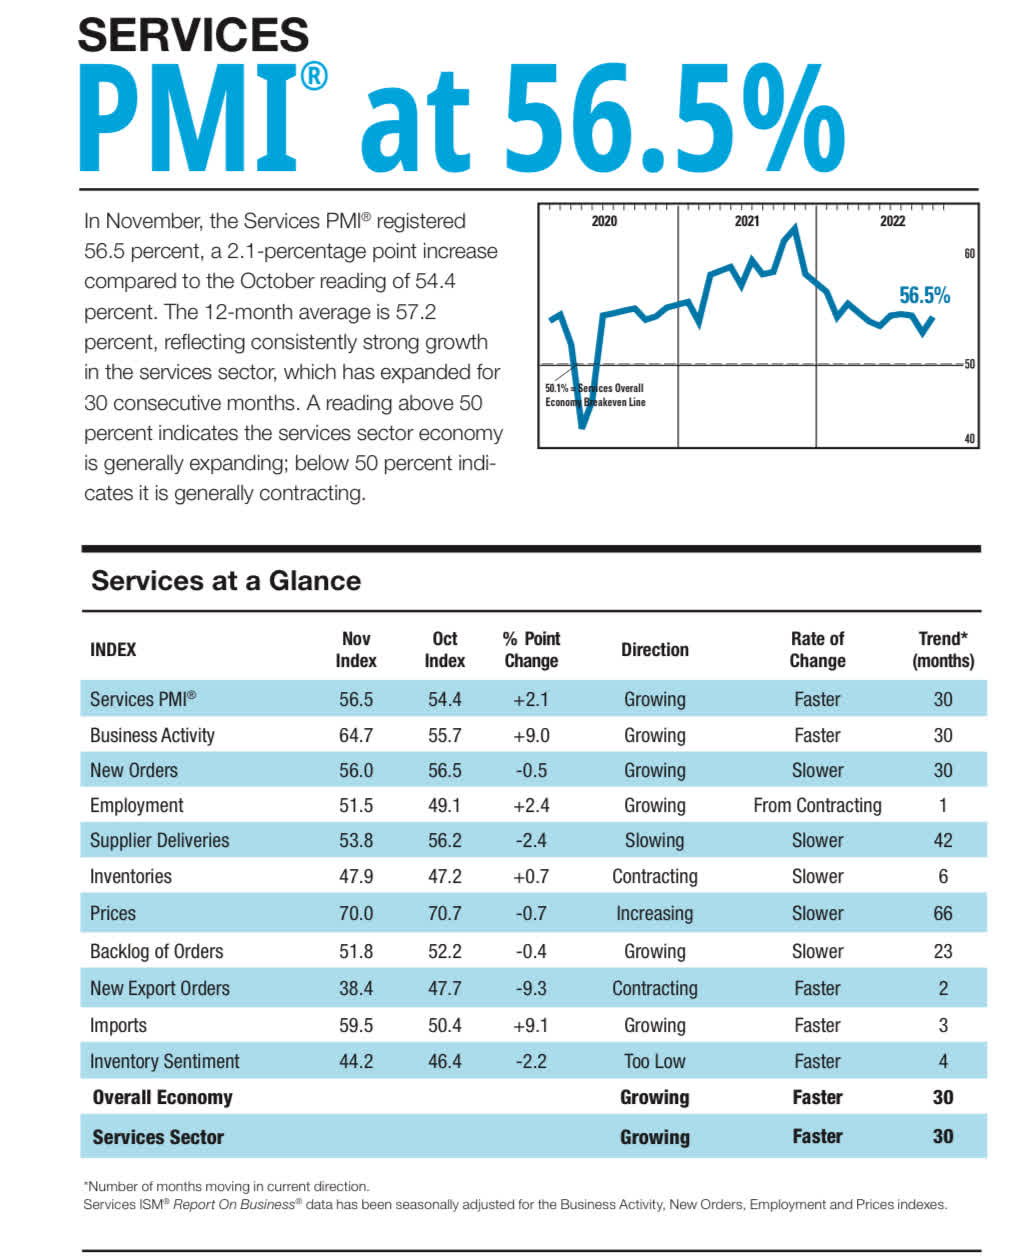
Manufacturing PMI is now in contraction, as it has dropped below 50%.
PMI Manufacturing (ISM)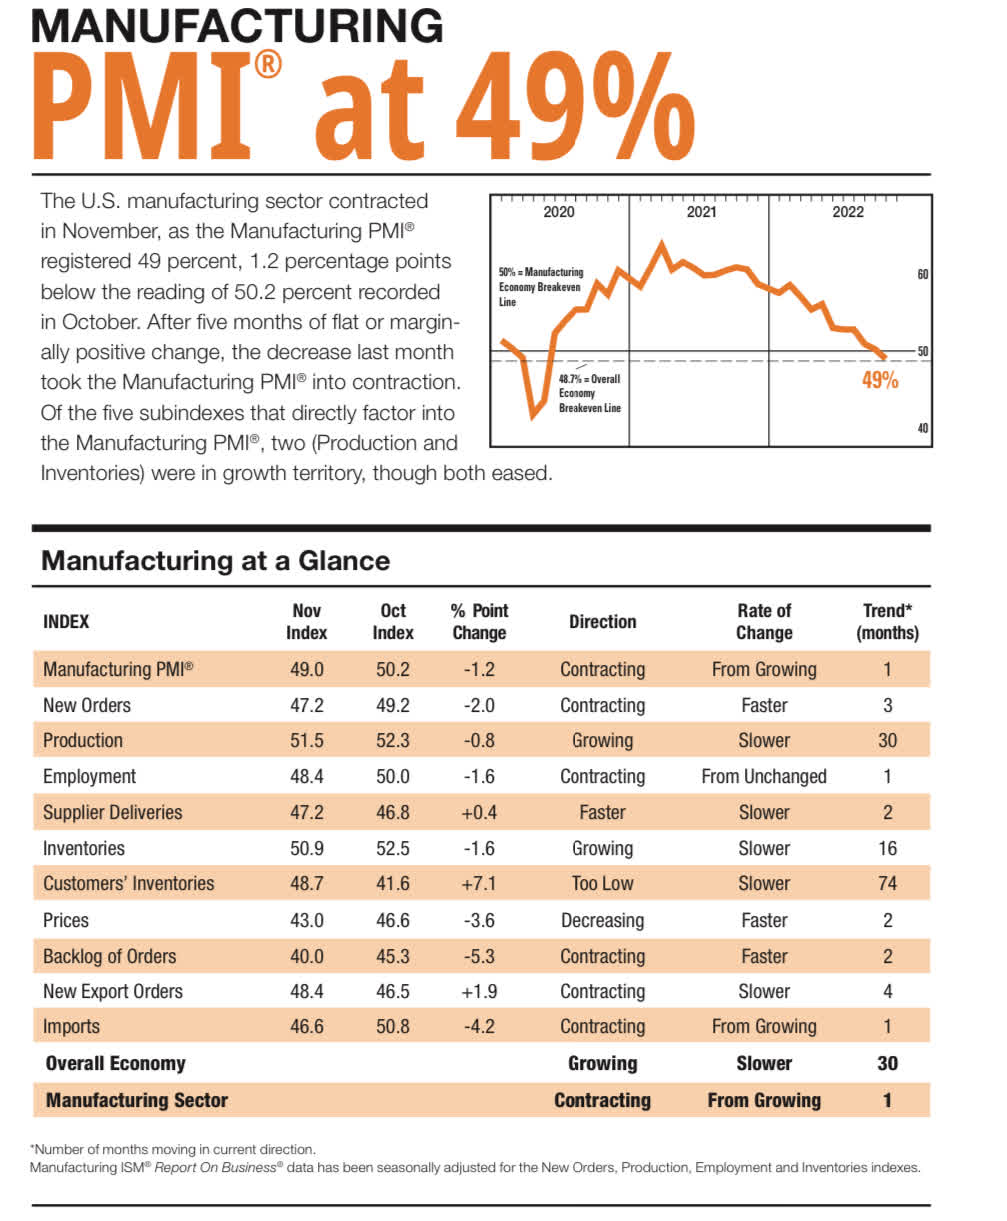
Price Component
Services price components peaked in Spring 2022 and has steadily dropped.
PMI Prices Services (ISM)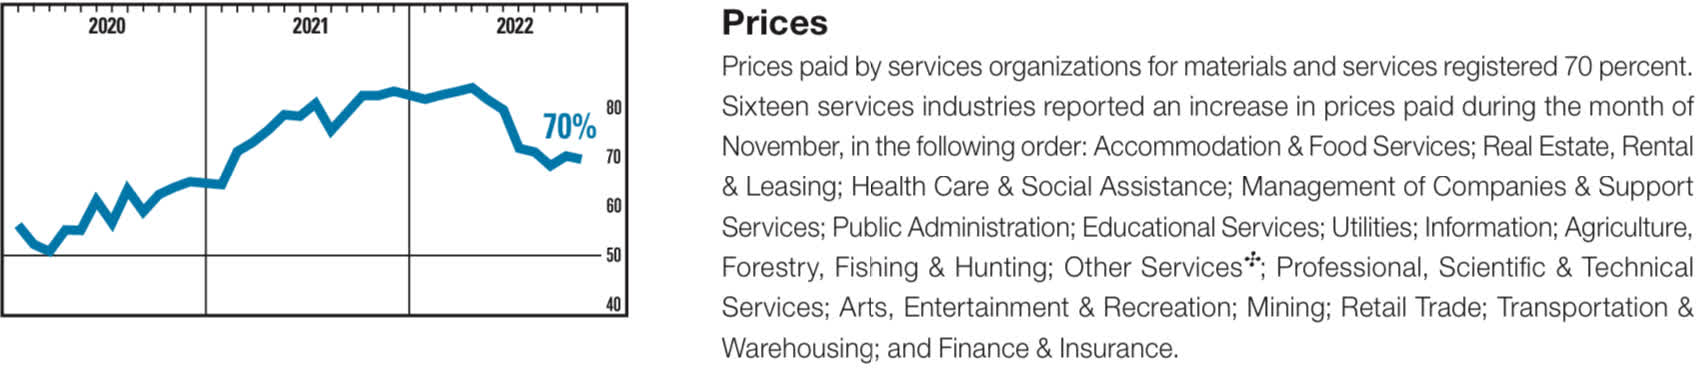
Manufacturing price components are near Covid 2020 lows and have experienced a sharp drop since Spring 2022.
PMI Prices Manufacturing (ISM)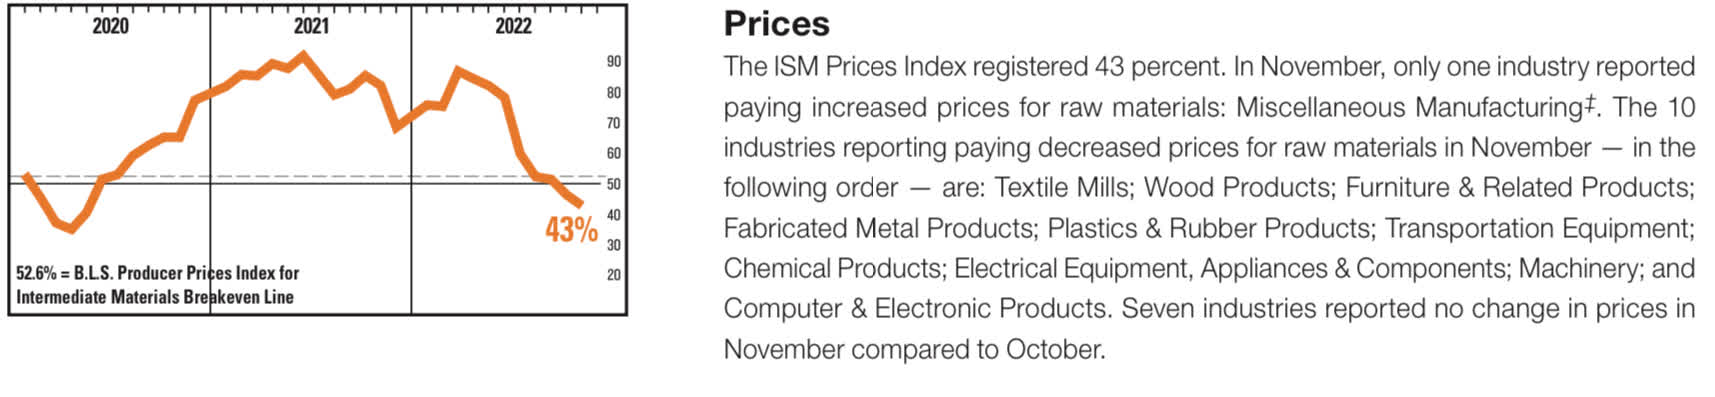
Consumer Price Index
The CPI for the last 5 months is 1%, which annualizes to around 2.5%. While there will be volatility in the numbers, there is no denying the fact that inflation has dropped off. The key question is whether inflation can remain low in 2023, as it has for the previous five months.
CPI MOM (Trading Economics)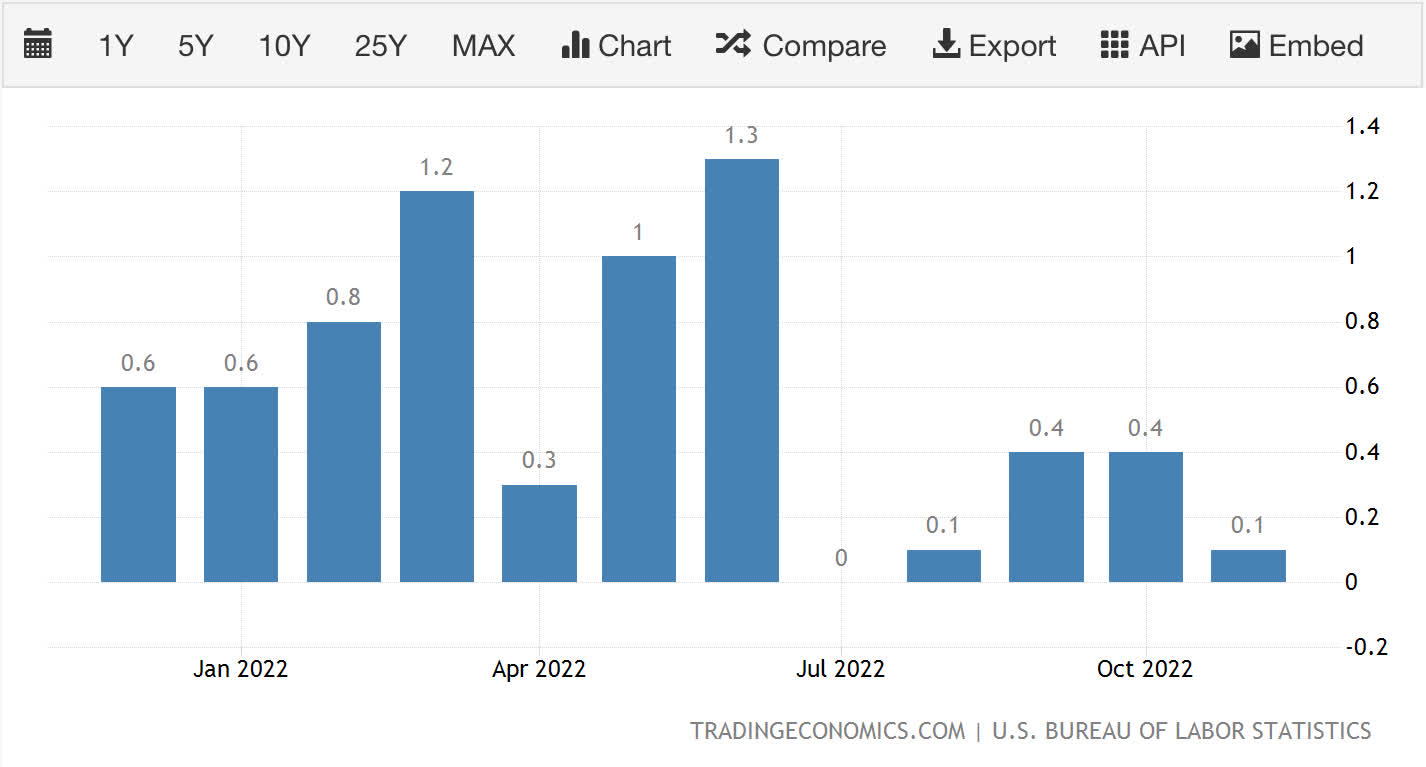
U.S. Dollar Index
The U.S. Dollar Index has declined, but until it goes down and stays below 100, there is a distinct possibility that it could continue higher.
U.S. 10 year (Author )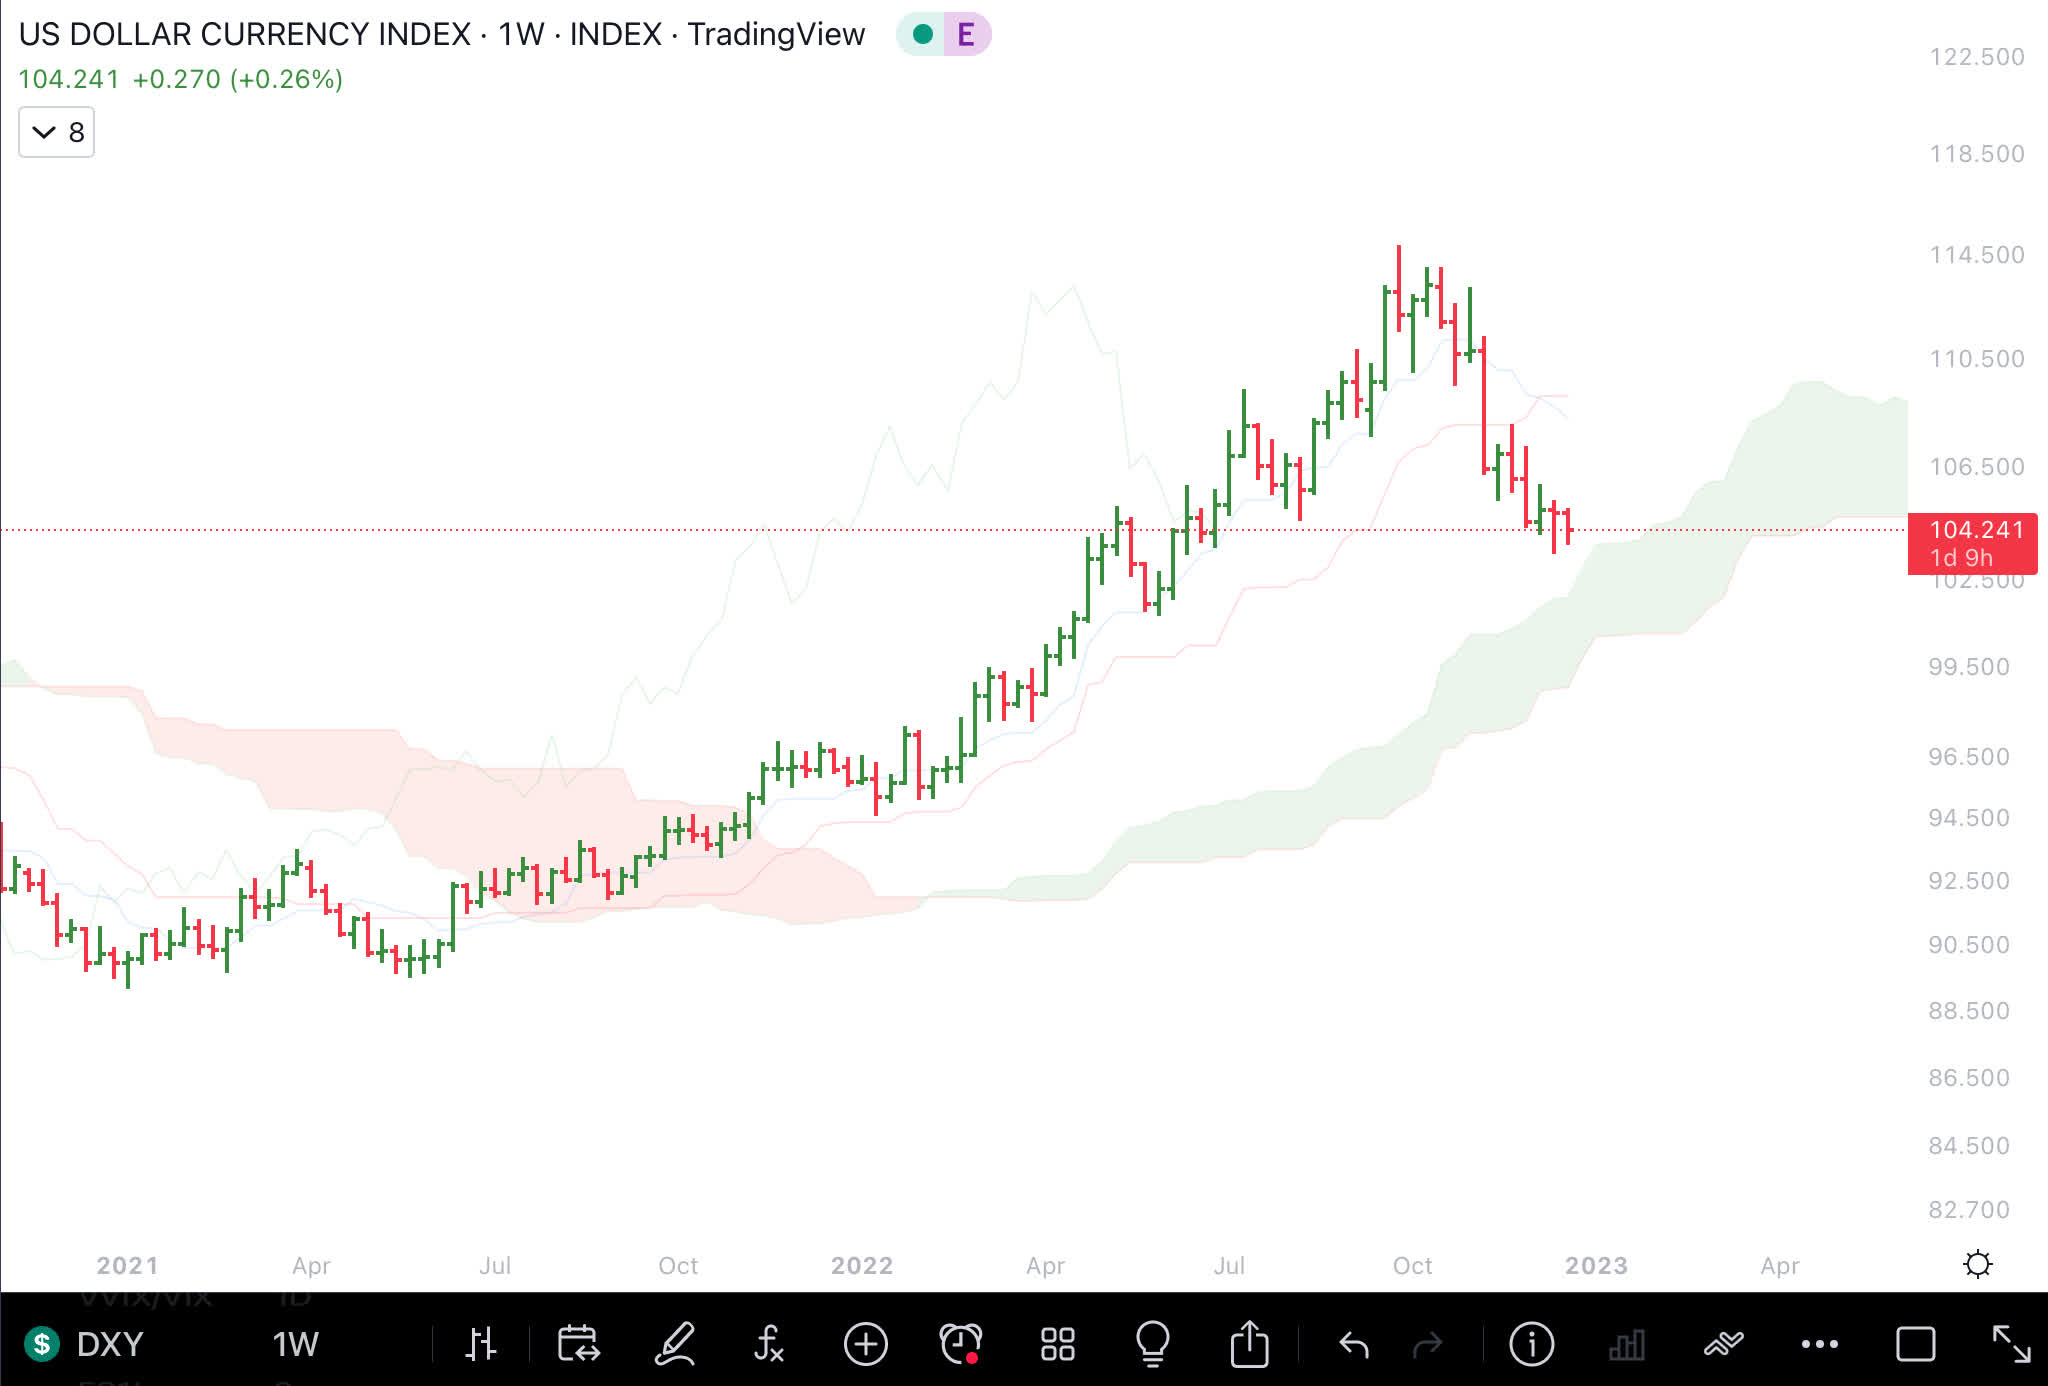
Unemployment Rate
The Unemployment rate continues to stay low due to demand for workers coming out of the Covid lockdown and aging demographics.
Unemployment Rate (St Louis Federal Reserve)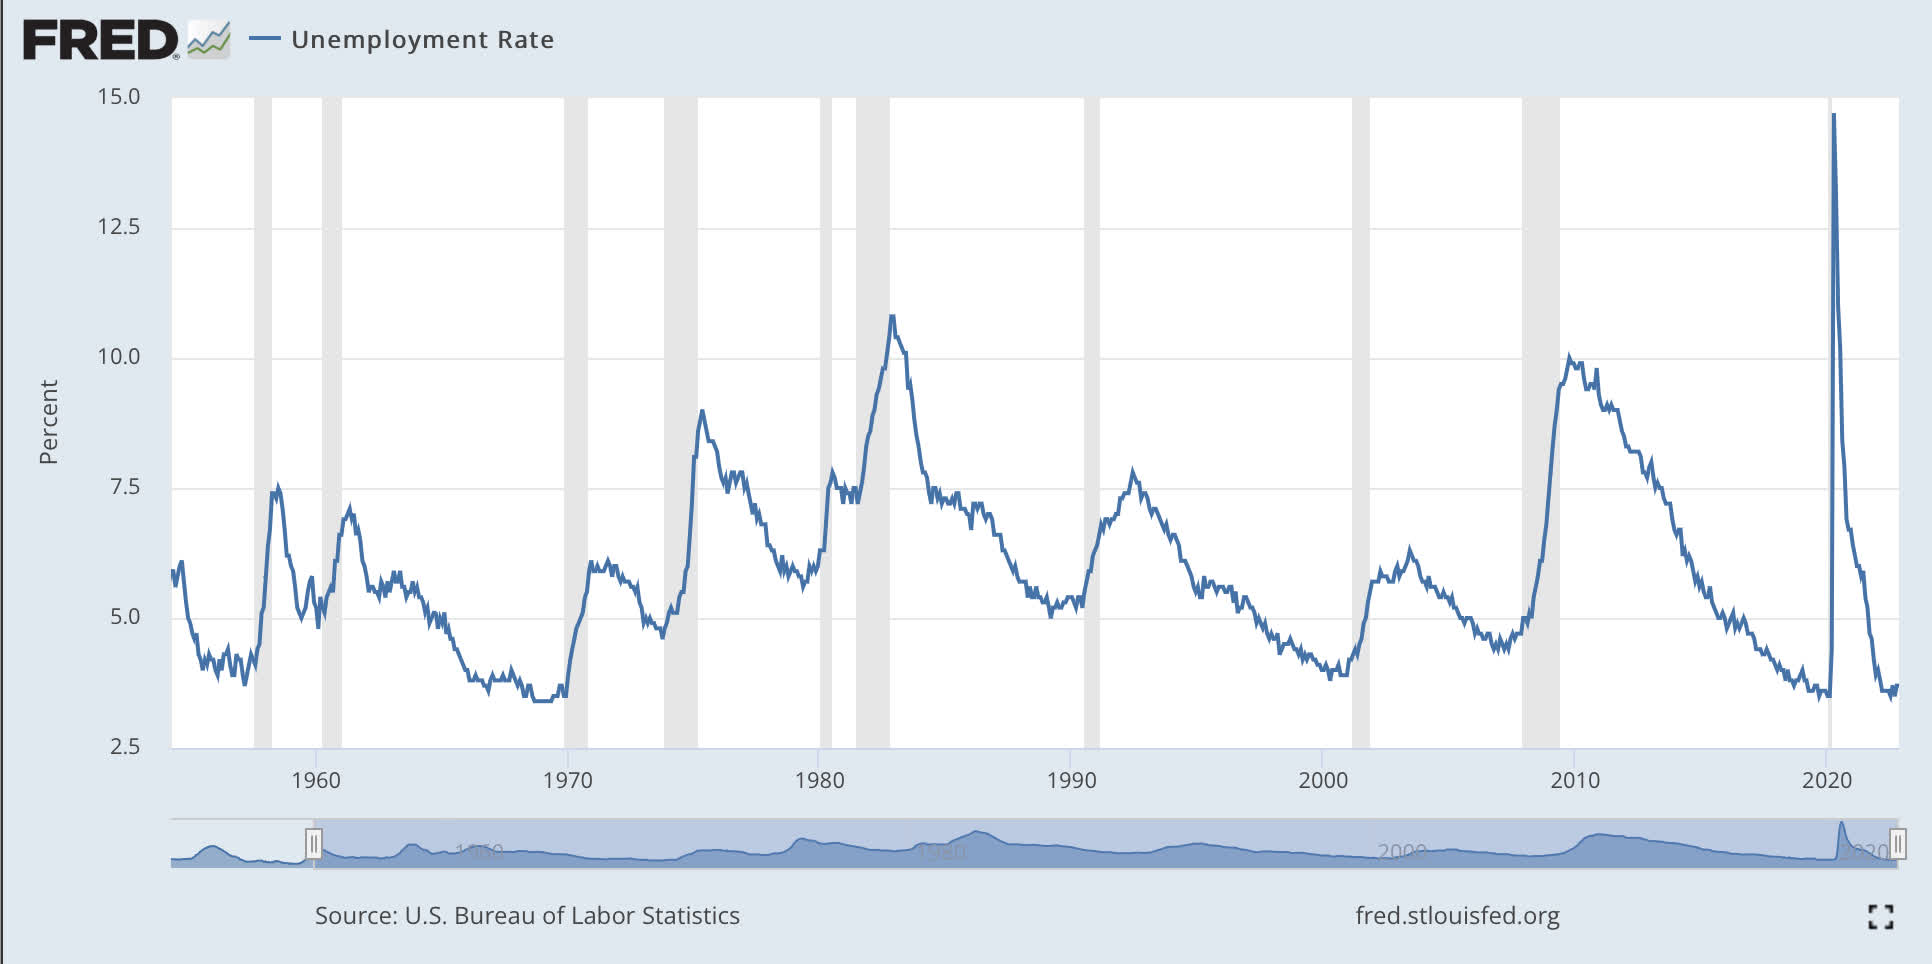
U-6 chart of U.S. unemployment.
U6 Unemployment Rate (St Louis Federal Reserve)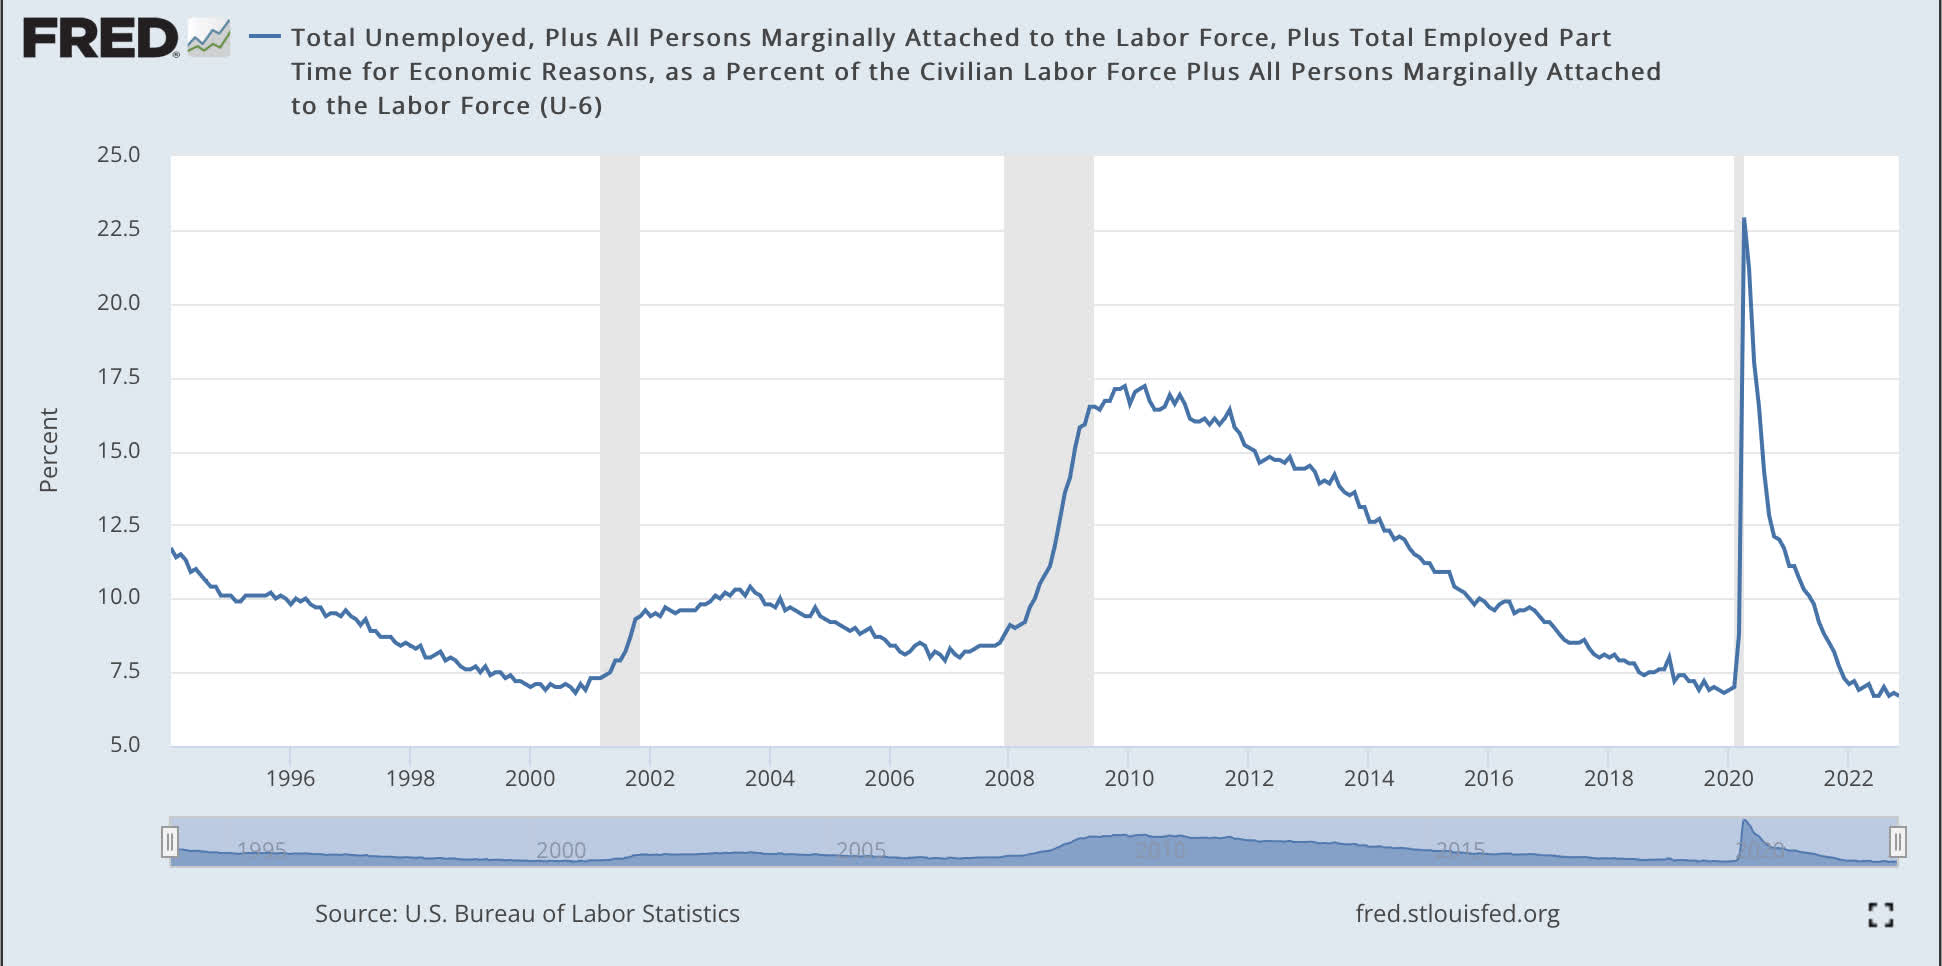
Conclusion
“Don’t fight the Fed,” as higher interest rates have an impact on economic growth and the valuation of companies. No one knows how long the stock market is going to continue to go down or whether a change in the calendar will meaningfully change the direction of the stock market.
While the news, as it is known to investors, is already factored into the stock market, equities could remain in a downtrend longer than most investors can remain patient. As long as there are no new surprises, the S&P 500 Index is in a bottoming phase, but tests of the lows or new lows are a realistic possibility. Based on how the future unfolds, there are stocks that have meaningfully come down to levels that make this a great time to own stocks with quality earnings if one has a long-term time horizon. Let me know what piece of the puzzle I might be missing that should be analyzed or incorporated to better understand the future direction of the stock market.
Be the first to comment