

Victollio/iStock Editorial via Getty Images
To preface this article, I want to explain I have never owned Facebook/Meta Platforms (NASDAQ:FB) over the years. I am not a huge fan of social media, as I believe there are just as many downsides as upsides for society in general. Another knock against the stock is valuations have been extremely rich on trailing results since its May 2012 IPO at $38 per share, moving into 2021.
However, a few readers have asked me to outline a buy thesis after its 50% stock price collapse from an all-time high above $380 in September to under $190 in March 2022. If you can get past its reduced growth setup as government regulations are sure to heat up in coming years, and its “advertising” business model may suffer from a potential consumer spending recession in 2022-23 (nearly all retailers have been sold off early this year with rising inflation and interest rates hurting discretionary income), Facebook actually looks quite cheap on the valuation front today.
Reviewing trailing 12-month metrics of the share price to trailing earnings, sales, cash flow, and tangible book value, Meta Platforms has never been at such a bargain valuation (on a combination of the four basic fundamental ratios). In fact, I would now tag FB as the least expensive “Big Tech” name upfront, available for investment in April 2022.
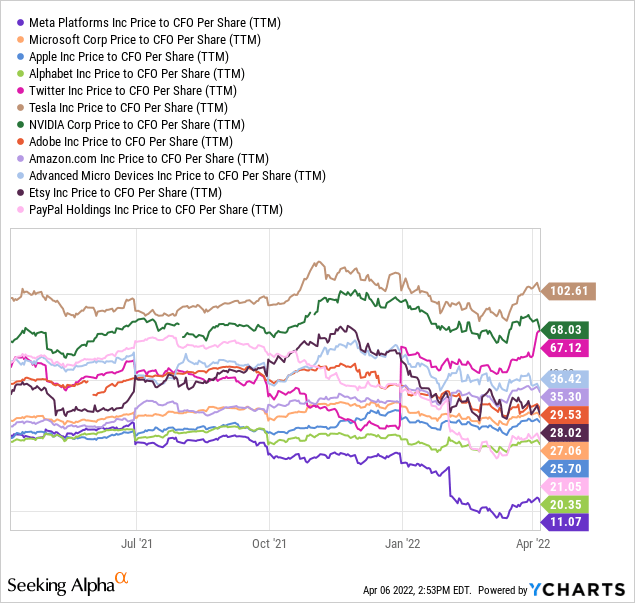
FB Since 2012 IPO (YCharts) YCharts Price to Cash Flow – Big Tech Peers 2021-22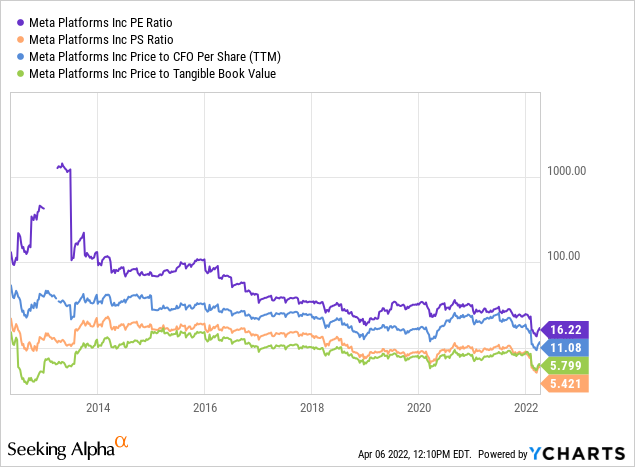
In addition, Meta’s long-term growth outlook is still far better than the average S&P 500 blue chip, assuming Uncle Sam doesn’t break up the company, install massive new oversight and regulations on the business, or raise corporate tax rates through the roof. Below are the current analyst consensus EPS and revenue estimates for FY 2022-24.
Seeking Alpha Earnings Estimate Table – April 6th, 2022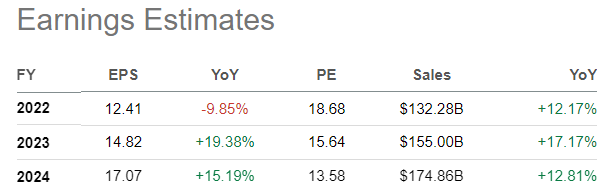
So, if you believe in the future of Facebook/Instagram and want to commit capital (the Metaverse thing is still a pipe dream in my estimation), at what price should you get serious about pulling the trigger? My answer is a chart retest of the multi-year low price level of March makes sense and is statistically the most likely outcome.
Technical Retest of Crash Low Next?
Using 35+ years of trading experience and chart reading, the next logical near-term move could be back to the $205-$215 price zone. Spiking interest rates in the U.S. and fears of such have already taken a decent chunk out of its price over the last several trading days. The worst-case price scenarios for Big Tech revolve around tightening monetary conditions by the Federal Reserve and rising “low-risk” yields from Treasury and corporate bonds competing for your investment dollar.
Usually, when a stock is pummeled like the Meta thrashing over six months, a slight rebound toward its 50-day moving average is eventually followed by a final and successful retest of the ultimate low price. If March’s $186 proves the final price bottom, I project one last lower-volume decline in price is about to take place, which stays above the 52-week low mark. Sometimes, you can get a new 52-week low price on weaker volume as a “retest” pattern. Nevertheless, my view is enough pessimism/bearishness/confusion in sentiment exists from retail investors that today’s backdrop means we are closer to a real reversal higher in price. The strong fundamental valuation argument may also bring in institutional/hedge fund buyers sooner rather than later.
In a nutshell, I am forecasting a price drop back to $205-215 soon, which may open a smarter risk-reward buy entry, at least from a chart reading angle. I have drawn the optimal buy area below, boxed in green, where I expect FB to start outperforming the S&P 500 and NASDAQ 100 indexes. While I cannot guarantee this will be the final price bottom if a bear market continues on Wall Street for the rest of the year, I am confident the stock will begin to act much better vs. peers in percentage terms.
18-Month Daily Chart (Author Buy Zone Reference – StockCharts.com)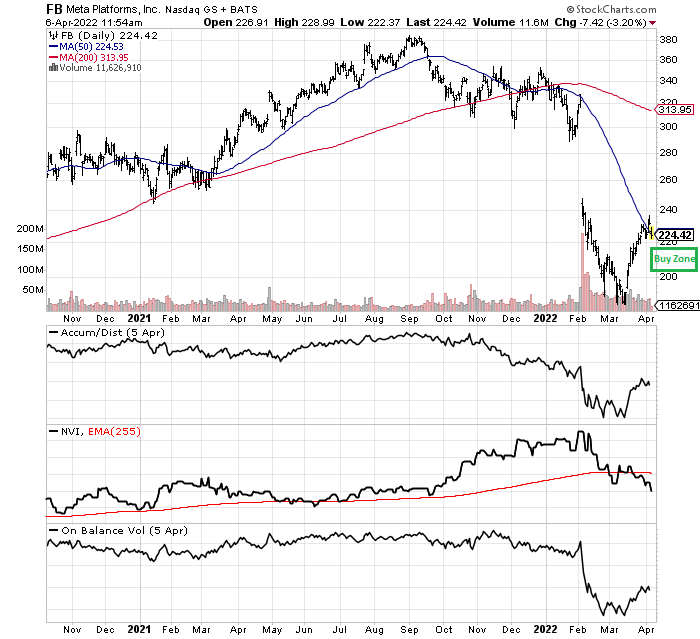
The momentum indicators I track daily like the above-drawn Accumulation/Distribution Line, Negative Volume Index, and On Balance Volume trends are neutral to bearish currently. Since none of them are moving in a clearly bullish direction yet, forecasting another minor leg lower in price seems quite reasonable.
You can see on the Point & Figure chart for FB below, incredible damage has been done to price over the last six months, with a slightly higher high price at $236 reversing into a downtrend this week.
1-Year Point & Figure Chart (Author Buy Zone Reference – StockCharts.com)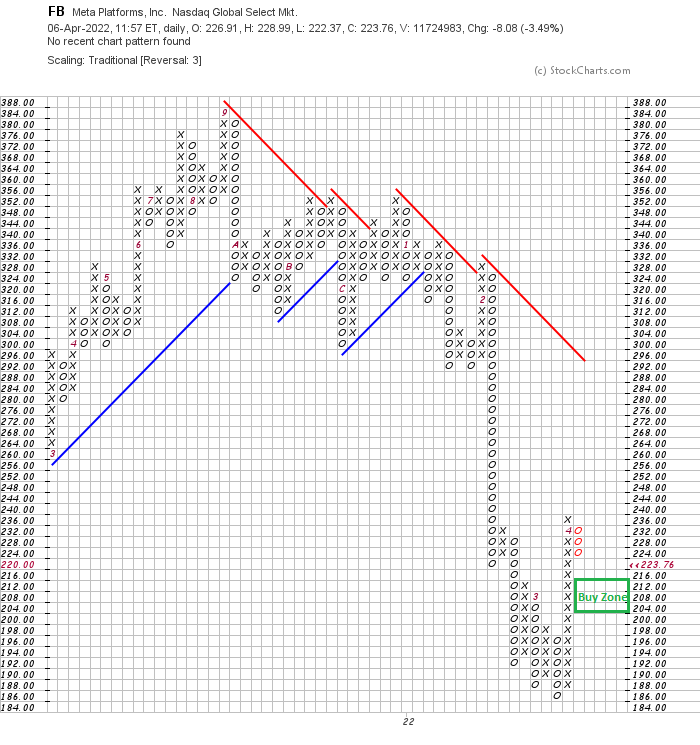
Lastly, to better visualize the major overhead share resistance around $240-250, we can review an EquiVolume graph that resizes price bars based on the volume traded. With tons of trading action around this level, it may prove difficult for FB to rise above $250 over the next 3-6 months. If the upside is limited over the next several months, investors should remain cautious about overpaying for Meta as the odds favor more downside first.
1-Year EquiVolume Chart (Author Buy Zone Reference – StockCharts.com)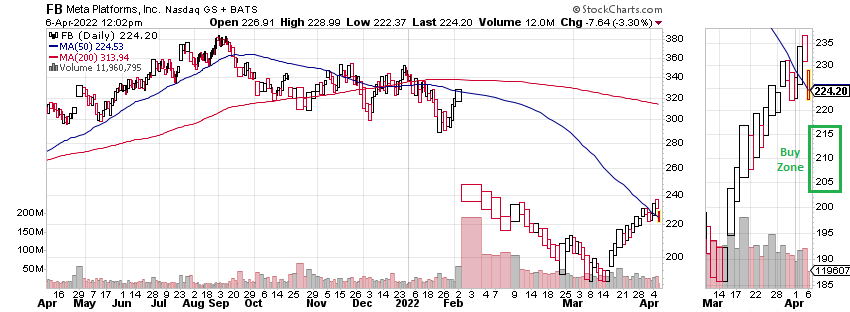
Final Thoughts
Despite the largest percentage price decline in FB since its first year of trading, Seeking Alpha’s Quant Ranking is still relatively positive vs. peers. A combination of better trading action over the last four weeks and still positive trends in the operating business have generated a computer-derived score in the top 30% of Internet Media names and top 45% vs. its all-inclusive list of 4000+ alternative equity investments.
Seeking Alpha FB Quant Ranking – April 6th, 2022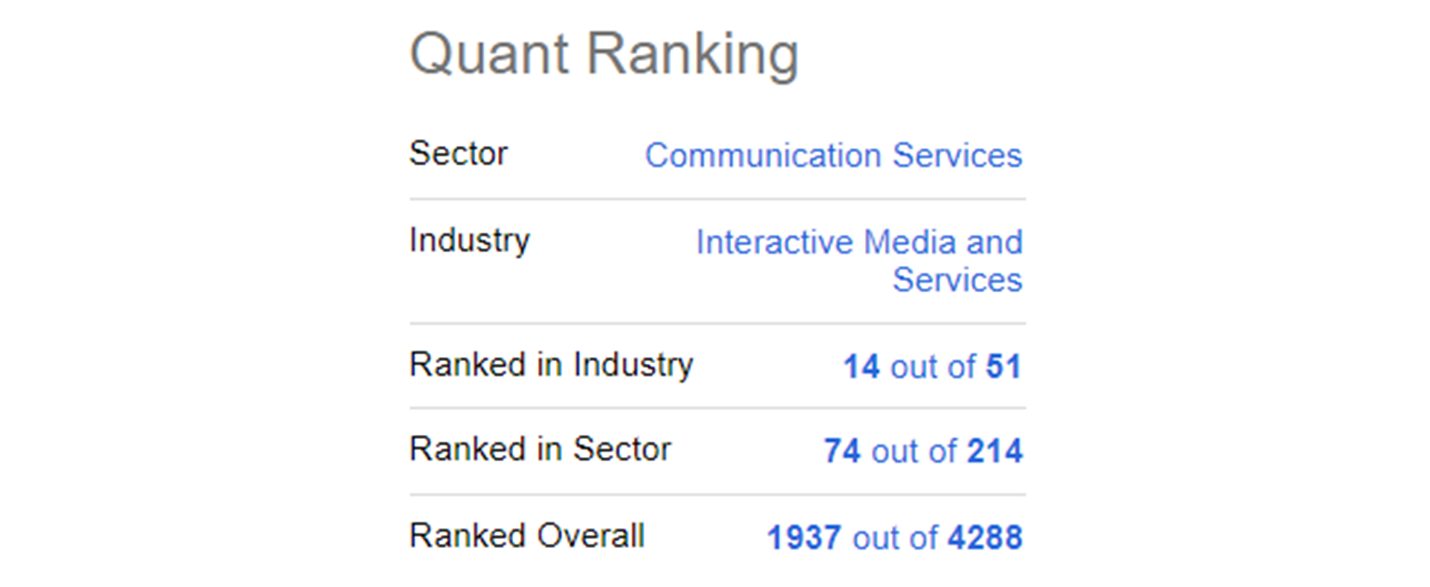
In the end, patient long-term investors in Meta Platforms buying between $205 and $215 may be handsomely rewarded a year or two down the road. If you can keep your expectations low for the rest of 2022, and control your buying enthusiasm with limited buy orders at slightly lower levels than today’s quote, FB may be a worthwhile target to consider acquiring in April-May.
I might even purchase a stake for the first time. With all the technical cross currents, pros and cons of the business model to contemplate, and a number of unknowns regarding government regulation and intervention over the intermediate term, Meta Platforms is far from a slam-dunk bull idea for me personally. I currently rate the stock a Neutral/Hold pick for regular investment portfolios. However, a stronger Buy setup could quickly appear at slightly lower pricing.
Thanks for reading. Please consider this article a first step in your due diligence process. Consulting with a registered and experienced investment advisor is recommended before making any trade.
Be the first to comment