

Stadtratte
Deep Trouble, (but) Deep Value: Despite, or perhaps because of, all the bad news and challenges facing Europe — an interesting development has shown up in European equities…
The combined P/E ratio (average of the forward P/E, trailing P/E, and P/E10 ratios) has dropped to extreme cheap levels. It is more or less on par with levels seen at the bottom of the dot-com bubble burst bear, and the 2020 c***d calamity crash.
That said, it has yet to plumb the absolute lows seen during the global financial crisis and subsequent European sovereign debt echo-crisis.
So therein lies one of the two cautionaries: although cheap, it could get cheaper.
And it should also be acknowledged that the “E” side of the P/E ratio is a moving target: e.g. if earnings were to fall fast it could make European equity valuations seem a bit less cheap than what they appear now.
But practically speaking, rather than acting on valuation alone, we’d rather see a confluence of factors — a full puzzle picture: e.g. cheap valuations + monetary easing + better leading indicators + signs of alleviation of energy/geopolitical issues, and things of that nature.
So while valuations at these levels do more accurately reflect the risks, it may not be cheap enough yet to compensate for all the bad macro (at least in the near-term — further out it could be a good point to start scaling in, which has historically been the case). Something perhaps non-obvious, something most investors would likely rather avoid, and certainly something to ponder and place on the watch-list.
Topdown Charts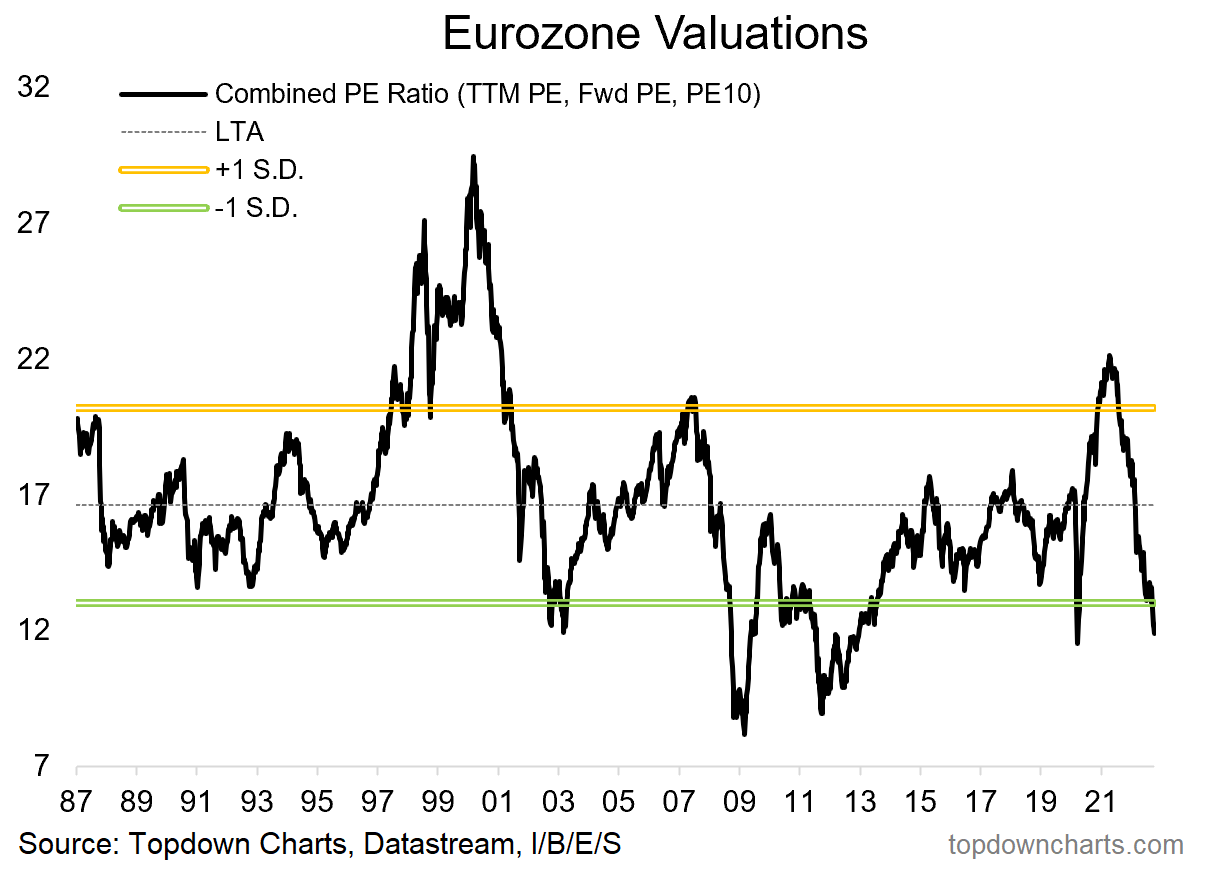
Key point: European equities are showing up as very cheap.
Be the first to comment