

Bet_Noire
Conditional Seasonality Analysis: You’ve probably heard some of the old chestnut market seasonality wisdoms and sayings, for instance: the Santa Claus or year-end rally, “Sell in May”, October effect, etc.
All of these things are generally based on statistical analysis of historical movements in stock prices. And the data certainly seems to show some repeatable and even perhaps reliable seasonal patterns — studies have even been done which confirm the intuition and market aphorisms.
But I got curious.
Does seasonality look the same in different market regimes? Probably a question worth asking given that we are basically in the middle of a bear market.
To answer this question I re-ran the usual seasonality analysis but with a quick and rough proxy for bull vs bear markets (defined here as when the market closed the year up vs down — simple, quantitative, and easy to program (so probably imperfect, but close enough!)).
The results surprised me…
First, what should probably be unsurprising: the bull market seasonality curve trended up across the year (well, that’s what’s supposed to happen in a bull market!!) — and equally, the bear market seasonality curve trended lower across the year (again, this is basically the definition of a bear market!).
Topdown Charts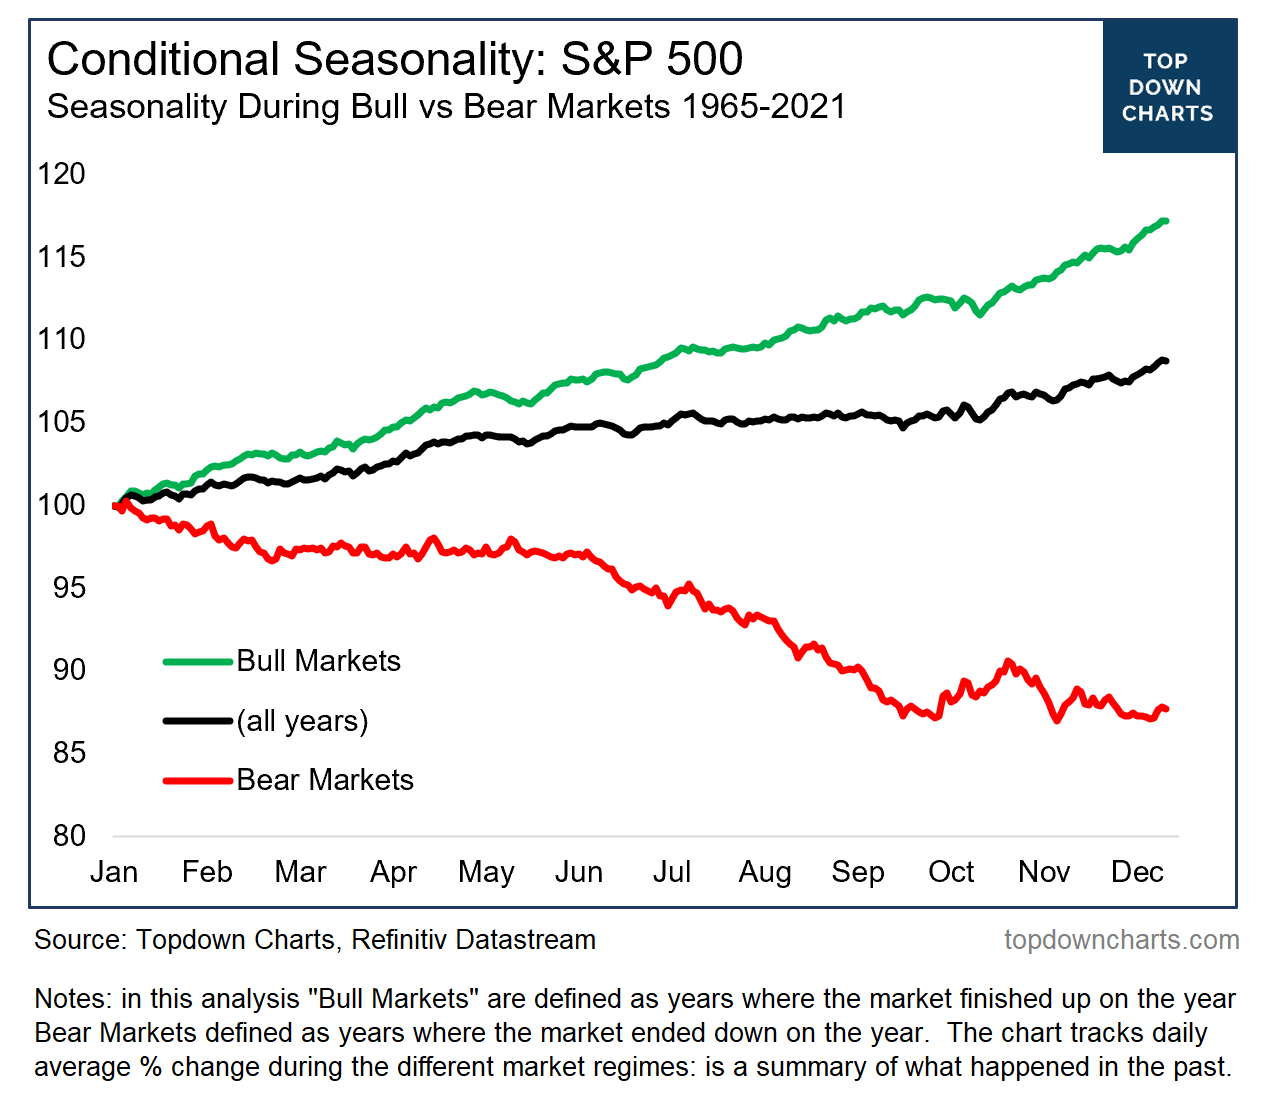
What was surprising though was to see that the old “Sell in May“ effect was simply not present during bull markets, and basically only really a thing during bear markets.
Let me repeat that: “Sell in May“ only works in bear markets.
Albeit, one kind of facetious takeaway is that this analysis basically says: in a bull market – just keep buying, in a bear market – just keep selling (!!!)
Oh, and one more chart… This one shows the same analysis for bear market seasonality, but also including another quantitative rule for deciding whether it was a bear market or not: i.e. “was the market trading below its 200-day moving average?“
Again, this is a rough and imperfect proxy for “bear market” — but it largely echoes the same sort of seasonal pattern that we saw in the original chart. It’s a good check/balance on that method, and again gives an insight into how markets have traded in the past during bear markets.
Topdown Charts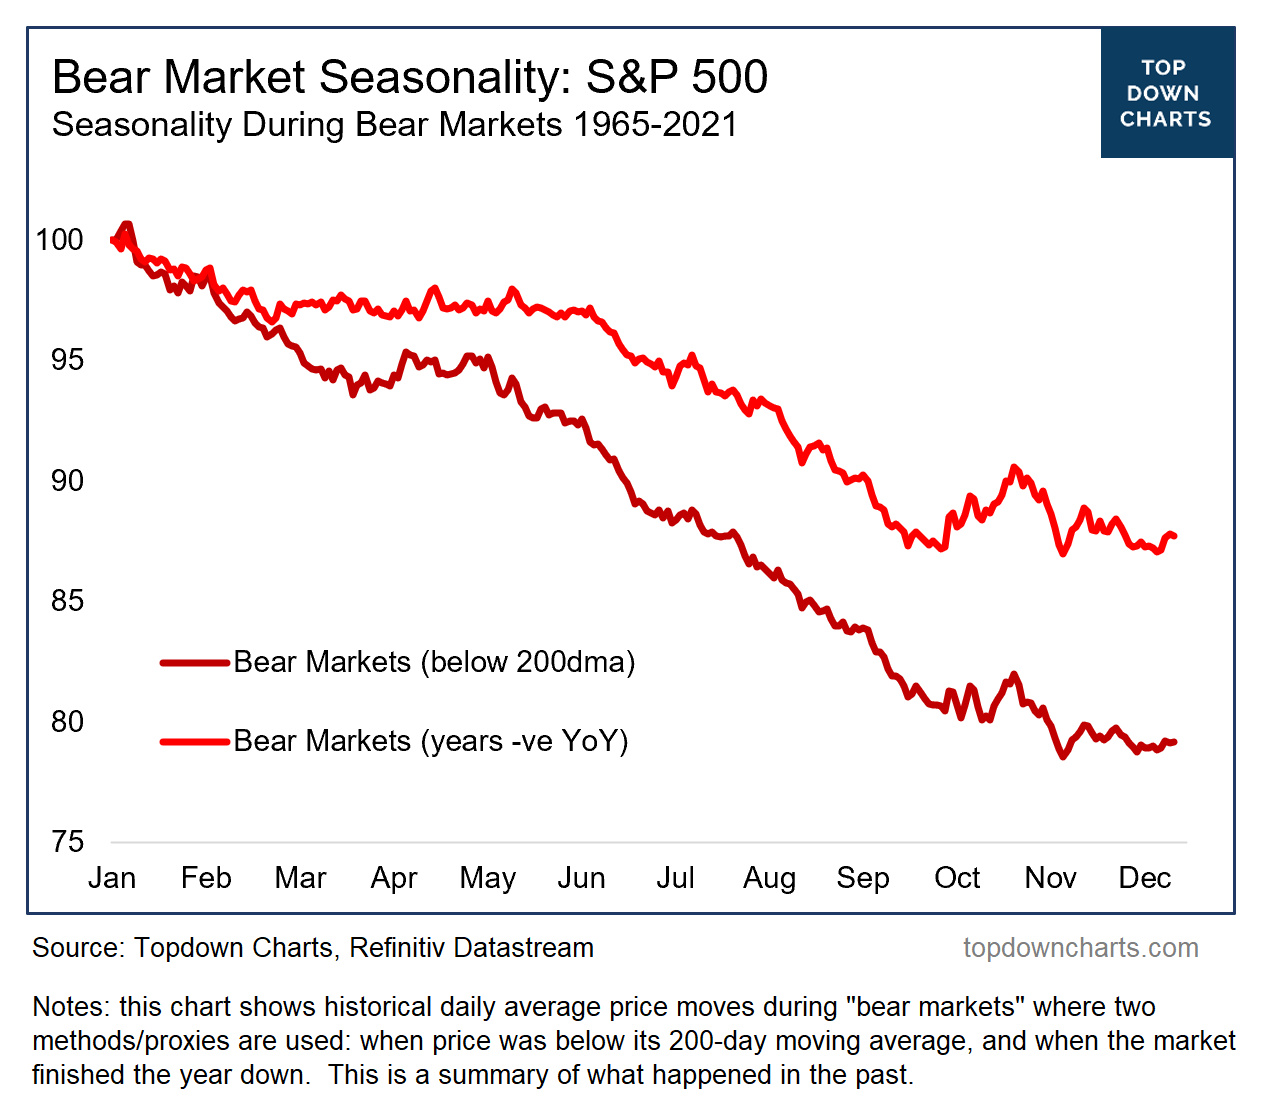
One last thing — in case anyone was wondering, the reason why the “All Years“ seasonality curve in the first chart looks quite similar to the “Bull Markets“ seasonality curve is that during the 1965-2021 period there were more bull markets than bear markets (bear markets as defined by the market being down on the year happened 26% of the time, or 30% of the time on the 200dma definition). Which in and of itself is an interesting market statistic for the long-term B&H crew.
And before we close out, I guess I should also note the key takeaway would be that if we are indeed in a bear market this year, then we shouldn’t be getting too excited about a year-end rally, because seasonal year-end rallies statistically only happen during bull markets.
Taking that chart literally, what we can expect in Nov/Dec is ranging volatility at best.
Key Point: Seasonal trends in the stock market look very different in bull vs bear markets; confounding some of the conventional wisdoms.
Be the first to comment