

JimVallee
My investment thesis
In my September 29, 2021, article on Charles Schwab (NYSE:SCHW), I articulated the investment thesis that:
In recent years, two significant developments have resulted from intense competition within the discount brokerage industry: firstly, the elimination of trading commissions has increased firms’ reliance on cash balance management revenues, which have been squeezed in this near-zero interest rate environment; and secondly, the industry has consolidated into an oligopoly.
As an industry leader, Charles Schwab Corporation is particularly well-positioned to benefit from the continued long-term growth in wealth management assets, a more disciplined industry, synergies from its Ameritrade acquisition, and the expected hiking of interest rates as the economy recovers from the COVID pandemic.
In this follow-up article, I will re-examine the validity of my thesis and how my key concerns played out.
Industry dynamics unchanged
Schwab’s active brokerage accounts (figure 1), new client assets (figure 2), and average client assets (figure 3) have all held up despite the recent market volatility, and the company recorded a net new asset inflow of $120 billion in the first quarter of 2022. (Note that one-time jump in 4Q 2020 was a result of TD-Ameritrade client assets being folded into Schwab following the close of the acquisition).
Figure 1: Schwab active brokerage accounts
Created by author using publicly available financials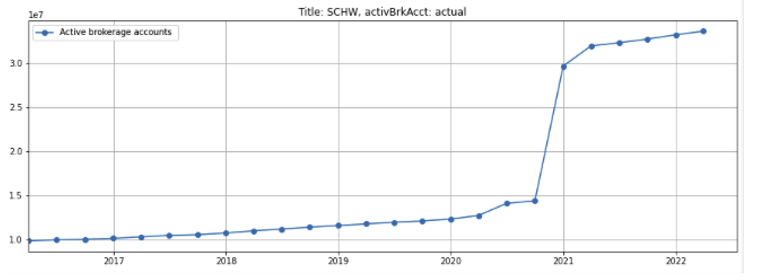
Figure 2: Schwab net new client assets
Created by author using publicly available financials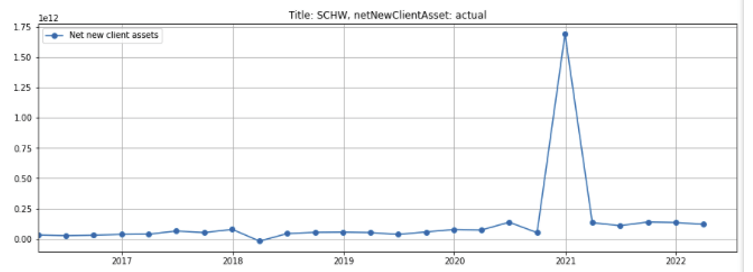
Figure 3: Schwab average client assets (in trillions)
Created by author using publicly available financials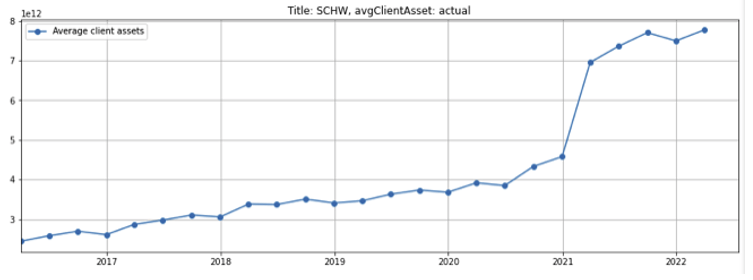
The average percentage of cash held in client accounts, from which Schwab generates its net interest income, ticked up by almost 90 basis points over the last three quarters to 11.4% 2021 as investors trimmed back their positions following the equity market sell off (figure 4). Based on numbers provided in Schwab’s May 2022 Monthly Activity Report for May 2022, the cash percentage reached 12% of client assets as of month-end May 2022, up from 10.8% in May. As a result, client cash increased 9.8% from $799 billion in May 2021 to $876 billion in May 2022, but is still 2.3% below the $896 billion peak reached in March 2022.
Even though Schwab experienced an outflow of $9.2 billion of client assets for the month of April 2022 as the market volatility increased, this reversed to an inflow of $32.8 billion in May. Client assets decreased from $7.9 trillion in end-March 2022 to $7.3 trillion in end-May, largely due to a $584 billion decline in the market value of assets in client accounts driven by the pullback in global financial markets resulting from commodity price spikes following Russia’s invasion of Ukraine and the Federal Reserve’s aggressive interest rate hike.
Figure 4: Schwab client cash as a percentage of client assets
Created by author using publicly available financials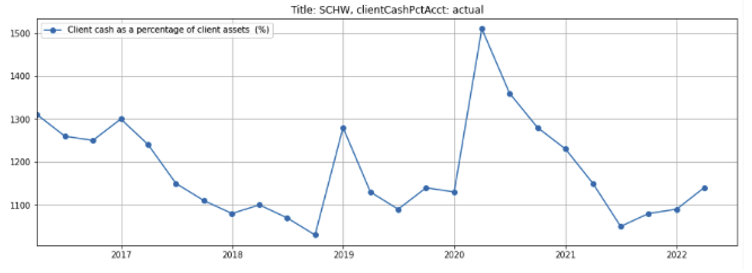
Disrupters like Robinhood (HOOD) do not appear to be as large a threat to Schwab as some market commentators had originally thought. The targeted client bases are quite distinct – the average client account size at Robinhood is $4,000 compared to Schwab’s $234,000, while the age of the average Robinhood user is 31 compared to Schwab’s 52. As of Q1 2022, Robinhood reported a 10% decrease in monthly active users and its average revenue per user declined by 62% compared to Q1 2021.
Even though Schwab’s asset base was negatively impacted by the 21% pullback in the equity market (as measured by the S&P 500 index) since the beginning of 2022, I believe this is likely to be a short-term speed bump and expect the wealth management industry and Schwab assets to resume climbing over the intermediate to long term.
Synergies from the Ameritrade acquisition
Cost synergies
In the company’s Spring Business Update on April 22, 2021, the company projected run-rate expense synergies of $1.8-2.0 billion from its Ameritrade acquisition, of which 25%-35% would be delivered within 1 year of the transaction close (figure 5).
Figure 5: Projected synergies from the Ameritrade acquisition
Schwab spring 2021 business update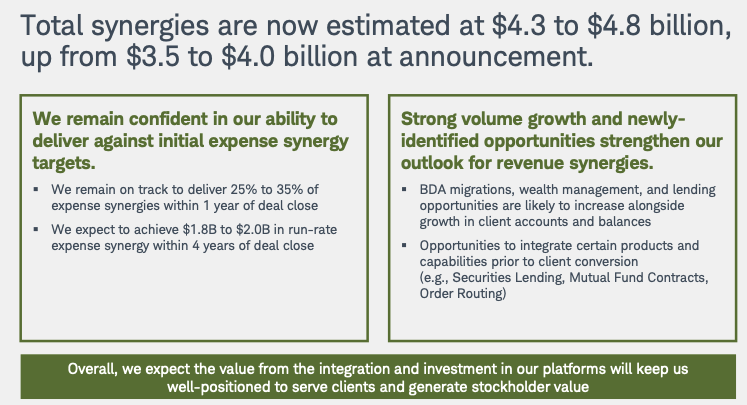
It affirmed the expense synergies in its SEC Form 10-K filing for the year ended 2021, stating that (page 34):
“(W)e expect to incur total acquisition and integration-related costs and capital expenditures of between $2.0 billion and $2.2 billion. Acquisition and integration-related costs, which are inclusive of related exit costs, totaled $468 million and $442 million for the years ended December 31, 2021 and 2020, respectively, and the Company expects to incur acquisition and integration-related costs of approximately $350-$400 million in 2022. Over the course of the integration, we continue to expect to realize annualized cost synergies of between $1.8 billion and $2.0 billion, and, through December 31, 2021, we have achieved approximately half of this amount on an annualized run-rate basis. The Company expects to have realized approximately 60% of our estimated annualized cost synergies by year-end 2022, with much of the remaining estimated cost synergies expected to be realized after the completion of client conversion and into 2024.
Revenue synergies
In the same Spring Business update, management estimated total synergies of $4.3-4.8 billion, implying revenue synergies of $2.5-$2.8 billion. The company noted in its 2021 Fall Business Update that the Ameritrade integration and planned platform upgrade is on track.
If the company meets its projected combined synergy target of $4.3-4.8 billion and assuming this translates to post-tax income of ~$2 billion at a price earnings ratio of 20x, the equity value created by synergies from the Ameritrade acquisition would be approximately $40 billion.
Impact of a higher interest rate environment
Schwab derives revenues from two primary sources: net interest income and non-interest income. Net interest revenue, primarily from cash balances in client accounts and loans, has historically made up about a little over 50% of total revenues, with the non-interest revenue coming primarily from asset management/administration fees and trading revenues.
The company’s 2022 Q1 Form 10-Q filed with the SEC notes:
“Interest rates largely remained historically low for much of the first quarter of 2022. Short-term rates remained near zero [author’s note: it stayed at around 8 basis points, or 0.08%, for most of the first quarter of 2022] until the Federal Reserve increased the Federal Funds target overnight rate by 25 basis points near the end of the quarter, while long-term interest rates steadily increased during the quarter. “
Since then, the Federal Reserve has raised the federal funds rate further to combat surging inflation. As of this article, the Fed funds rate stands at 1.58%, though it remains below the 10-year highs of ~2.45% set in 2019 (see figure 6).
Figure 6: Federal funds rate
Federal Reserve Bank of New York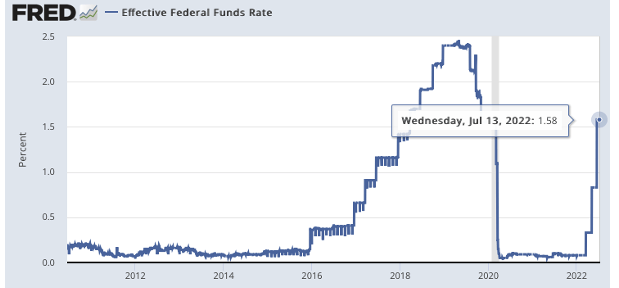
The Federal Reserve’s move to raise interest rates to stave off inflation directly impacts both of Schwab’s revenue sources:
- Net interest revenues will increase significantly as higher interest rates result in wider interest rate spreads, and
- rising interest rates also cause equity values to compress, which could negatively impact Schwab’s non-interest revenues.
I evaluate the each of the impacts below:
Net interest revenue is poised to grow with rate hikes
I wrote in my previous article:
Like a bank, Schwab generates interest revenue by investing its clients’ account cash balances in fixed income securities but paying clients less interest than it receives. The spread between the gross interest income Schwab receives and the interest expense it pays out to clients, which is reported as “net interest income” on its income statement, is an important source of Schwab’s revenue today. Schwab’s net interest income grows in a rising interest rate environment as the spread expands and there is more interest to “share” with clients. Conversely, the company’s net interest income is compressed in a low interest rate environment. (To illustrate, for an account with a cash balance of $10,000, Schwab has $350 to divvy up with the client when annual interest rates were at 3.5%. At rates of 60bp, there is only $60 available for both Schwab and the client).
Net interest income
Mathematically:
Net interest income = interest earning assets * yield spread rate
Income earning assets
Schwab’s interest earning assets, which include interest bearing securities, margin loans, bank loans, cash, and other investments, tripled from under $200 billion in end-2016 to over $632 billion at the end of March 2022 (figure 7, blue line). However, this sharp increase in 2021 was a result of the acquisition of Ameritrade which necessitated the issuance of new shares to Ameritrade that diluted existing Schwab shareholders. After factoring new shares issued for the Ameritrade acquisition, the interest earning assets to pre-acquisition Schwab shareholders more than doubled to about $450 billion (dotted orange line).
Figure 7: Schwab’s average balance of interest earning assets
Created by author using publicly available financials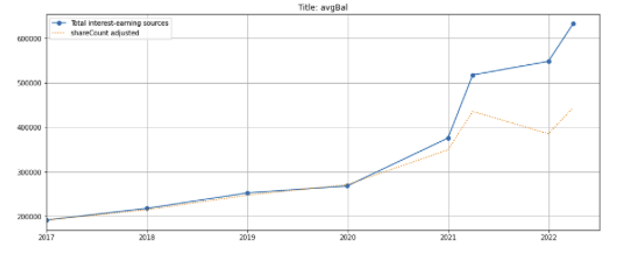
Yield spread rate
Schwab’s average yield spread on interest earnings assets (i.e., the gross interest revenue less interest expense paid) is highly sensitive to the federal funds rate. Schwab’s average yield spread rate increased through 2019 (figure 8, blue line) along with the federal funds rate (green dashed line) as the Fed tightened its monetary policy to ward off potential inflation risk. However, the yield dropped sharply in March 2020 after the Fed implemented another round of quantitative easing and lowered the federal funds rate to just 8 basis points to provide the economy with necessary liquidity following the outbreak of the COVID-19 pandemic.
As inflation and the consumer price index began rising sharply in March 2022, the Fed abruptly raised the federal funds rate by 100 bps (green dashed line). I expect Schwab’s yield spread for the second quarter of 2022, which will be reported as in Schwab’s Q2 2022 earnings release, to rise with the federal funds rate.
Figure 8: Schwab’s average yield rate compared to the federal funds and 3-month Treasury (DTB3) rates
Created by author using publicly available financials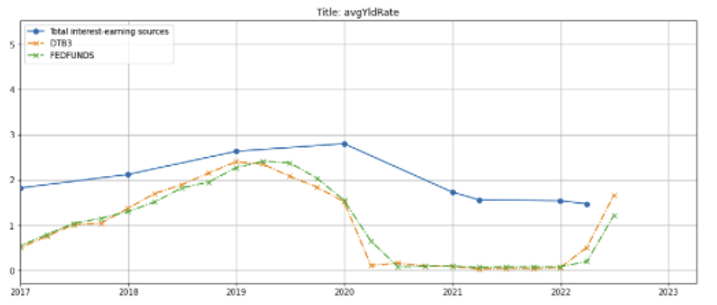
Net interest income
Schwab’s net interest revenue peaked in 2019 as yield spread widened, declined in 2020 as the yield on interest earning assets fell in response the lowered federal funds rate (figure 9, blue line), and rebounded in 2020 as Schwab’s interest earnings assets grew because of the Ameritrade acquisition. However, the 2021 share count-adjusted net interest revenue (orange line) remains below 2019 and 2020 levels.
Q1 2022 net interest revenue was still depressed, but I expect it to rise in Q2 2022 along with the increased federal funds rate.
Figure 9: Schwab net interest revenue
Created by author using publicly available financials
(Important Note on figure 9: the numbers labeled “Q1 2021” and “Q1 2022” are on a quarterly basis, all other numbers are annual)
What Schwab says about the impact of rising interest rates
In Schwab’s 2022 Q1 SEC 10-Q filing (page 12), management provided the results of its interest rate simulations, which show that a gradual 100 basis point increase in market interest rates is expected to raise the company’s net interest revenue by 12% to 14% (figure 10, row 1).
Figure 10: Impact of a 100-basis point change in interest rates on net interest revenue
Schwab 2022 Q1 10-Q filing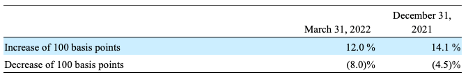
In its Spring Business Update on April 21, 2022, management noted that if the federal funds rate finishes the year at 2.5%, Schwab’s net interest income markets could reach 180 basis points by the fourth quarter of 2022, 30% higher than the 138 basis points at the end of March 2022 (figure 11), and that full-year 2022 net interest income could be in the mid-160 basis points range.
Figure 11: Potential net interest margin trajectory
Schwab Spring 2022 business update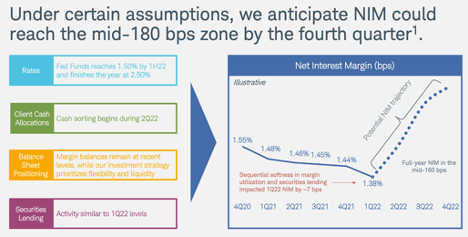
The company further noted in its 2022 Q1 10-Q filing:
“(O)ver recent quarters, the Company has increased its cash holdings and reduced the duration of incremental investment securities purchases to provide flexibility to support potential changes in client cash allocations associated with expected higher short-term interest rates. These steps also help keep Schwab positioned to benefit [author’s note: and reduce the risk of losses] if rates increase further.”
Outlook for net interest income
According to a CNBC article on July 13, 2022, some traders are betting that the Federal Reserve could raise interest rates by another 1 percent in July 2022. Given the more consolidated industry structure following Schwab’s acquisition of Ameritrade and Morgan Stanley’s acquisition of eTrade, I believe that the average yield can approach the highs set in 2019 (see figure 7) if the federal funds rate remains at the 250-basis point level for a period of time and drive Schwab’s net interest income to an all-time high.
Non-interest income
Schwab’s non-interest income consists of two components: asset management/administrative fees and trading revenue.
Asset management and advisory fees, which makes up about 22% of total revenues, include management fees from ETFs, mutual funds, as well as investment advisory, trust, and recordkeeping fees for client assets. On a share count-adjusted basis (i.e., after adjusting for the additional shares issued for the Ameritrade acquisition), revenues from this segment have remained largely static (figure 12, blue line).
Trading revenues, which include commissions, order flow revenue, and principal transaction revenues, make up 20% of total revenues. Even though Schwab eliminated commissions for most equity trades, it continues to generate order flow revenue from market makers. Trading revenues increased following the close of the Ameritrade acquisition in 2020 because Ameritrade clients trade more frequently and in more “exotic” derivative securities (such as options) that generate higher trading revenue than legacy Schwab clients (orange line).
Figure 12: Schwab share count-adjusted non-interest revenues
Created by author using publicly available financials
I had posited in my previous article that Schwab’s non-interest income is directly correlated to the S&P 500, which is in turn inversely correlated with interest rates. A rise in interest rates would cause the S&P 500 and thus Schwab’s non-interest income to decline, which will partially offset the growth in net interest income stemming from higher interest rates.
After testing my conjecture with actual data from the last 6 years, I realized that I was only partly correct. Trading revenues indeed rose with the level of the S&P 500 index (figure 13). In contrast, per share asset management and advisory fee revenues were less affected by the S&P 500 than I expected (see figure 14) – this is because the additional fees from increased assets due the appreciation of the S&P 500 were offset by lower money market fund assets and fee waivers on money market funds (both a result of the historically low interest rates), the loss of fees from ETF fund sponsors after Schwab transitioned to commission-free trading, and the increased share count due to the Ameritrade acquisition.
Conversely, as interest rates rise, Schwab will be able to generate more asset management fees by suspending its money market fund fee waivers, but this will be offset by lower management fees from its equity funds, which are based on the value of assets under management.
As such, I expect Schwab’s asset management and advisory fee revenues to be driven more by new asset inflows than interest rates or stock market fluctuations.
Figure 13: Schwab share count-adjusted trading revenue vs the S&P 500 index
Created by author using publicly available financials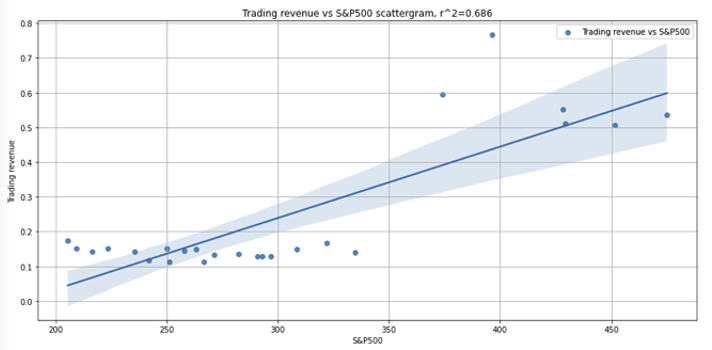
Figure 14: Schwab share count-adjusted asset management & advisory fees vs the S&P 500 index
Created by author using publicly available financials
Margins and earnings
Schwab’s margins (figure 15, blue, green, and orange lines) peaked in 2019, pulled back in 2020 because of the COVID-19 pandemic outbreak and integration costs incurred from the Ameritrade acquisition, but are expected to tick up with rising interest rates that will cause net interest margins to expand.
I expect Schwab’s revenue growth (red dashed line; purple dotted line for revenues adjusted for the increase in shares outstanding), which has driven per share earnings growth since the summer of 2016, to continue over the intermediate to long-term.
Figure 15: Schwab revenue growth and margins
Created by author using publicly available financials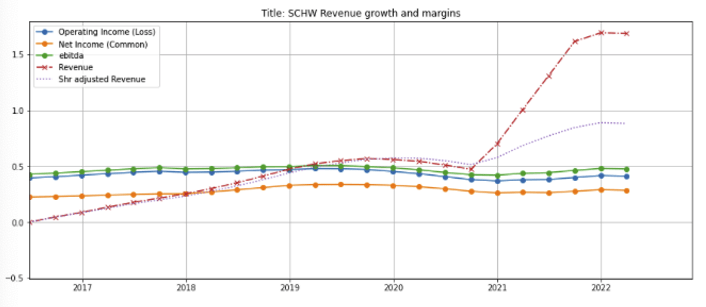
Return on equity
Schwab’s returns on equity (figure 16, solid line) and tangible common equity (dotted line) have held up at respectable levels through the market volatility in 2021. I view both as proxies and indicative of the stock’s compounding power.
Figure 16: Schwab return on equity
Schwab spring 2022 business update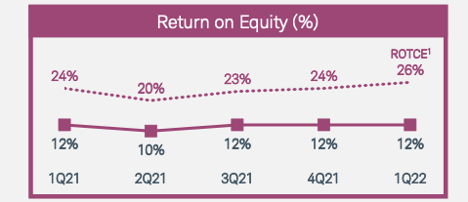
Valuation
Following the stock’s 40% pullback from its 52-week highs, Schwab’s trailing price earnings ratio has dropped to around 22x trailing net income, while its price to book ratio is down to about 2.5x (figure 17).
Figure 17: Schwab price-earnings (left) and price to book (right)
Created by author using publicly available financials and stock prices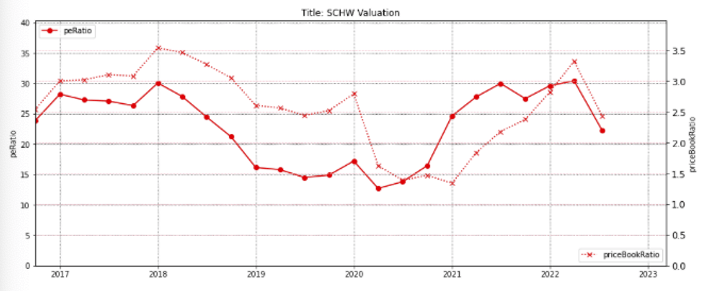
The company continues to incur acquisition and integration-related costs. According to the company’s 2021 SEC Form-10K filing:
Acquisition and integration-related costs, which are inclusive of related exit costs, totaled $468 million and $442 million for the years ended December 31, 2021, and 2020, respectively, and the Company expects to incur acquisition and integration-related costs of approximately $350-$400 million in 2022.
This indicates that the company’s profitability of its core business is higher than reported. If management achieves its projected annual synergies of $4.3-4.8 billion, the current valuation of Schwab stock will be a highly attractive entry point.
Concerns
In my September 2021 article, I highlighted my three top concerns, which were:
(1) External shock or market meltdown: The Russian invasion of Ukraine sent shockwaves through the global markets, causing equity markets to pull back and commodity prices, particularly oil and gas, to soar. Schwab’s stock price has fallen by almost 40% from its 52-week high of $96, which may create a potentially attractive entry point.
(2) An extended bear market: we are approaching bear market territory. A prolonged bear market could cause investors to lose interest in the equity markets and move their cash balances to other financial institutions that offer marginally higher rates on interest-bearing products. This remains a risk.
(3) Continued low interest rate environment: This is no longer the case as the Federal Reserve was forced to raise interest rates earlier this year to counter the risk of rising inflation.
I surface a new concern that client fund inflows could slow down:
(4) Schwab experienced an outflow of $9.2 billion of client assets for the month of April 2022 as the market volatility increased. Even though this reversed to an inflow of $32.8 billion in May, near-term client asset inflows may remain unpredictable as the market volatility continues.
Mitigating factor: I believe that industry’s client asset balance will increase over the intermediate to long-term, and the company will benefit as clients seek more established and safer financial institutions to hold their investment assets.
Summary
-
Positive long term wealth management industry fundamentals remain intact, and my expectation of earnings growth from higher interest rates and the Ameritrade acquisition integration synergies is gaining visibility.
-
Even though near-term asset management and trading revenues will be negatively affected by rising interest rates and declining stock market valuations, the impact may be less pronounced than I had expected.
-
Schwab’s stock has declined by nearly 40% from its 52-week high and is now priced at 22 times trailing earnings that is temporarily depressed by significant Ameritrade integration costs.
-
Assuming management achieves its projected annual acquisition synergies of $4.3-4.8 billion and interest rates hikes hold up, the current stock price will prove to be an attractive entry point.
Be the first to comment