

Liudmila Chernetska
ICL Group (NYSE:ICL) is one of the largest multinational companies headquartered in Israel, a world leader in the production of bromine and one of the key companies in the mining of potash and phosphate rock. While CF Industries (NYSE:CF) is the world leader in the production of nitrogen-containing fertilizers, including urea, UAN and ammonium nitrate. Both companies have growing revenues and high business margins and have lower financial ratios than most companies in the fertilizer and agrochemicals industry, which makes ICL Group and CF Industries to be considered as long-term assets amid high commodity prices. However, despite the attractiveness of both companies, one of them is more promising and is more likely to be able to double the capitalization and significantly increase dividend payments relative to the second.
Financial position of CF Industries vs. ICL Group
CF Industries’ revenue was $2,868 million in Q1 2022, up 12.9% QoQ. At the same time, ICL Group showed stronger dynamics, which earned $2,525 million in Q1 2022, up 23.9% compared to Q4 2021.
Source: Author’s elaboration, based on Seeking Alpha
ICL Group’s price/sales ratio is significantly lower than the average for the fertilizer and agrochemicals industry, indicating that it is undervalued by Wall Street. While this figure for CF Industries was 2.09, which is 46.2% more than the Israeli company, thus showing that ICL Group is the most undervalued asset in the industry.
Source: Author’s elaboration, based on Seeking Alpha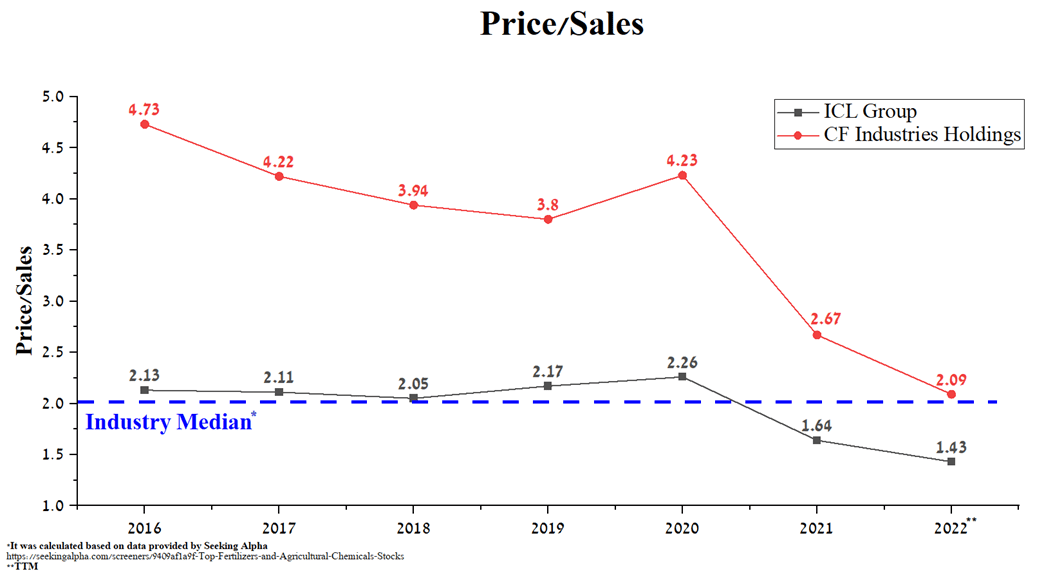
Another important financial parameter is the EV/EBITDA ratio, which can be used to compare the investment attractiveness of both companies since it does not depend on the capital structure. Even though this indicator of both companies is significantly lower than the industry, however, the EV / EBITDA ratio of ICL Group was 6.09 at the end of 1Q 2022, which is 46.4% more than the second company and mainly due to higher prices for nitrogen fertilizers, which CF Industries specializes in.
Source: Author’s elaboration, based on Seeking Alpha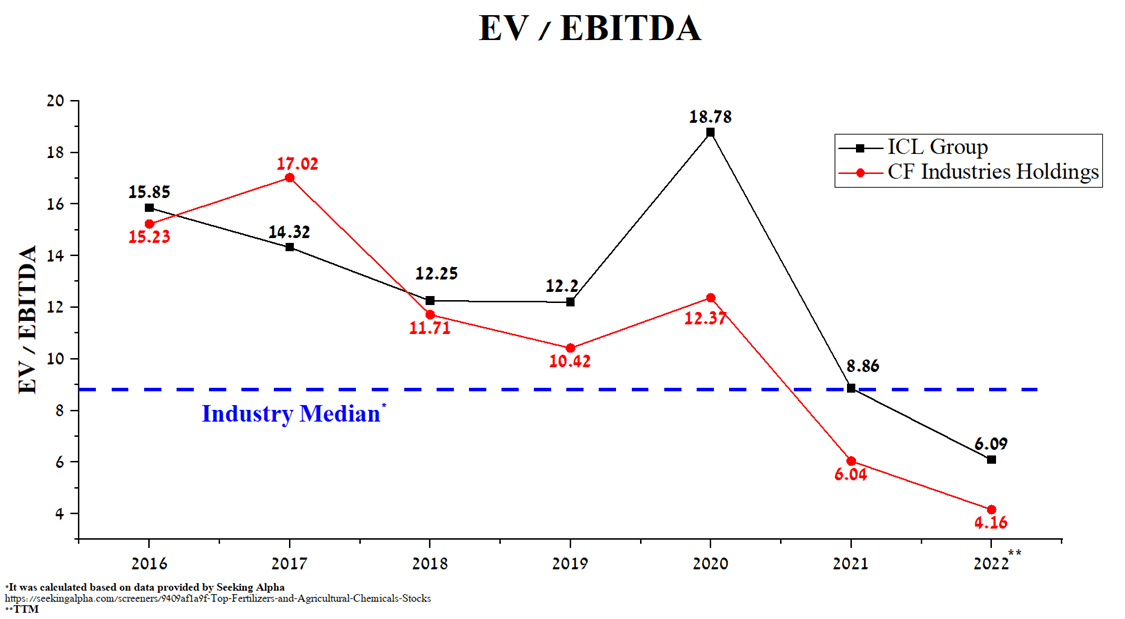
Debt Burden of CF Industries vs. ICL Group
CF Industries’ total debt is $3,702 million at the end of Q1 2022, down slightly from the previous quarter. While the total debt of ICL Group is $2,908 million, which is 3.8% less than Q4 2021. At the same time, the difference in the total debt between these companies is $794 million, which, according to this indicator, is more attractive to ICL Group due to less spending of net income on debt servicing.
Source: Author’s elaboration, based on Seeking Alpha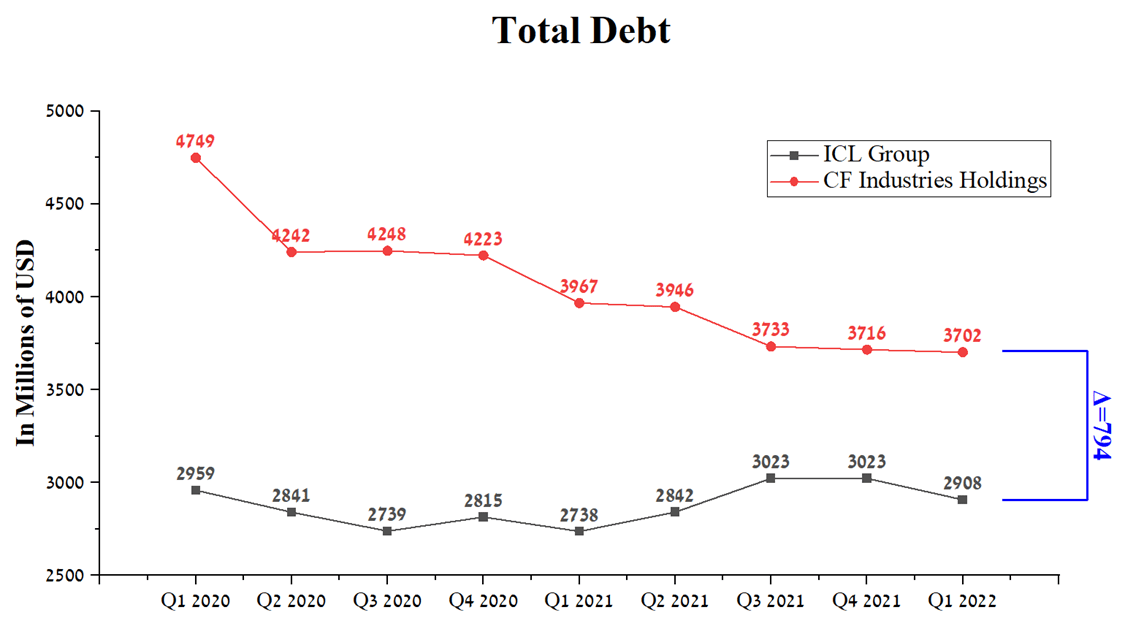
During the first half of 2022, CF Industries’ management continued to pursue a strategy to accelerate debt repayments during times of high commodity prices by buying back $500 million in senior notes maturing in 2023. As a result, the company’s Total Debt/EBITDA has been reduced below 1, and with a single repayment of $742 million through 2030, there is no risk associated with CF Industries’ debt.
Source: Author’s elaboration, based on 10-K,8-K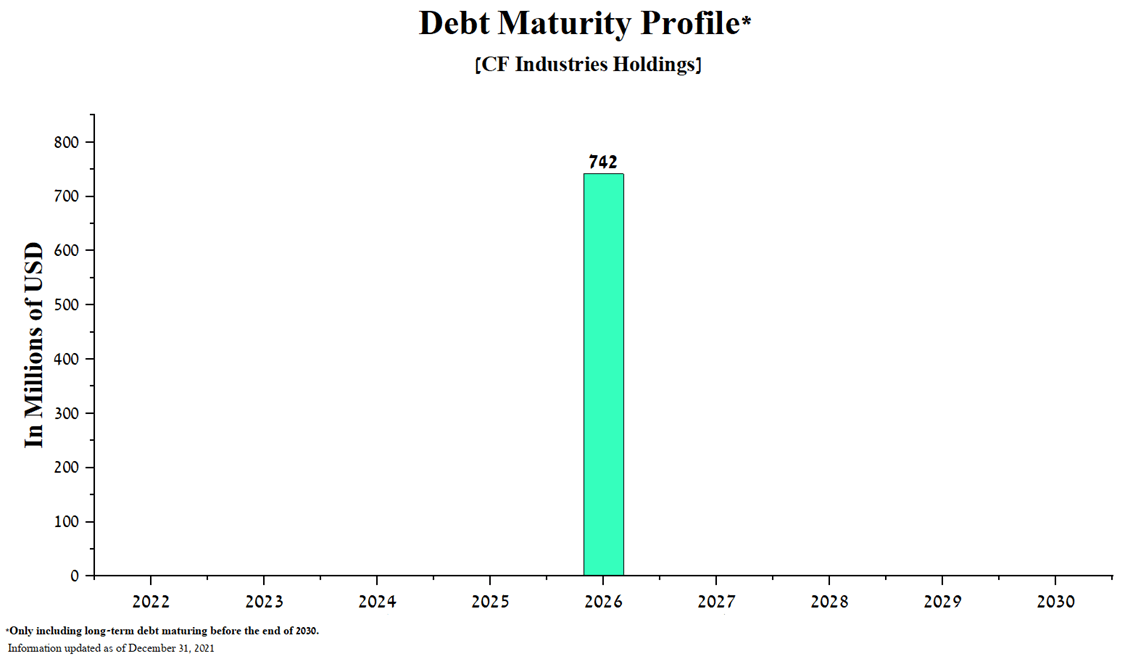
While ICL Group’s senior bonds and loans will mature in all years until 2030, given the continued development of the business and the improvement in the company’s financial position, there are no significant risks with their redemption.
Source: Author’s elaboration, based on 20-F
However, taking into account the amount of total debt and the date of its repayment, ICL Group is slightly less attractive relative to CF Industries in terms of this parameter.
Dividend policy of CF Industries vs. ICL Group
The dividend yield of CF Industries is 1.51%, which is significantly lower than the dividend yield of ICL Group, which is 5.54%. It should be noted that this financial ratio is higher for an Israeli company than the average value for this sector, which is about 2.13%.
Source: Author’s elaboration, based on Seeking Alpha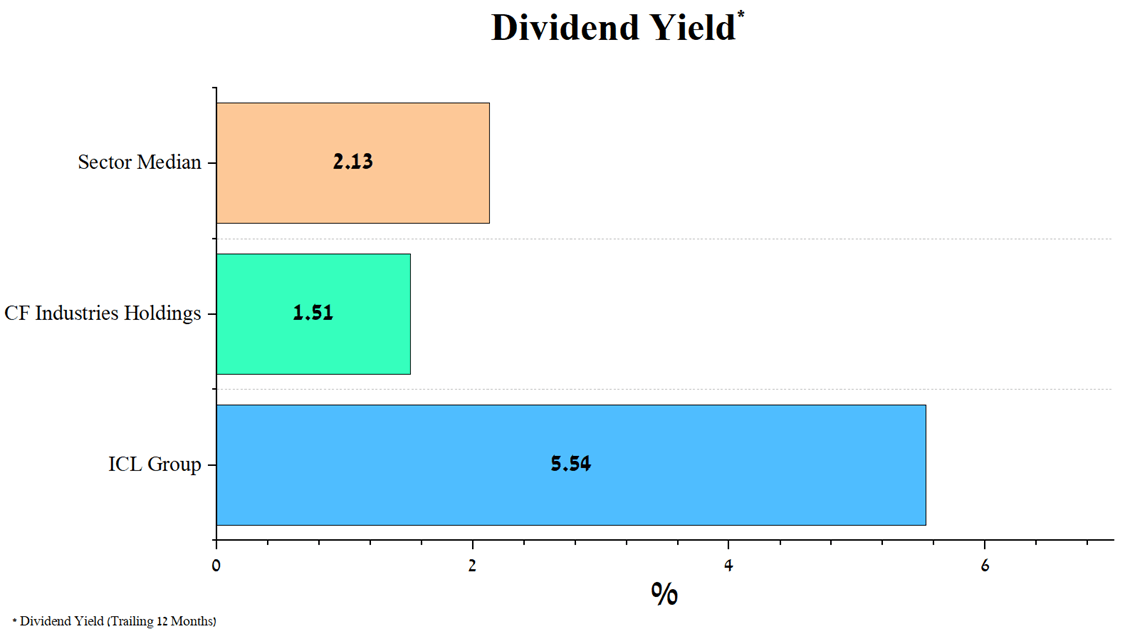
ICL Group’s annual dividend payout ranged from 21.3% of EBITDA in 2018 to 26% in 2021. As a result, to predict the amount of dividend payments for 2022, I assumed that 24.5% of EBITDA, which according to the guidance of ICL Group management will be about $3,625 million in 2022, will be allocated to these tasks.
Source: Created by author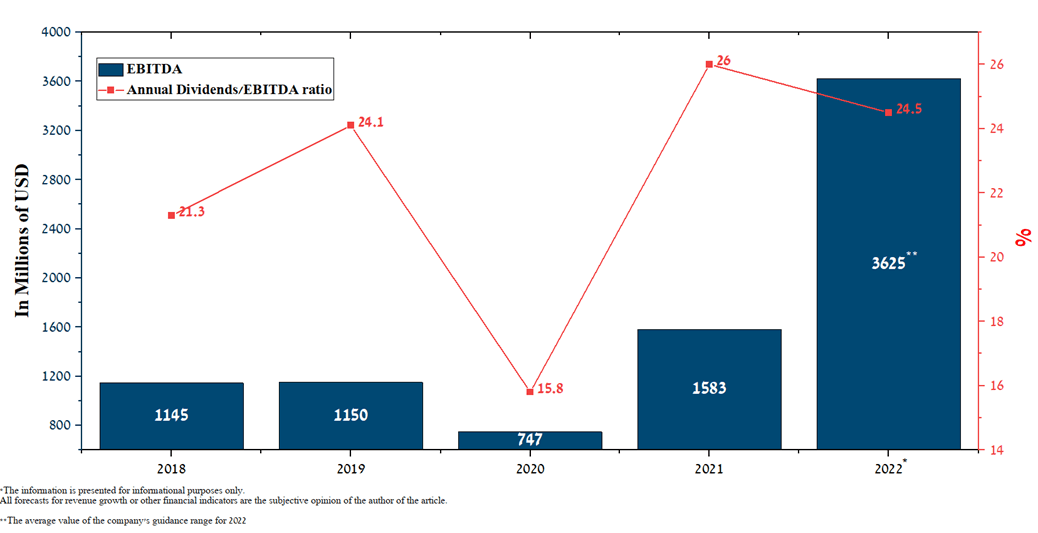
As a result, the company’s dividend payout could be $888 million for 2022, up 116.1% from 2021.
Source: Created by author
Thus, ICL Group’s dividend yield could rise to 7.8% in 2022. CF Industries’ dividend policy differs from that of ICL Group, as a result of which the payout amount remains almost unchanged and has the following dynamics.
Source: Author’s elaboration, based on Seeking Alpha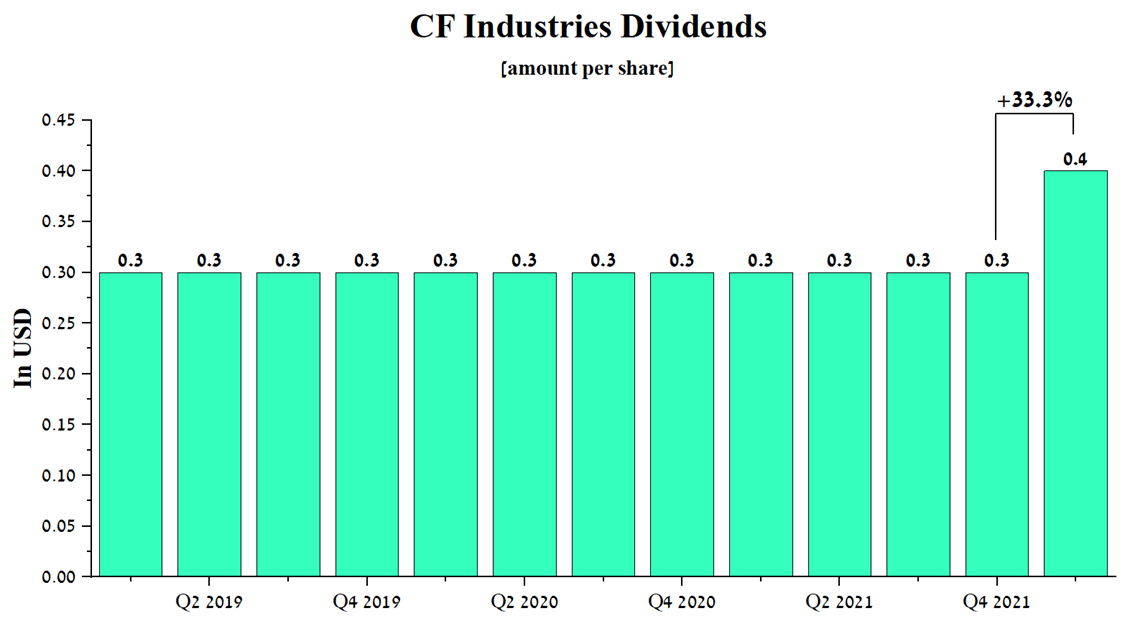
The company increased its dividend payout by 33% for Q1 2022, the first increase since 2015. I estimate that the company will continue to pay out $0.4 per share each quarter, which could see CF Industries’ dividend yield rise to 1.9% for 2022. Thus, according to this indicator, ICL Group is more attractive to pension funds and institutional investors with a long-term investment strategy.
Comparison of CF Industries and ICL Group business
CF Industries and ICL Group, being global companies, have an extensive logistics network for the delivery and production of raw materials, and finished products, which are advantages in this industry. However, unlike CF Industries’ business, which is mainly focused on the production of nitrogen-containing fertilizers and ammonia, ICL has a broader portfolio of products, including fertilizers, industrial and innovative products for agriculture, which are widely used in various industries. Thus, this chapter will compare the segments of both companies that have the largest share of sales in total revenue.
CF Industries’ key segment is urea production
Before proceeding directly to the discussion of the prospects for the granulated urea segment, it should be noted that due to the company’s efficient business model, the utilization rate of ammonia assets over the past five years is about 14% higher for CF Industries relative to competitors.
Source: Author’s elaboration, based on 10-K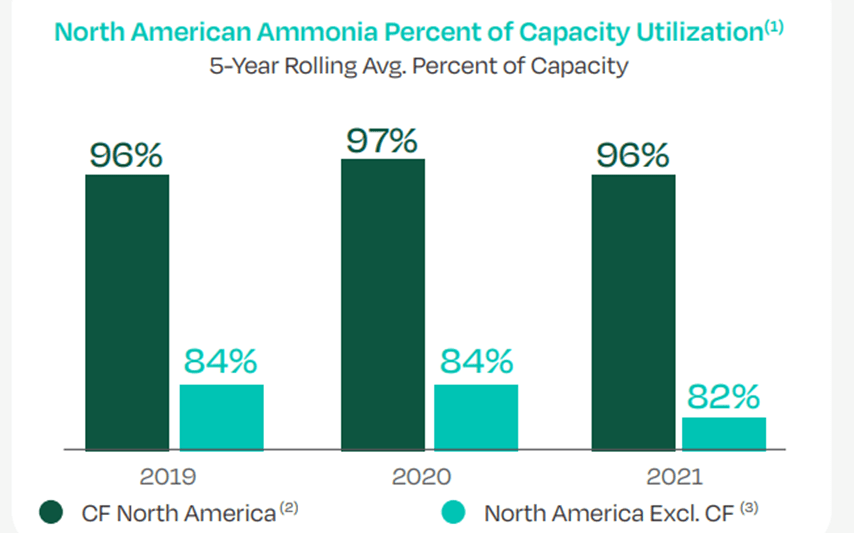
However, despite the high efficiency in the use of capacities, the production of ammonium, which is a reagent in the production of urea, continues to decline. In addition, there is a similar trend in the production of other nitrogen products, including urea, whose volumes fell by 17.6% year on year.
Source: Author’s elaboration, based on 10-K
This shows that despite the improvement in the situation with COVID-19, the company continues to have difficulties with the delivery of products, with the maintenance of equipment, and also with the search for new markets. In my estimation, CF Industries’ revenue in the coming quarters will be mainly correlated with commodity prices and competitor activity. CF Industries and Nutrien (NTR) are the largest ammonium and urea companies in the US and Canada, but CF Industries controls about 40.2% of the total production capacity.
Source: 2022 Fact Book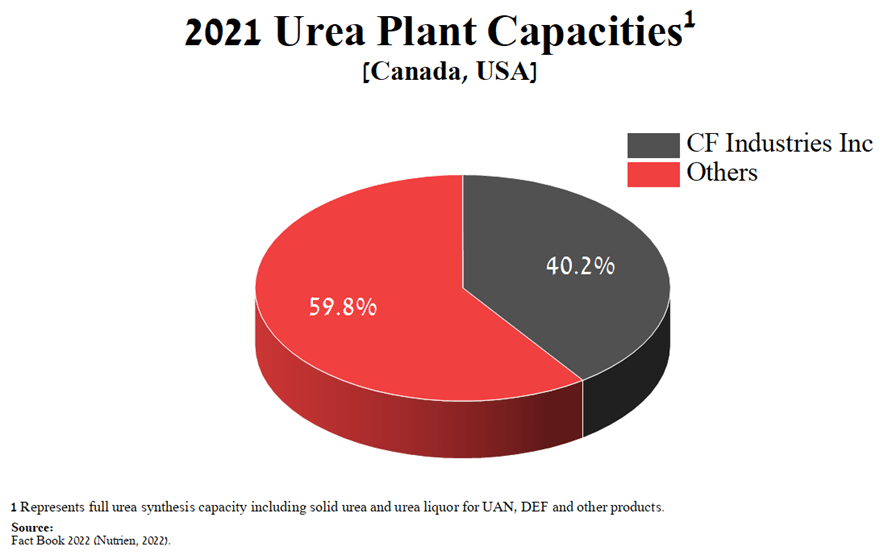
The share of the granular urea segment is 26.67% of the company’s total revenue, which is 0.61% more than in the previous quarter. According to my estimate, this indicator will continue to remain low volatile in the coming quarters and will be about 26% by the end of Q1 2023 due to a slight decrease in urea production and also stabilization of prices for it.
Source: Created by author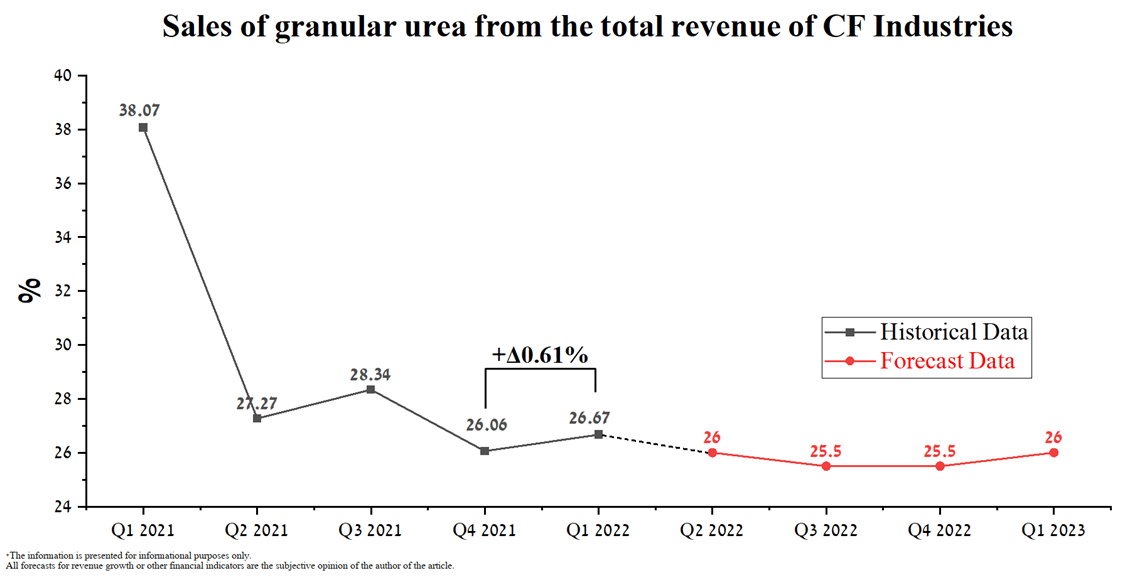
This segment’s revenue was $765 million in Q1 2022, up 15.6% QoQ. In addition, thanks to continued high commodity prices, the gross margin continues to improve quarter by quarter and stands at about 64.7%, which favorably affects the increase in dividends.
Source: Author’s elaboration, based on quarterly securities reports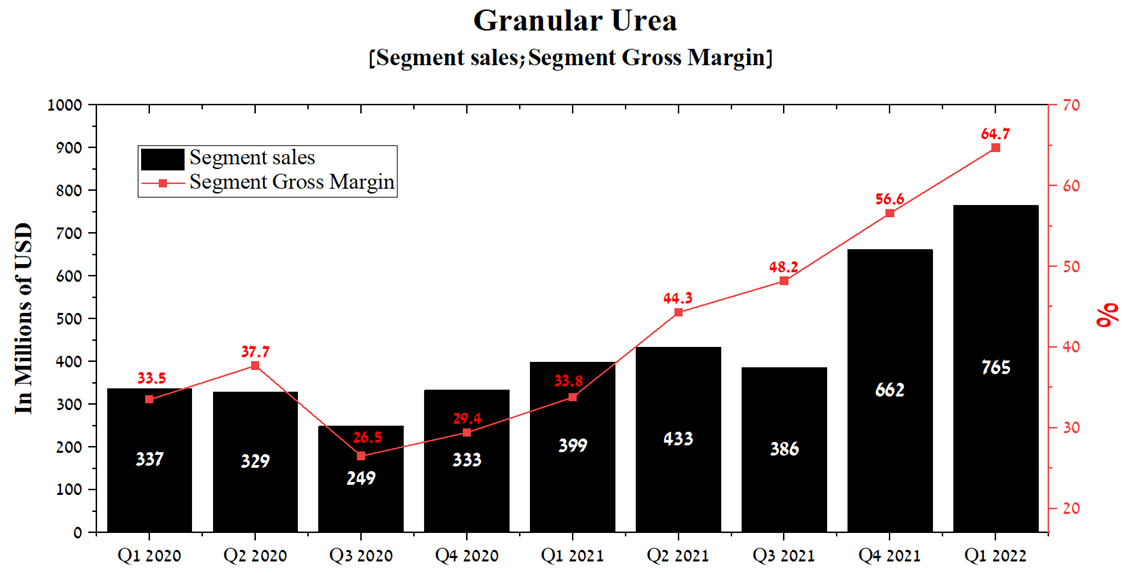
However, I believe that from the 3rd quarter of 2022 the marginality of this segment will begin to decline due to the continued high prices for natural gas, which is the main reagent for the synthesis of urea.
Source: Author’s elaboration, based on CF Industries press release
Thus, the price of US natural gas futures for Q2 jumped to $6.94 per MMBtu in Q2, which is 39.6% more than in the previous quarter, and there is still no downward trend.
Source: Author’s elaboration, based on Investing.com
The second factor that will lead to a decrease in revenue and gross margin of the granular urea segment is a decrease in prices for this product, which amounted to $774.2 per ton in Q2 2022, down 5.7% compared to the previous quarter.
Source: The World Bank Group
In addition, urea prices continue to decline from month to month, reaching $690 per tonne in June 2020, and this trend is mainly associated with a decrease in demand for this product in the United States.
Source: The World Bank Group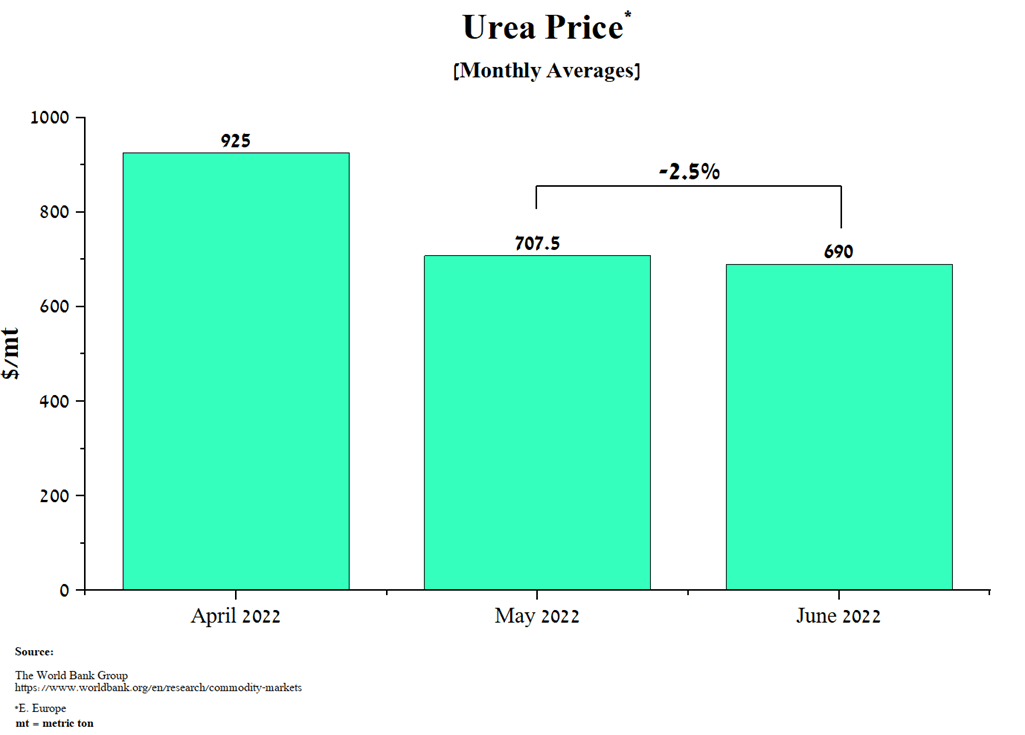
Thus, taking into account historical trends in sales of urea granules, current downward trends in production volumes, strong competition and a tense situation in finding new markets, I expect revenue in this segment until 2025.
Source: Created by author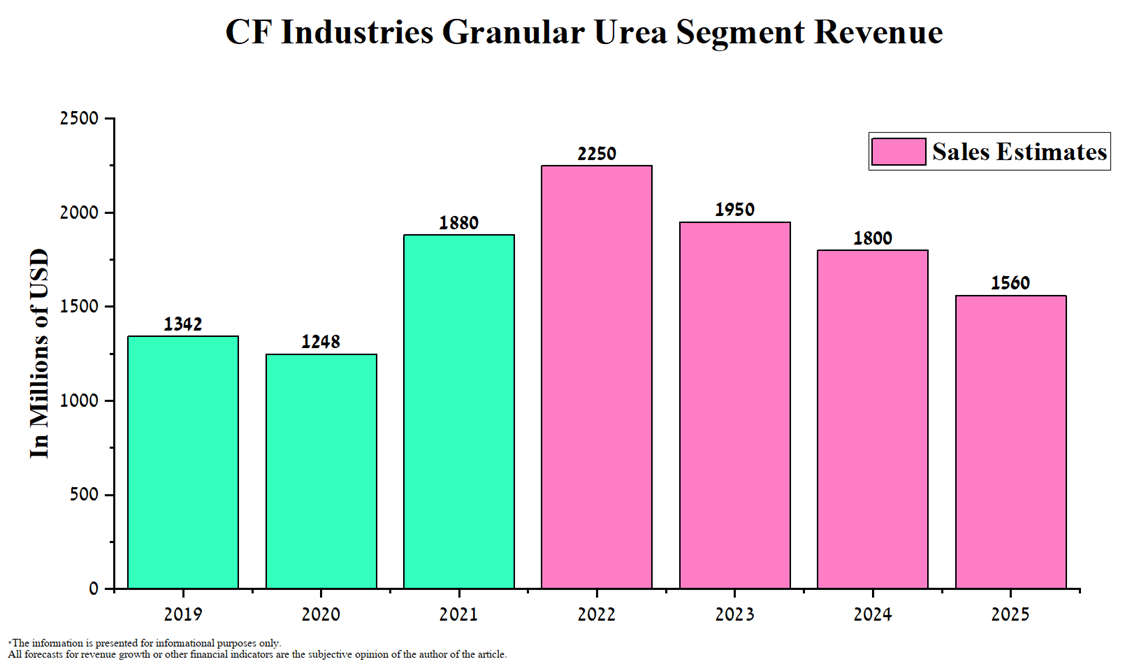
ICL Group’s Key Segment is Phosphate Solutions
ICL Group is a world leader in the production of phosphate products for the agricultural and industrial markets.
Source: Form 20-F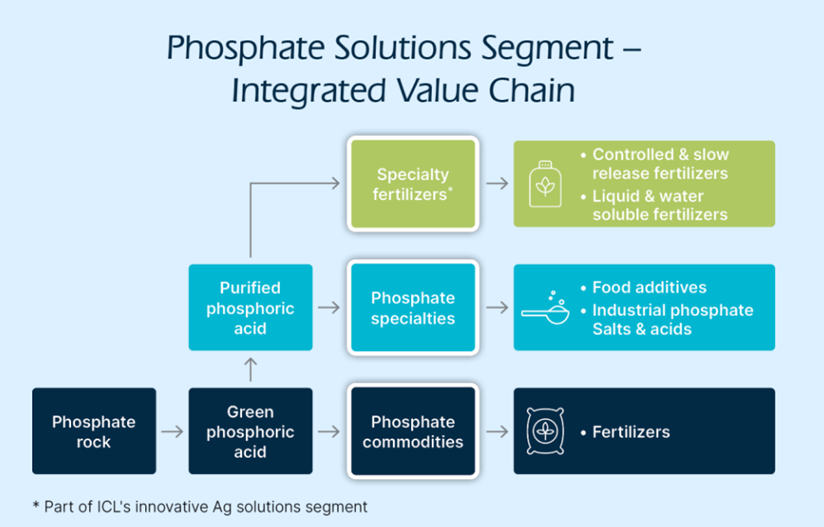
The share of the phosphate solutions segment is 31.6% of the company’s total revenue, which is 3.6% more than in the previous quarter. In my estimation, this indicator will continue to rise in the coming quarters due to increased demand for phosphate rock from the automotive industry and the expansion of the agricultural product range with liquid fertilizers and controlled release fertilizers.
Source: Created by author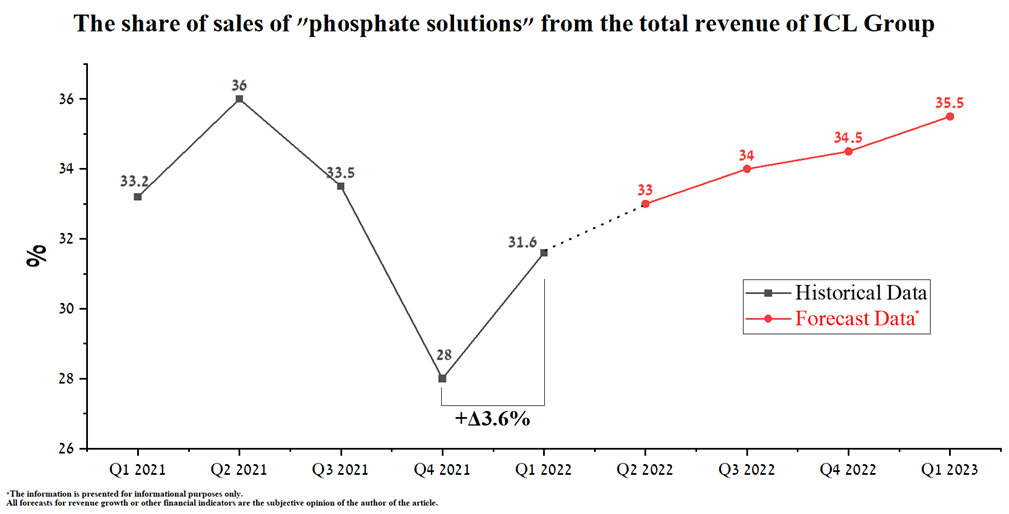
The segment’s revenue was $798 million in Q1 2022, up 39.8% quarter-on-quarter. In addition, thanks to continued high commodity prices, the EBITDA margin continues to improve quarter-on-quarter to around 31%, helping to increase investment in next-generation fertilizer development.
Source: Author’s elaboration, based on quarterly securities reports
In my opinion, two main prerequisites will help maintain the pace of growth in revenue and net income in this segment in the coming years.
Rising prices for fertilizers
Since 2020, there has been a significant increase in prices for potash, phosphate, and nitrogen fertilizers. This is mainly due to the non-stop growth of inflation in most countries of the world and the military conflict in Eastern Europe, which led to the introduction of sanctions against Russian and Belarusian companies. According to the World Bank, the average price of phosphate rock reached $264 per ton in Q2 2022, up 51% QoQ.
Source: The World Bank Group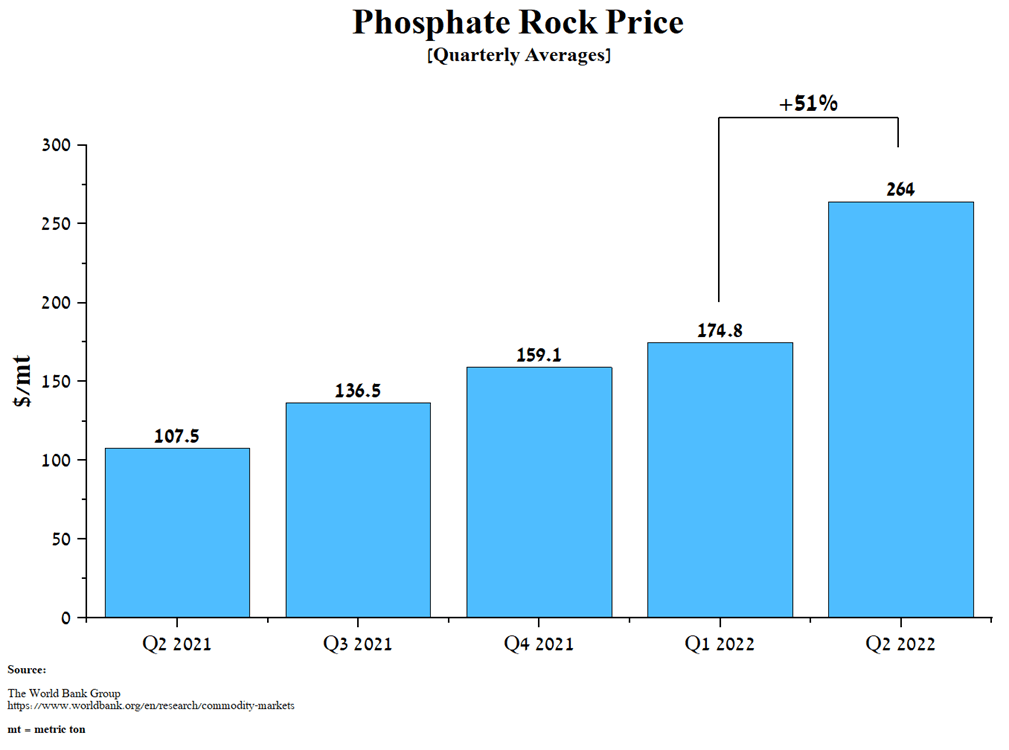
Despite the slowdown in the global economy, which increases the risk of a recession, and the efforts of the governments of the United States, Japan, and European countries to curb inflation, the prices for these raw materials continue to grow from month to month. The average price for phosphate rock was $287.5 per ton in June, up 12.7% from the previous month.
Source: The World Bank Group
In my estimation, the rise in prices for this raw material will continue in the coming months also due to an increase in demand for phosphates from electric car manufacturers.
Booming demand for electric vehicles
Electric vehicle sales reached a new record of 6.6 million units, up 115% from the previous year. Based on historical data, there has been an exponential increase in sales since 2011, when only 60,000 electric vehicles were sold worldwide. According to the International Energy Agency, 2 million vehicles were sold in Q1 2022, up 75% from Q1 2021.
Source: Author’s elaboration, based on IEA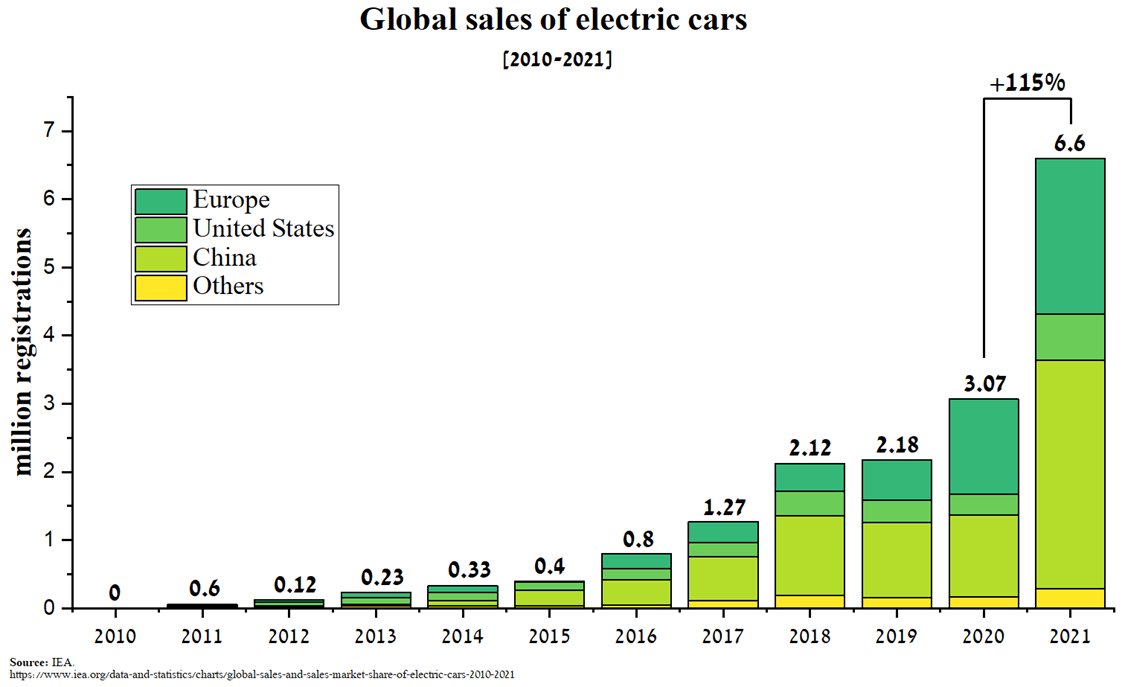
China is the largest contributor to the development of the global electric vehicle industry, with 3.35 million units sold in 2021, up 179.2% from the previous year. This trend mainly reflects the rapid deployment of charging infrastructure and China’s favorable policy toward this industry. One of the key parts of electric vehicles is the battery, around which a lot of scientific work is being done to improve its design and chemical composition necessary to increase the driving range, service life, and reduce recharging time. The main defining characteristic of batteries is the chemical composition of their cathodes, which is a major contributor to the performance of electric vehicles. At the moment, there are three main categories of cathode chemistry – NMC, NCA, which contain nickel oxide in their composition and the third category is lithium iron phosphate (LFP) cathodes, which are produced using phosphate rock. Over the past two years, there has been a surge in demand for LFP batteries due to their long life, relatively low cost, and low fire risk. As a result, the share of LFP was about 15% in 2021, doubling compared to 2020.
Source: IEA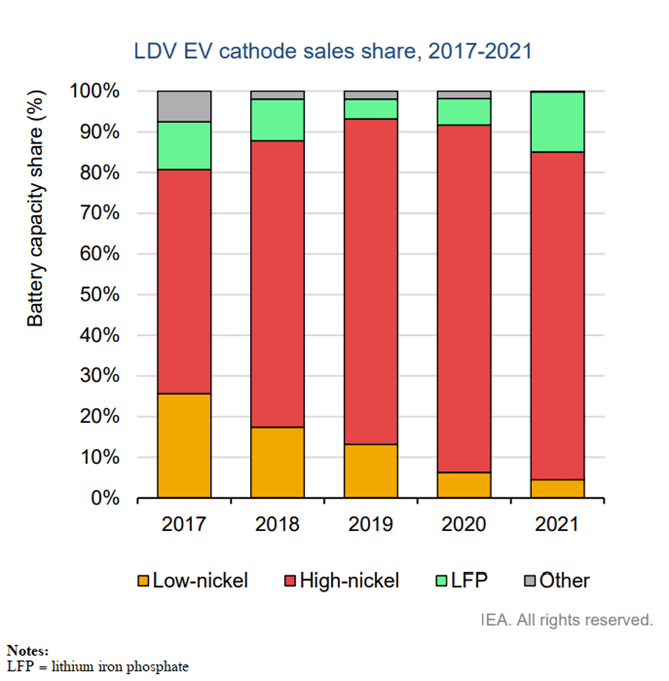
Given the high prices of cobalt and nickel, as well as improvements in cell-to-pack technology, there is a growing interest in this type of battery in the production of light vehicles. Recently, Tesla (TSLA) and Volkswagen (OTCPK:VLKAF) (OTCPK:VWAGY) announced the transition to lithium iron phosphate batteries for high-volume entry-level electric cars. So in a Q1 2022 earnings call, Andrew Baglino, a senior vice president at Tesla, said that about half of all vehicles produced use LFP batteries.
“Yes. I mean, I’ll take the LFP question. Like, it says so in our letter, like half of our products were LFP last quarter, which shows how quickly we were able to respond to — well, honestly, it wasn’t because of a raw material shortage, but just because it seemed like the right thing to do, we could change our cathode chemistry. And there’s more to be done on the cathode side. And we are actively pursuing it to give us substitution flexibility in response to market conditions between the other cathodes that are out there that can be competitive in our vehicles, which there are many options.”
According to the forecast of the IEA and taking into account the baseline scenario, the use of LFP batteries will increase from 15% to 30% by 2030, however, if the period of high prices for cobalt and nickel continues, then the share of lithium-iron-phosphate batteries could increase to 60%, which will significantly increase demand for phosphate rock mined by ICL Group.
Source: IEA
Already in the 1st quarter of 2022, ICL Group noted that the joint venture with YTH in China is experiencing a growing demand for monoammonium phosphate for the production of lithium iron phosphate batteries, and thus this only confirms the increase in interest in this area. Moreover, on July 7, 2022, ICL signed an agreement with Aleeees to produce 30,000 metric tons of cathode materials for LFP batteries, and this volume will increase over time. Thus, taking into account the increase in demand for phosphate rock, the trend of increasing production volumes and prices for raw materials, I expect the next revenue of ICL Group’s phosphate solutions segment until 2025.
Source: Created by author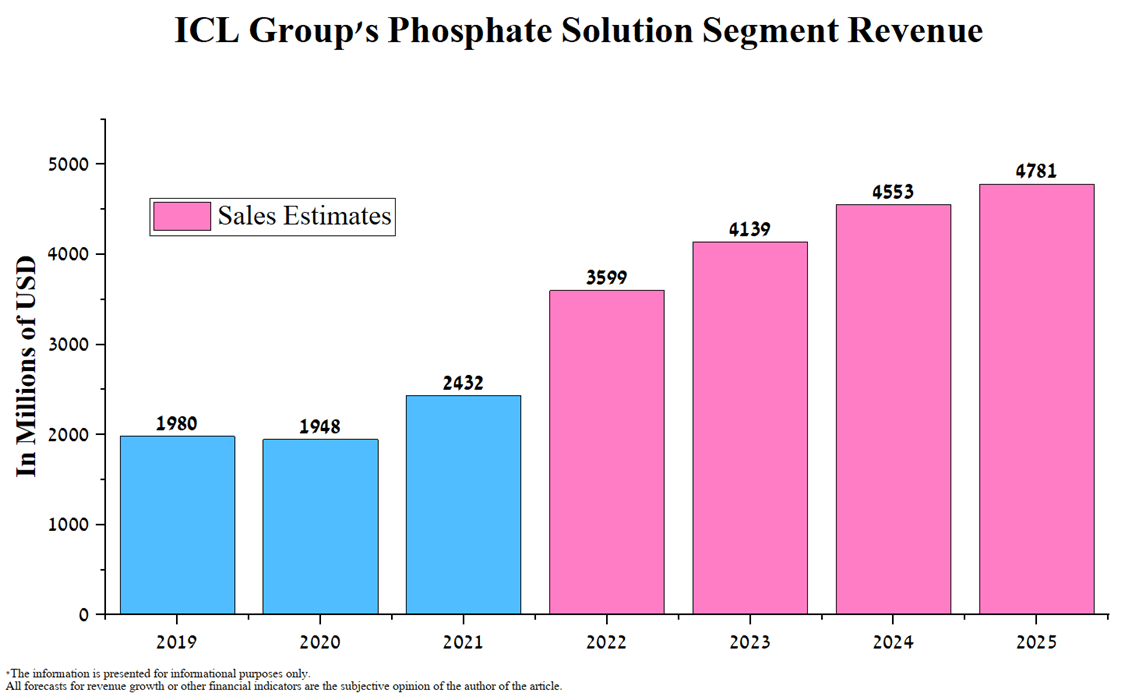
Technical analysis of CF Industries and ICL Group
On the weekly timeframe, you can see the continuation of the corrective movement both in the shares of ICL Group and in the shares of CF Industries, which is confirmed by the theory of Elliott waves. The cycles predict that impulse wave ⑤ on the ICL Group chart and representing the ending diagonal was completed by the formation of a bearish divergence RSI, which is a strong pattern confirming the end of the bullish cycle that began in mid-March 2020. At the moment, wave (‘A’) of the “Running Flat” correction pattern has been completed, which corrected the company’s shares by 40.3% from the maximum. In my estimation, the full completion of this pattern will occur in the 3rd quarter of 2022, after which ICL Group shares will begin upward movements towards the target price of $18 per share noted in my previous article.
Source: N_Aisenstadt – TradingView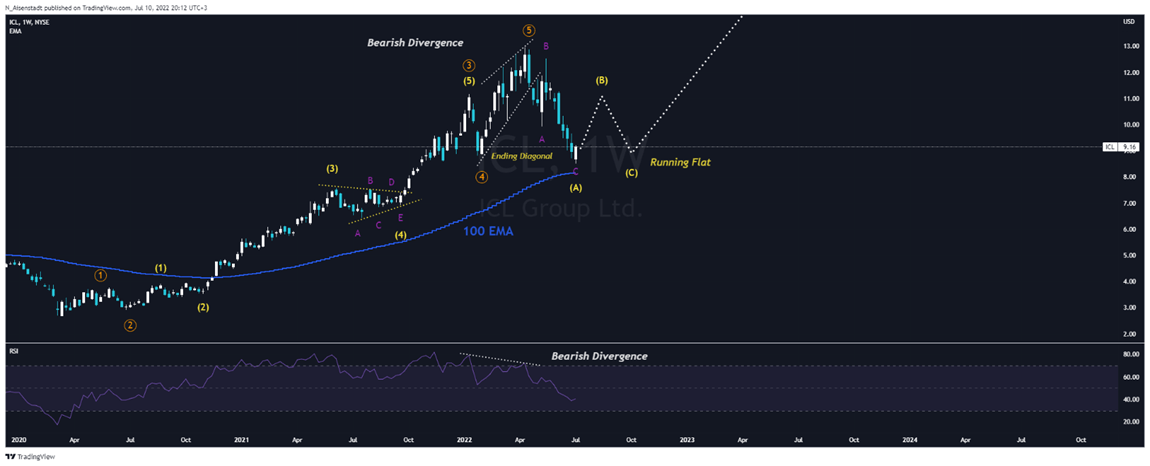
Even though the chart of CF Industries is similar to that of ICL Group, however, taking into account the development of wave (‘A’), which corrected the company’s shares by only 34% from the maximum values, I expect the formation of the “Expanded Flat” correction pattern. As a result, this will lead the company’s shares to a more serious correction to the range of $69-71 per share. After that, according to Elliott’s theory, the start of an impulse movement in CF Industries shares to a target price of $105 per share is expected.
Conclusion
ICL Group is one of the largest companies specializing in the extraction and production of minerals and chemicals, including phosphorus pentoxide, and potassium-containing fertilizers. While CF Industries is the world leader in the production of nitrogen-containing fertilizers,including controlling about 40% of the entire production capacity of urea in the US and Canada. Both companies have a rising net income, EBITDA, and low leverage, making ICL Group and CF Industries a long-term investment to consider. However, with faster growth in dividend payouts, growing demand for phosphate solutions from the EV industry, and rising commodity prices, I believe that ICL Group is more promising in the long term and more likely to double the capitalization relative to CF Industries.
Be the first to comment