

New Zealand Dollar Talking Points
NZD/USD attempts to retrace the decline following the emergency rate cut from the Reserve Bank of New Zealand (RBNZ), but the exchange rate may continue to carve a series of lower highs and lows as the Relative Strength Index (RSI) sits in oversold territory.
NZD/USD Outlook Clouded with Mixed Signals Following RBNZ Rate Cut
NZD/USD traded a to a fresh yearly low (0.5985) as the RBNZ reduced the official cash rate (OCR) by 75bp to a fresh record low of 0.25%, and the New Zealand Dollar may face additional headwinds ahead of the next central bank meeting on May 13 as Governor Adrian Orr and Co. appears to be on track to deploy non-standard measures.
It seems as though the RBNZ will resort to unconventional tools to combat the weakening outlook for global growth as the central bank insists that “a negative OCR would not be implemented,” and Governor Orr and Co. may announce a quantitative easing program over the coming months as “Large Scale Asset Purchases of New Zealand Government bonds were the next best monetary tool available to the Committee.”
The comments suggest the RBNZ will continue to push monetary policy into charted territory even though Prime Minister Jacinda Ardern prepares as “significant” fiscal stimulus package as “the slowdown in the global economy would act as a serious headwind for the New Zealand economy.”
In turn, the New Zealand Dollar may face a more bearish fate as the RBNZ endorses a dovish forward guidance, and NZD/USD may continue to carve a series of lower highs and lows over the coming days as the Relative Strength Index (RSI) sits in oversold territory.

Recommended by David Song
Forex for Beginners
Sign up and join DailyFX Currency Strategist David Song LIVE for an opportunity to discuss potential trade setups.
NZD/USD Rate Daily Chart
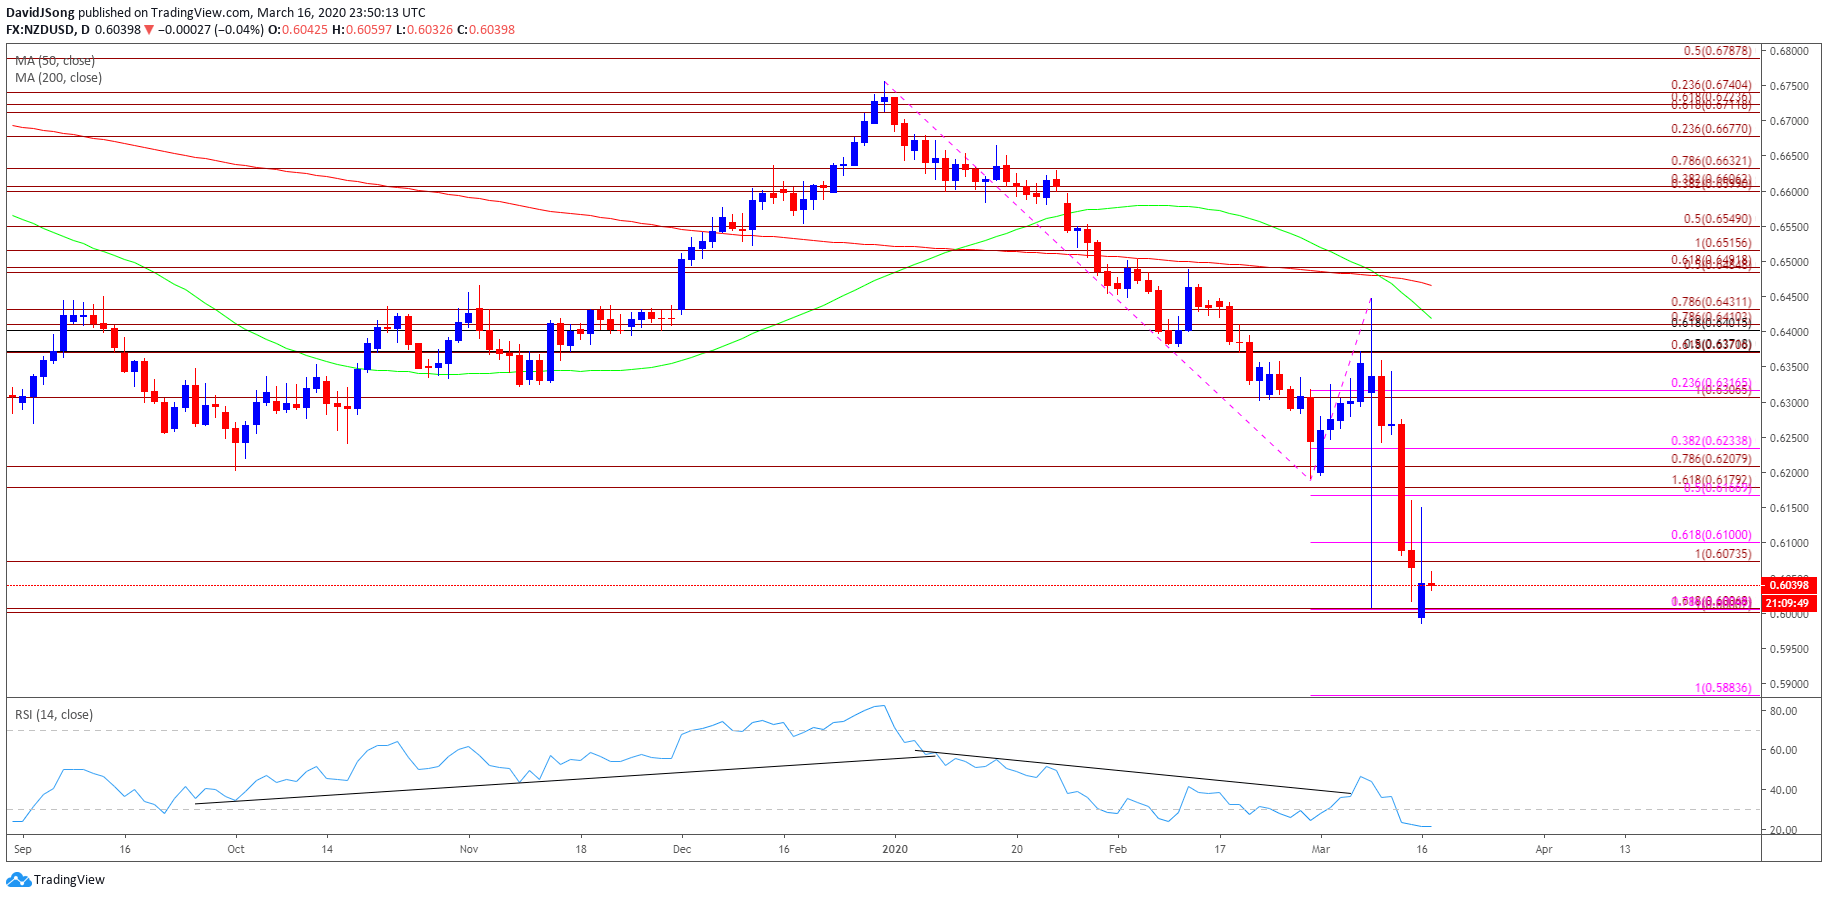
Source: Trading View
- Keep in mind, NZD/USD has failed to retain the range from the second half of 2019 as the decline from earlier this year produced a break of the October low (0.6204), with a ‘death cross’ taking shape in March as the 50-Day SMA (0.6420) crosses below the 200-Day SMA (0.6466).
- Recent developments in the Relative Strength Index (RSI) suggest the bearish momentum will persist as the oscillator holds below 30 and sits in oversold territory.
- Need a break/close below the 0.6000 (100% expansion) to 0.6010 (161.8% expansion) region to open up the 0.5880 (100% expansion) area.
- However, the string of failed attempts to break/close below the 0.6000 (100% expansion) to 0.6010 (161.8% expansion) region may generate range bound conditions, with a move above the Fibonacci overlap around 0.6070 (100% expansion) to 0.6100 (61.8% expansion) bringing the 0.6170 (50% expansion) to 0.6180 (161.8% expansion) area on the radar.

Recommended by David Song
Traits of Successful Traders
— Written by David Song, Currency Strategist
Follow me on Twitter at @DavidJSong
Be the first to comment