

Sergei Dubrovskii
Cenovus Energy’s (NYSE:CVE) stock price increased by 20% in the past month as the energy market outlook remains strong. The company’s 3Q 2022 financial results were stronger than in 3Q 2021; however, not as strong as the 2Q 2022 results. CVE has been able to decrease its net debt in the past quarters and has improved its financial health. Due to higher household energy consumption as a result of colder temperatures, OPEC+ production cut, and the continuing war in Ukraine, energy prices will remain high for the rest of 2022. Cenovus will benefit from the market condition in the following quarters. The stock is a buy.
Quarterly results
In its 3Q 2022 financial results, CVE reported total revenues of $17471 million, compared with 2Q 2022 total revenues of $19165 million, driven by decreased upstream and downstream revenues. The company’s upstream and downstream operating margins decreased by 26% QoQ to $2849 million and 42% QoQ to $490 million, respectively. CVE’s adjusted fund flow decreased from $3098 million, or $1.53 per diluted share in 2Q 2022 to $2951 million, or $1.49 per diluted share in 3Q 2022. Its net earnings decreased by 34% QoQ to $1609 million in the third quarter of 2022. CVE’s total capital investment increased from $822 million in 2Q 2022 to $866 million in 3Q 2022. We can see that the company’s financial results in 3Q 2022 are not as strong as in 2Q 2022. However, compared with 3Q 2021, CVE’s results in the third quarter of 2022 have significantly improved. In 3Q 2022, the total revenues and total operating margin of CVE increased by 38% YoY and 23% YoY, respectively. Also, the company’s adjusted funds flow and net earnings in the third quarter of 2023, increased by 26% YoY and 192% YoY, respectively.
Cenovus Energy’s free funds flow decreased from $2276 million on 30 June 2022 to $2085 million on 30 September 2022. The company’s net debt decreased from $7535 million on 30 June 2022 to $5280 million on 30 September 2022. CVE reported net debt to adjusted funds flow of 0.5 at the end of 3Q 2022, compared with 0.8 at the end of 2Q 2022 and 1.0 at the end of 3Q 2022. As of 30 September 2022, the company’s net debt to adjusted funds flow and net debt to adjusted EBITDA decreased by 75% YoY and 76%, respectively.
The market outlook
CVE’s total liquids production volume increased from 614.2 Mbbls/d in 2Q 2022 to 633.1 Mbbls/d in 3Q 2022, driven by increased oil sands production, partially offset by lower conventional and offshore production. On the other hand, its total conventional natural gas production volume decreased from 882.2 MMcf/d in 2Q 2022 to 868.7 MMcf/d in 3Q 2022. The company’s total production volume increased from 761.5 MBOE/d in 2Q 2022 to 777.9 MBOE/d in 3Q 2022. In the upstream segment, CVE’s total operations sales price decreased from $114.40/BOE in 2Q 2022 to $83.43/BOE in 3Q 2022. Its total operations netback decreased from $71.09/BOE in 2Q 2022 to $42.14/BOE in 3Q 2022. CVE’s total downstream production increased from 477.1 Mbbls/d in 2Q 2022 to 567.0 Mbbls/d in 3Q 2022, driven by higher production in the United States and Canada. Figure 1 shows that CVE operates in Canada, the United States (refineries production), and the Asia Pacific region (offshore production).
Figure 1 – CVE’s portfolio
2Q 2022 presentation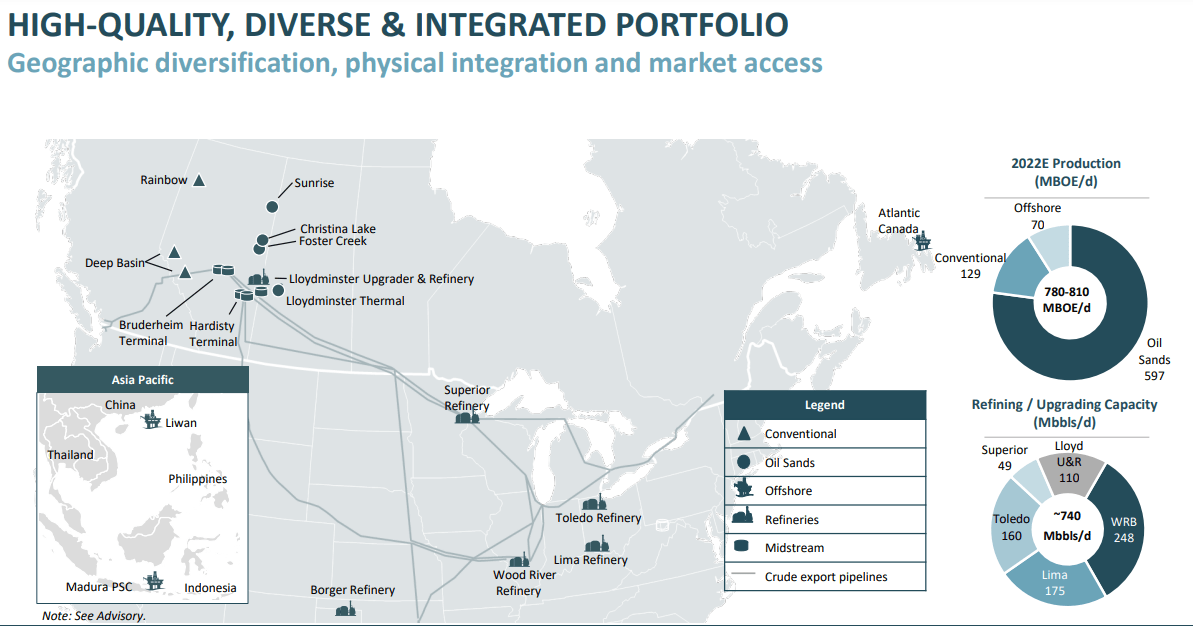
According to International Energy Agency (IEA), due to higher prices as a result of the OPEC+ production cut plan and economic recession, world oil demand is slowing. World oil demand is expected to be 101.3 million barrels per day (mb/d) in 2023. World oil supply increased by 2.1 mb/d QoQ in 3Q 2022; however, it is expected to decrease slightly in the fourth quarter of 2022 as OPEC+ will cut its production by 2 mb/d from November. Thus, oil prices will remain high and may increase further soon. Also, as a result of the EU decision to ban Russian crude oil which will start in two months, I expect European countries’ oil imports from the United States and Canada to increase in the following months.
Furthermore, Energy Information Administration (EIA) expects that world petroleum and other liquids production and consumption to increase in 2023 (see Figure 2). Total world petroleum and other liquids production and consumption in all of the quarters of 2023 are expected to exceed 100 million barrels per day. U.S. petroleum and other liquids production was 20.12 mb/d in 2Q 2022 and 20.36 mb/d in 3Q 2023. It is expected to increase to 20.72 mb/d in 4Q 2022, 20.93 mb/d in 1Q 2023, and more than 21 mb/d in 2Q-4Q 2023. U.S. petroleum and other liquids consumption are expected to increase from 20.35 mb/d in 2022 to 20.54 mb/d in 2023. Canada’s petroleum and other liquids production was 5.53 mb/d in 2Q 2022 and 5.72 mb/d in 3Q 2023. It is expected to increase to 5.85 mb/d in 4Q 2022, 5.92. Canada’s petroleum and other liquids production will remain high in 2Q-4Q 2023. Canada’s petroleum and other liquids consumption is expected to increase from 20.35 mb/d in 2022 to 20.54 mb/d in 2023.
Figure 2 – International petroleum and other liquids production and consumption
eia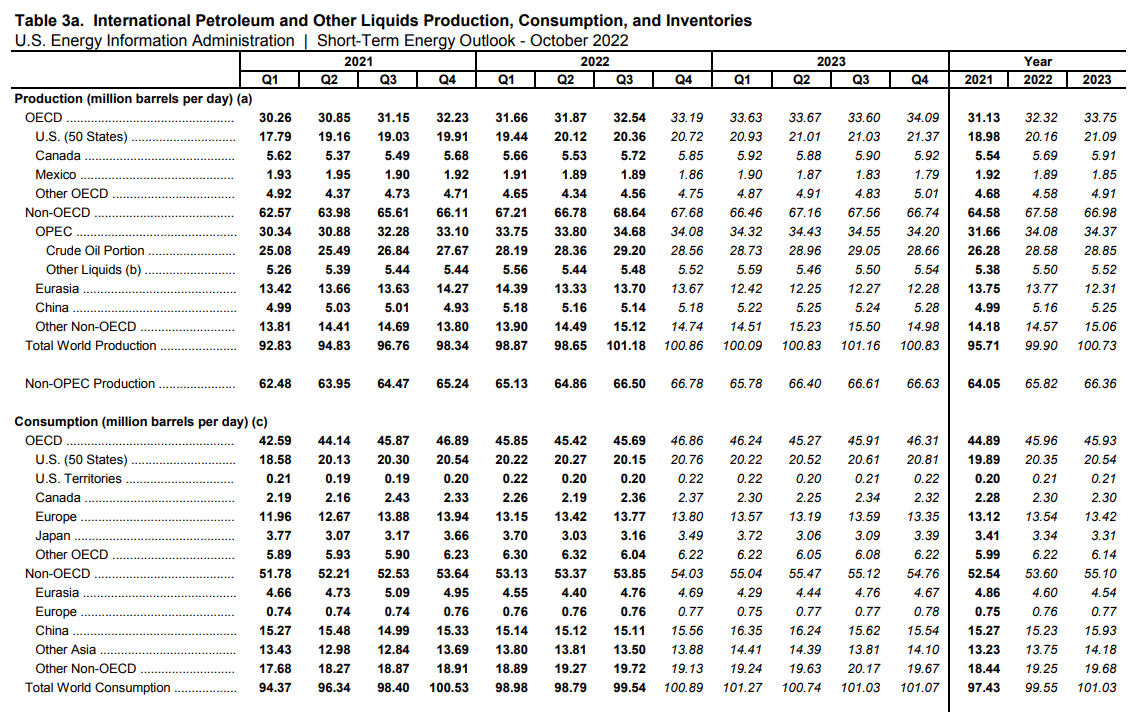
According to Figure 3, petroleum and other liquids consumption in Canada increased from 2.19 mb/d in 2Q 2022 to 2.36 mb/d in 3Q 2022 and is expected to increase to 2.37 mb/d in 4Q 2022. Also, in the United States, petroleum and other liquids consumption decreased from 20.27 mb/d in 2Q 2022 to 20.15 mb/d in 3Q 2022; however, it is expected to increase to 20.76 mb/d in 4Q 2022.
Figure 3 – Petroleum and other liquids consumption in North America
eia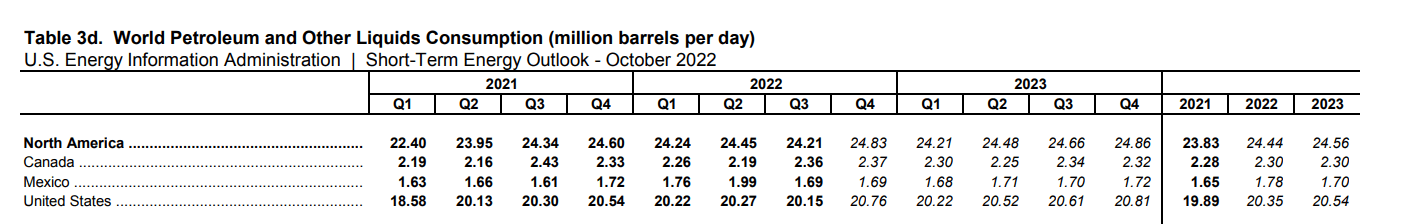
Total crude oil input to refineries in the United States increased from 16.09 mb/d in 2Q 2022 to 16.20 mb/d in 3Q 2022. It is expected to decrease to 15.73 mb/d in 4Q 2022. In the United States, gasoline price decreased from $376/b in 2Q 2022 to $311/b in 3Q 2022 and is expected to decrease further to $303/b in 4Q 2022. Also, diesel fuel and fuel oil prices decreased from 2Q 2022 to 3Q 2022 and will decrease further in 4Q 2022. However, it is important to know that gasoline, diesel fuel, and fuel oil prices will remain significantly higher than in 2021 (see Figure 4).
Figure 4 – Energy prices
eia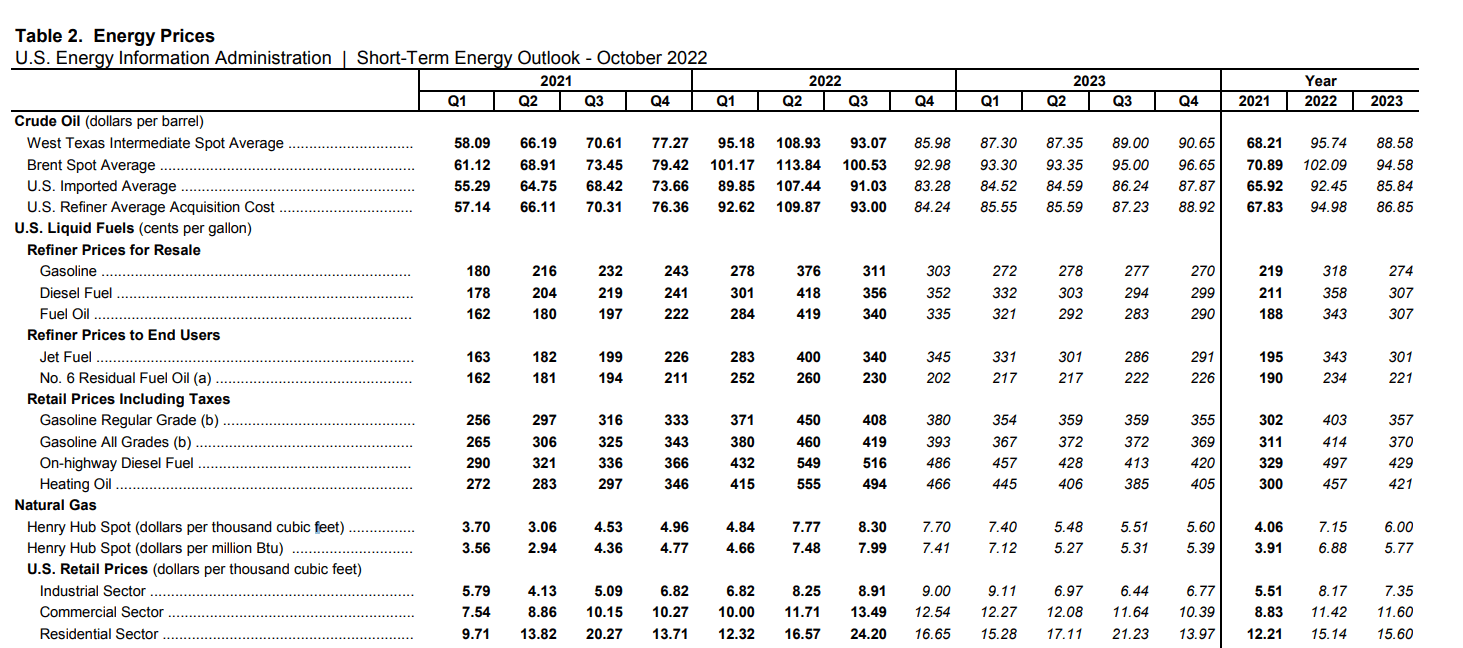
According to the production levels and prices of oil and refinery products, the global demand for North American oil, natural gas, and refinery products as a result of the EU import ban on Russian oil and energy crisis in Europe, and the increasing consumer expenditures for heating fuels during the winter season in the United States and Canada, CVE will make a significantly higher profit in the fourth quarter of 2022, compared with the same period last year. However, you should know that just like the third quarter, the company’s financial results in 4Q 2022 will not be as strong as in 2Q 2022.
Financial health
In this detailed analysis, I used some common leverage ratios that have significant comparability to its debt. The proportions are calculated in comparison with previous years to be more helpful.
The debt-to-assets ratio is one of the significant calculations that measure the company’s debt capacity. This ratio indicates the proportion of assets that are being financed with debt. The higher the ratio, the greater the degree of leverage and financial risks. CVE’s debt-to-asset ratio decreased from 0.29 at the end of 2021 to 0.21 on 30 September 2022. Moreover, CVE’s debt-to-EBITDA ratio, which determines the probability of defaulting on debt, decreased from 1.90 at the end of 2021 to 0.91 at the end of the third quarter of 2022. Finally, CVE’s asset-to-equity ratio decreased from 2.29 at the end of 2021 to 1.98 on 30 September 2022. The decreasing assets-to-equity ratio indicates that the company uses lower debt to finance its assets. As a result, the leverage ratios of Cenovus Energy depict the company’s solvency and its ability to meet its current and future obligations (see Figure 5).
Figure 5 – CVE’s leverage ratios
Author (based on SA data)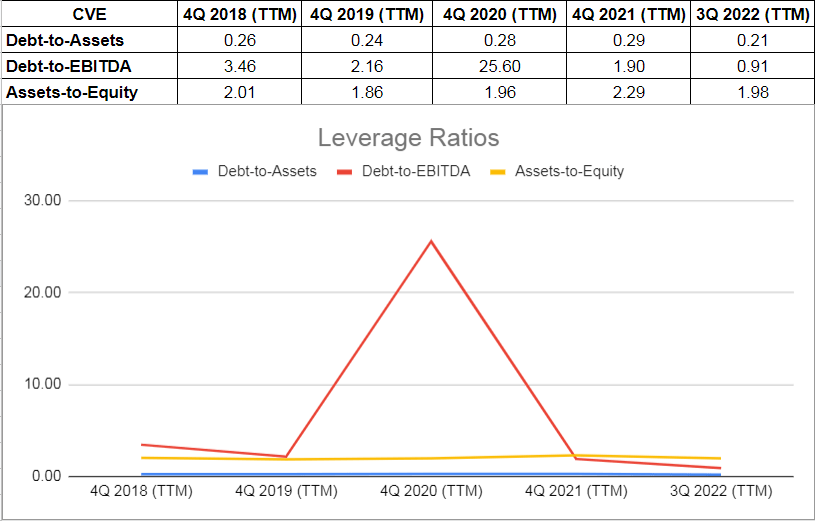
Summary
In terms of the market outlook, energy prices will remain high in the following quarters and CVE is well-positioned to benefit from the market condition. In terms of the financial results, the company’s results in 4Q 2022 will be significantly better than in 4Q 2021. I am bullish on the stock.
Be the first to comment