

Gerasimov174/iStock via Getty Images
Introduction
The start of 2022 was one of the best times in many years for oil companies, such as Cenovus Energy (NYSE:CVE) as their financial performance and share price surged along with oil prices. Although sadly, as a cyclical company, the good times never last forever and thus as my previous article explained, it was time to start looking for an exit. Despite the subsequent bumpy road, as it stands right now, their share price recently rallied and in my eyes, this is the best it gets and thus as discussed within this follow-up analysis, it is now time to sell and lock in those profits.
Coverage Summary & Ratings
Since many readers are likely short on time, the table below provides a brief summary and ratings for the primary criteria assessed. If interested, this Google Document provides information regarding my rating system and importantly, links to my library of equivalent analyses that share a comparable approach to enhance cross-investment comparability.
Author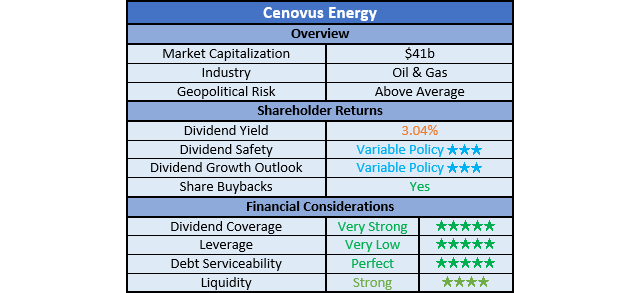
Detailed Analysis
Author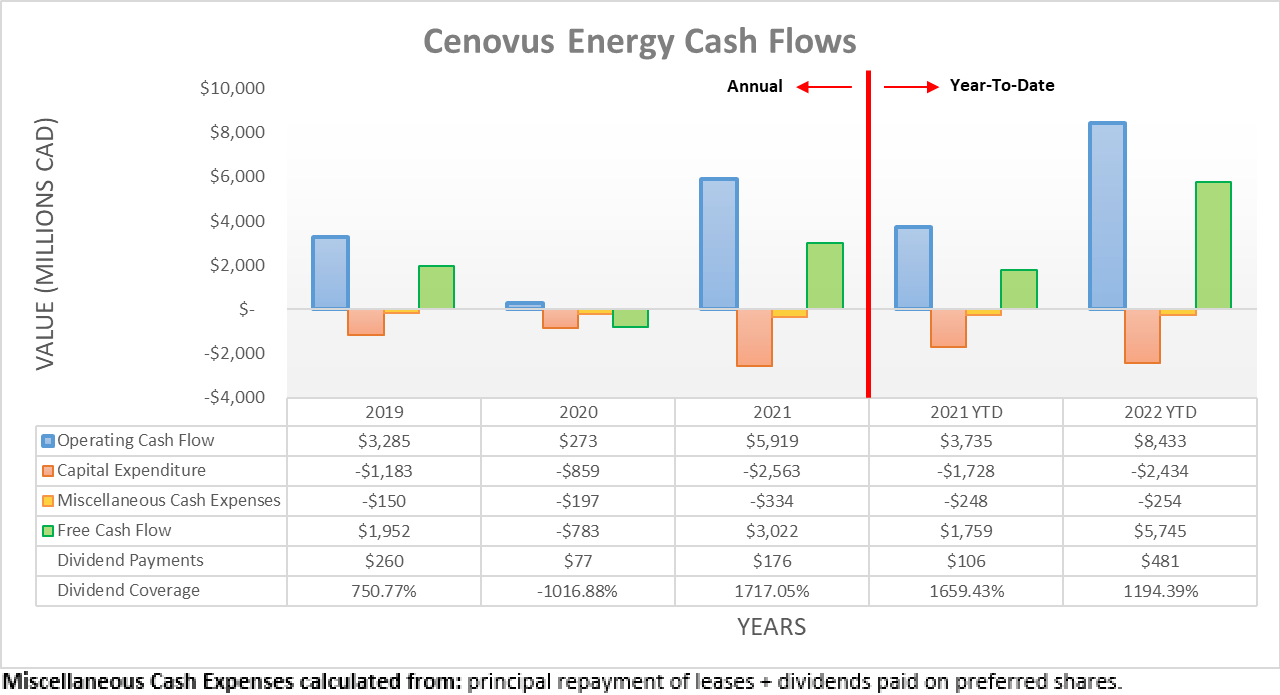
After enjoying a very strong start to 2022 during the first quarter, unsurprisingly, the booming oil prices during the second and third quarters supercharged their cash flow performance. This saw their operating cash flow climbing to C$8.433b during the first nine months, thereby representing an acceleration versus the first quarter that only saw C$1.365b. Apart from this sequential boost, it obviously represents a massive increase of more than 100% increase year-on-year versus their previous result of C$3.735b during the first nine months of 2021.
Author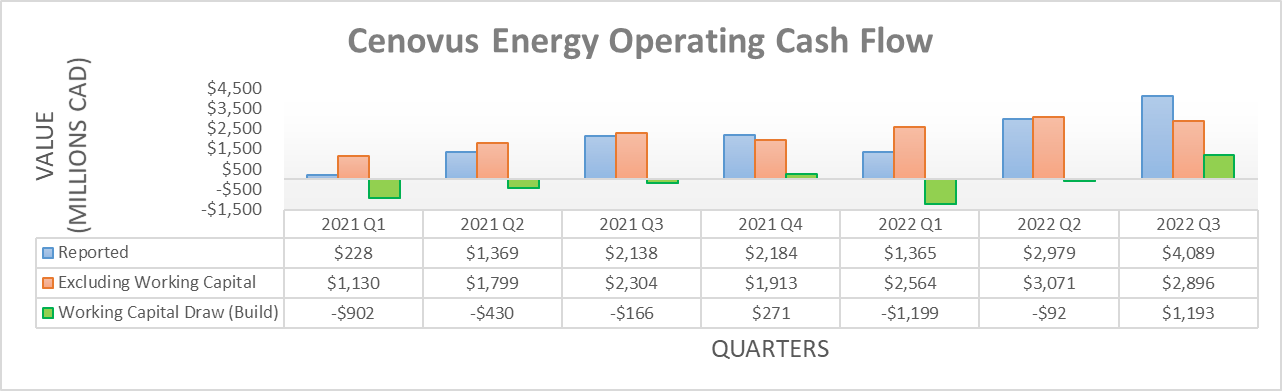
If viewed at the quarterly level, it can be seen the third quarter of 2022 represented the highest operating cash flow thus far with a result of C$4.089b. Although, this was helped by a working capital draw of C$1.193b, which was effectively their build of C$1.199b during the first quarter reversing. If viewing their underlying results that exclude such movements, their result of C$2.896b was slightly lower than the second quarter of C$3.071b. As oil prices softened below their triple-digit levels during the third quarter, this is not surprising but thankfully, they remain very strong around circa $90 per barrel. When all is said and done, their free cash flow ultimately landed at C$5.745b during the first nine months, which is a truly impressive feat.
This massive cash windfall is very positive and transformed their balance sheet, which as subsequently discussed opens the door for shareholders to receive the entirety of their free cash flow via dividends and share buybacks, although the future outlook is far more important. In the short-term, share prices tend to be driven by catalysts, whereas in the long-term, returns are driven by acquiring shares that offer desirable value.
On the latter point, it is difficult to see desirable value in their shares after their strong rally during the past twelve months, unless of course, these booming oil prices persist but in my eyes, such an assumption is not realistic given the cyclical nature of the oil industry. In my eyes, a desirable investment still stacks up even with only a middle-of-the-road scenario, which in the case of the oil industry, I feel is suitably represented by 2021 because the weakness at the start of the year was counteracted by the strength at the end. At the moment, their market capitalization is approximately $41b and thus if compared against their free cash flow of C$3.022b during 2021, it only sees a modest free cash flow yield of circa 5.5%, given the current CAD to USD exchange rate of $0.74. Despite not being terrible, this is also not particularly desirable and thus as a result, the appeal of their shares is too reliant upon these very strong oil prices.
It should be remembered this does not represent a crash nor a severe downturn, merely it sees a revision back to overall decent operating conditions. Whilst yes, the observant reader may point out they merged with Husky Energy following the first quarter of 2021, thereby seeing only three-quarters of contributions instead of the full-year contributions they see going forwards. Although, the difference would be immaterial because the first quarter only saw weak oil prices with Western Texas Intermediate starting at a mere circa $50 per barrel, before subsequently climbing throughout the last three quarters to make for a strong end to the year.
Since their shares do not offer desirable value from a medium to long-term perspective, it leaves the appeal of their shares resting upon the outlook for any catalysts in the short-term that could provide a boost or alternatively, give cause for a sell-off. During the half year after my previous analysis, the outlook for economic conditions deteriorated even further as inflation proves more persistent than hoped, which in turn, sees central banks tighten monetary policy more rapidly than feared.
Whilst there are many moving parts to the economy and uncertainties, realistically, the question of a recession is moving further and further towards when, not if and thus as a result, it is difficult to make a compelling bullish case for 2023 and possibly even 2024. Even if the upcoming European sanctions on Russian seaborne oil exports and possible easing of the zero-Covid-19 policy in China help support oil prices, the economic conditions are still going to pose a very strong headwind that makes even higher prices difficult to see during 2023. Since lower prices would hinder their financial performance and thus shareholder returns given their variable policy, it means on the economic front, there does not appear much scope for positive catalysts, if anything, the risks are far more heavily weighted towards the downside.
Author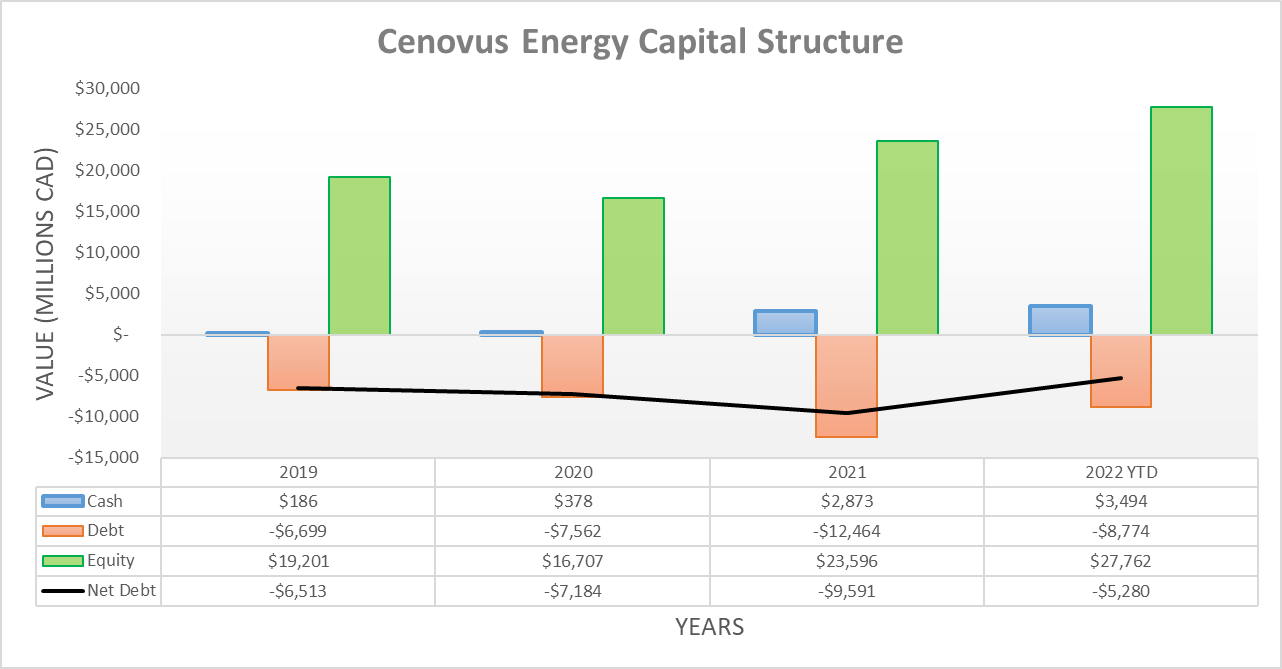
When conducting the previous analysis following the first quarter of 2021, their net debt was C$8.407b and thanks to their very strong cash flow performance continuing, this is now significantly lower at C$5.28b following the third quarter. Apart from being the lowest point in recent history even before their debt-laden acquisition of Husky Energy in 2021, it is also on the cusp of reaching their target of C$4b around the end of 2022, as per the commentary from management included below.
Overall, we’ve posted another solid quarter highlighted by strong operational results and substantial further deleveraging towards our $4 billion net debt floor. At current strip, we expect to reach that level around the end of this year. We look forward to delivering 100% of excess free funds flow to our shareholders for periods when we’re at that level.”
– Cenovus Energy Q3 2022 Conference Call.
Upon reaching this point, shareholders will begin receiving the entirety of their free cash flow returned via dividends and share buybacks, as alluded to earlier. Even though this has not eventuated, given the very short wait and near certainty that it will be reached, such an outcome should already be priced into their shares, thereby meaning its completion does not represent a future positive catalyst to drive their share price higher, at least not in my view.
Author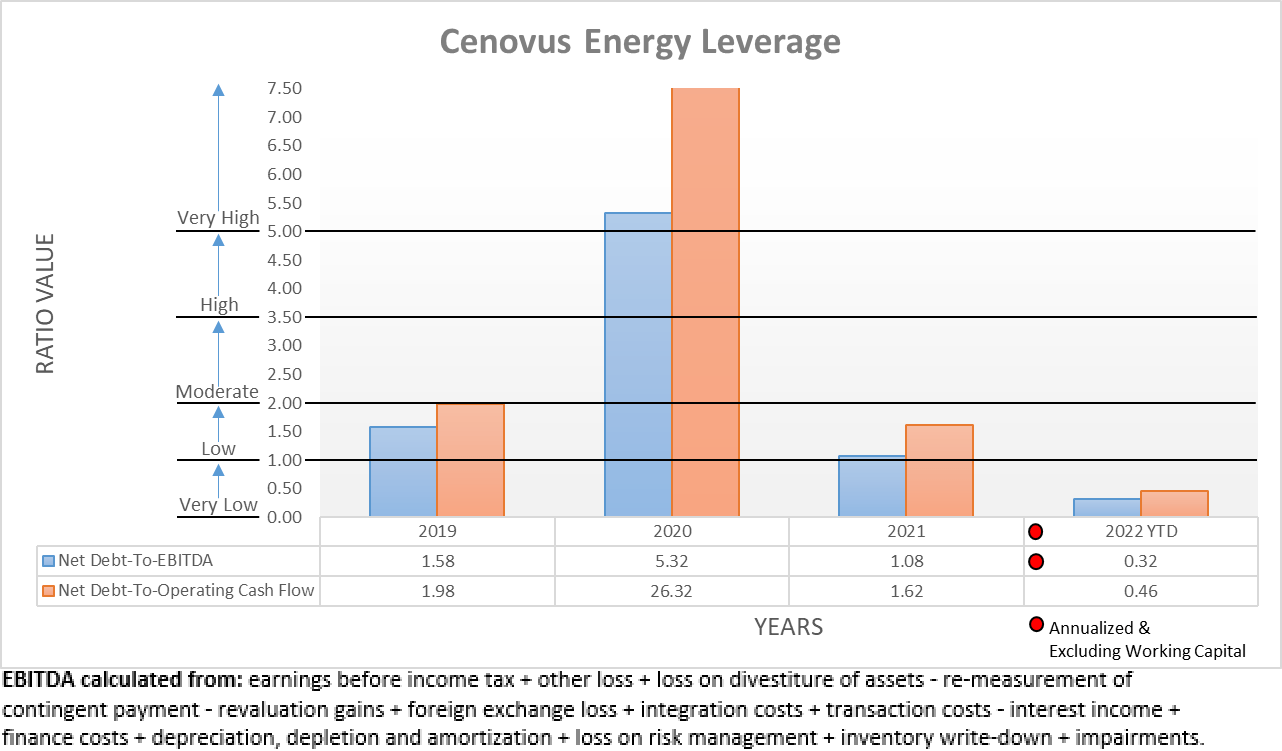
Quite unsurprisingly, their significantly lower net debt following the first and second quarters of 2022 continues to send their leverage plunging even further beneath the threshold of 1.00 for the very low territory. As a result, their net debt-to-EBITDA decreased to only a mere 0.32 versus their result of 0.50 when conducting the previous analysis, which is similarly shared by their net debt-to-operating cash flow that decreased to 0.46 versus 0.82 across these same two points in time. Even though softer operating conditions would still inhibit their shareholder returns, at least their financial position is now sitting in the best position in many years to navigate any future turbulence.
Author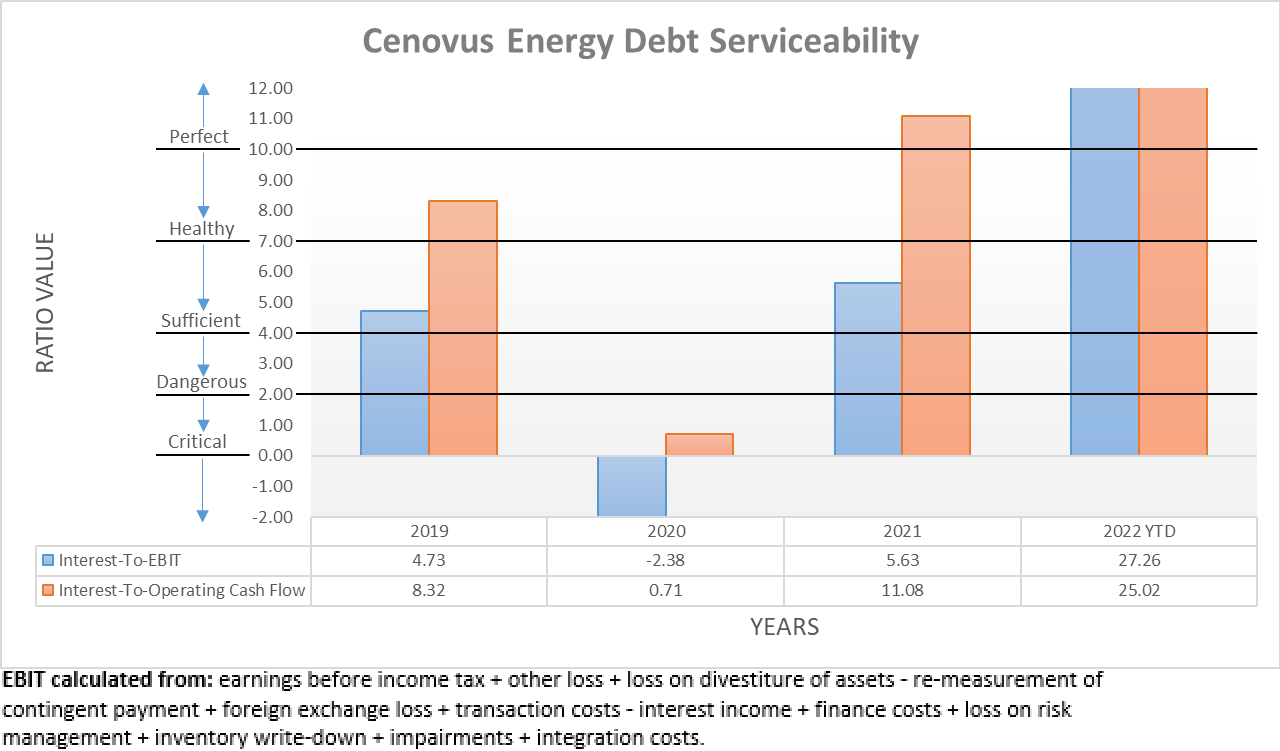
Apart from pushing their leverage even lower, their significantly lower net debt also helps enhance their debt serviceability, which is becoming increasingly important to consider as interest rates climb rapidly. Regardless of whether comparing their interest expense against their accrual-based EBIT or cash-based operating cash flow, their respective results of 27.26 and 25.02 are both perfect. Once again similar to their leverage, this further strengthens their ability to navigate whatever the future may hold, which is particularly helpful heading into uncertain times that are also accompanied by rapidly rising interest rates.
Author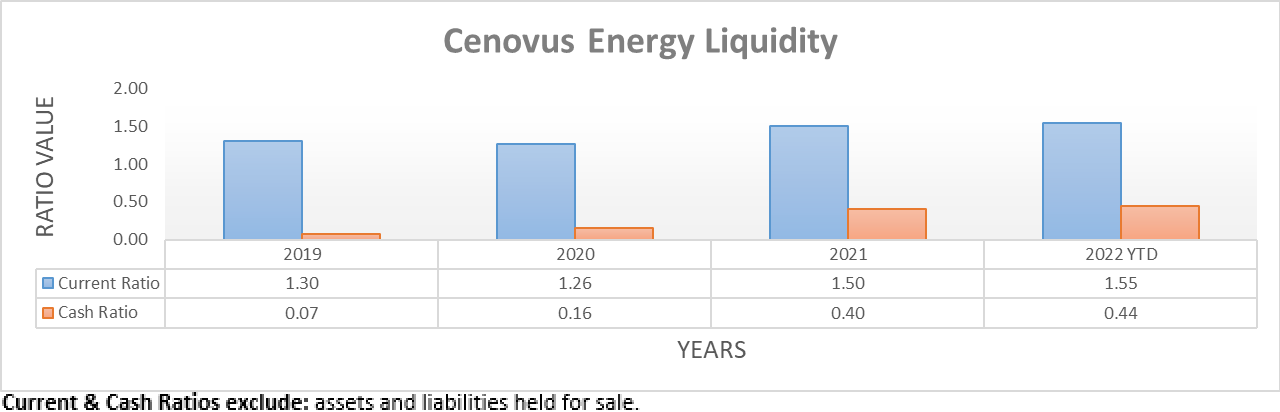
Following the analysis thus far, it was no surprise to see their strong liquidity persist during the second and third quarters of 2022 with their respective current and cash ratios of 1.55 and 0.44 very close to their results of 1.56 and 0.38 when conducting the previous analysis. Thanks to significantly reducing their net debt, it also comparably reduces their future need for debt refinancing. Apart from providing a shield from higher interest rates, it also lessens the medium to long-term threat of the ESG concerns surrounding their oil sands exposure, which see various financial institutions unwilling to extend credit regardless of their business merits.
Conclusion
Despite being poised to open a new chapter with maximized shareholder returns upon reaching their net debt target around the end of 2022, the appeal of their shares is too reliant upon these very strong oil prices. Whilst the future is obviously uncertain, I nevertheless suspect now is the best it gets with the economic outlook getting increasingly gloomy and thus I believe that downgrading to a sell rating is now appropriate. Apart from this being more likely to provide a negative catalyst for their share price to sell off rather than a rally. Even at the company level, they have effectively reached their full potential for shareholder returns and deleveraging, thereby leaving no catalysts in sight to drive a higher share price.
Notes: Unless specified otherwise, all figures in this article were taken from Cenovus Energy’s Quarterly Reports, all calculated figures were performed by the author.
Be the first to comment