

Darren415
This article was first released to Systematic Income subscribers and free trials on Sep. 18.
Welcome to another installment of our CEF Market Weekly Review where we discuss closed-end fund (“CEF”) market activity from both the bottom-up – highlighting individual fund news and events – as well as top-down – providing an overview of the broader market. We also try to provide some historical context as well as the relevant themes that look to be driving markets or that investors ought to be mindful of.
This update covers the period through the third week of September. Be sure to check out our other weekly updates covering the BDC as well as the preferreds/baby bond markets for perspectives across the broader income space.
Market Action
It was another difficult week for the CEF space as an upside surprise in inflation pushed nearly all income assets lower. All CEF sectors saw lower NAVs and most saw wider discounts as well. On a month-to-date basis all sectors show negative total returns with Munis leading the way to the downside given the recent reversal in Treasury yields.
Systematic Income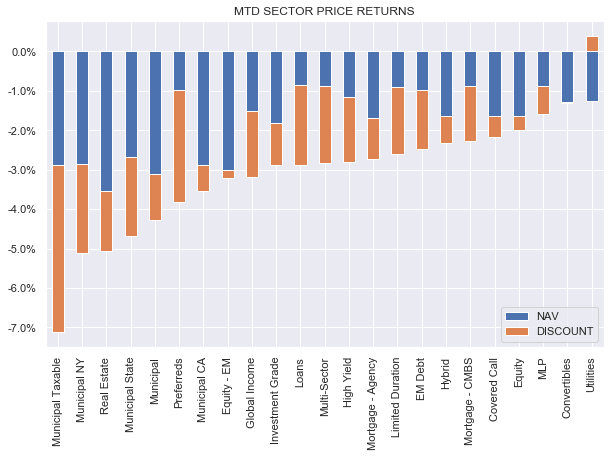
September is so far shaping up to be worse than August. The two months together have mostly offset the rally we saw in July.
Systematic Income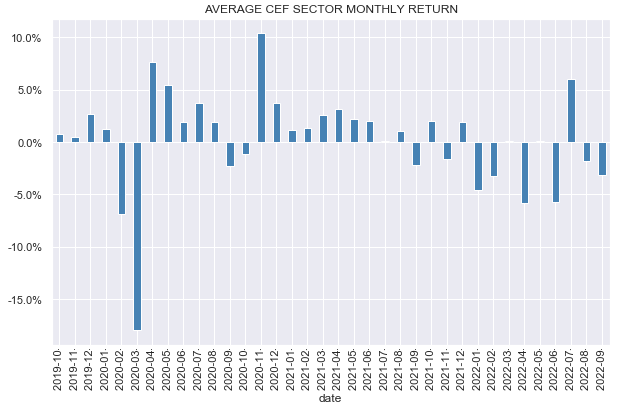
The CEF space is back to its May level and is around 4% off its recent June low.
Systematic Income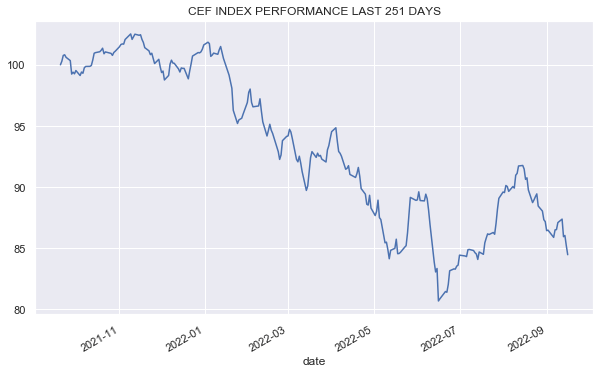
Fixed-income discounts have moved into attractive territory while equity CEF discounts remain expensive.
Systematic Income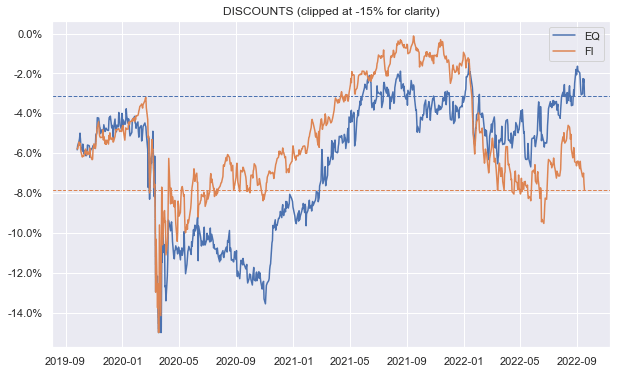
The moves this year across both credit spreads and credit CEF discounts have been interesting. As the chart below shows, from December of last year up to around April, the price action in CEFs was primarily driven by widening discounts (y-axis). From April to June, on the other hand, price action was primarily driven by widening credit spreads even as discounts tightened somewhat. Since then we have seen a small rally (from June to August) as both credit spreads and discounts tightened, followed by a period where credit spreads remained fairly flat while discounts widened out.
In our view, current credit spreads look too tight relative to CEF discounts so we would expect spreads to widen out in the medium term or discounts to tighten. Between these two scenarios, we see wider credit spreads as the more likely outcome.
Systematic Income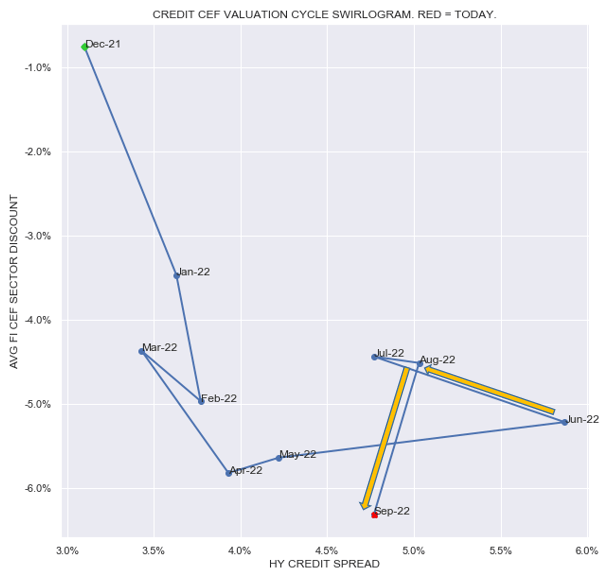
Market Themes
There was a discussion on the service of whether the rising leverage costs of many CEFs are to blame for their poor performance this year. As a case study, we can use the PIMCO Dynamic Income Opportunities Fund (PDO).
There is a lazy refrain we come across now and again that says something like because PDO uses repos for borrowings and repos bear a floating-rate interest expense, the recent rise in short-term rates increases the cost of leverage of the fund and that largely explains the year-to-date performance of a fund like PDO.
That kind of comment is the typical hand-waving kind of argument you tend to see. The problem with it is that it approaches things backwards. Basically, it looks at the performance of a fund like PDO then notices that it has floating-rate liabilities and jumps to the conclusion that it’s the fact that its interest expense has increased which must explain its negative YTD return.
This sort of thing can sound convincing because the argument is correct directionally i.e. all else equal a rise in interest expense will pull the fund’s total NAV returns lower. However, if we look more carefully we will notice that the actual impact of higher leverage costs cannot even approach to explain the moves in most credit CEFs we have seen this year.
For instance, PDO interest expense has risen by around 3% this year (about 2% has actually fed through the interest expense). The fund’s liabilities are a bit less than its total equity and the timeframe we are talking about is around 8/12 of the year. In other words, the impact of the fund’s increase in liabilities is roughly 2% higher liability cost x 1 (amount of liabilities relative to the NAV) x 8/12 = 1.3%. The fund’s total price return this year is -19% and its total NAV return -15%.
So the argument that the rise in interest expense largely explains the total Price / NAV return is more than an order of magnitude wrong. So, what explains PDO performance? Well, a big chunk of price performance is due to the discount widening. The rest is due to the rise in credit spreads and the rise in Treasury yields.
Coming back to interest expense, keep in mind that in addition to floating-rate liabilities a fund like PDO also has floating-rate assets like loans, non-agency MBS and ABS in roughly the same amount as its repo, resulting in little to no impact on its income or NAV from the change in short-term rates. The key takeaway here is that investors should look outside the cost of repo to explain CEF performance this year.
Market Commentary
There is a view in the commentariat that because the RiverNorth CEF (OPP) is overweight non-agency MBS it has significantly underperformed this year as MBS durations have increased due to higher rates.
First, it’s important to point out that an increase in duration from higher rates (this happens because mortgage holders become much less likely to refinance) which is also called convexity is a second-order effect in explaining price moves. Saying convexity is responsible for the drop in MBS prices is like saying that what explains a car travelling 50 miles in one hour is the fact that it accelerated slightly over its journey before stopping rather than the simple fact that it moved on average at 50mph over the journey.
Secondly, a lot of what OPP lists under non-agency mortgages in its report are not, in fact, residential mortgage securities but rather asset-backed securities (e.g., the Upstart Securitizations), home equity loans (e.g., New Century securities), CLOs (e.g., Octagon securities) and student loans (e.g., SOFI securities).
Finally, most of the non-agency MBS sector is floating rate and hence its duration couldn’t have increased very much. What explains the total return of a fund like OPP this year is the duration exposure of its other assets, the rise in credit spreads as well as the widening in CEF discounts (OPP holds CEFs in its portfolio). Overall, we view the non-agency MBS space as an attractive one in this environment.
There were a number of August CLO Equity CEF NAV updates. OXLC NAV rose by 6% in August (it’s about 17% below year-end level), ECC NAV rose by 4.4% (it’s about 15% below year-end level), OCCI NAV rose by 5% (it’s 17% below the year-end level), EIC NAV rose around 2% (it’s 13% below the year-end level).
CLO Equity CEF premiums have deflated somewhat from both ends by the drop in price and by the most recent rise in the NAV. So far, NAVs are estimated to be slightly lower in September.
Having moderate but not sky-high volatility is a good thing for these funds. Moderate volatility allows them to reinvest loan repayments in below-par priced loans and (in most cases) enjoy the eventual maturity or repayment at par while sky-high volatility typically causes them to deleverage which, in turn, causes them to lock in economic losses. So long as volatility remains moderate and defaults remain low these funds can benefit.
So far, as our CEF Tool shows, the total NAV returns of these funds have done quite well this year relative to the double-digit figures we see in many other credit sectors.
Systematic Income CEF Tool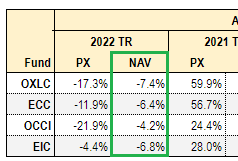
The 2 Apollo credit CEFs hiked distributions – AIF by 13% and AFT by 11%. This is the third hike for AIF this year. AIF earned $0.085 on average in the first half of the year and is now distributing $0.11. That’s a big difference but the fund is just looking ahead given the lag with which short-term rates get passed through to income, the fund reporting lag when we find out the fund’s income level and the fact that short-term rates will continue to rise. AIF remains in the High Income Portfolio.
Stance and Takeaways
We have not chased the June-August rally higher and now that it has mostly reversed, we are looking to add more CEF exposure in our Income Portfolios. A number of CEFs are within 1-3% of their lows for the year including DMO, WDI, FINS and PTA. The first two funds have a significant floating-rate/non-agency MBS exposure and the latter two have a higher-quality tilt – two features we find attractive in the current environment.
Be the first to comment