

Darren415
This article was first released to Systematic Income subscribers and free trials on Oct. 16.
Welcome to another installment of our CEF Market Weekly Review where we discuss closed-end fund (“CEF”) market activity from both the bottom-up – highlighting individual fund news and events – as well as the top-down – providing an overview of the broader market. We also try to provide some historical context as well as the relevant themes that look to be driving markets or that investors ought to be mindful of.
This update covers the period through the second week of October. Be sure to check out our other weekly updates covering the business development company (“BDC”) as well as the preferreds/baby bond markets for perspectives across the broader income space.
Market Action
It was another solid down week for CEFs with all sectors finishing in the red as the space struggled from higher Treasury yields and lower stocks. The month-to-date picture is more mixed with a few sectors eking out gains.
Systematic Income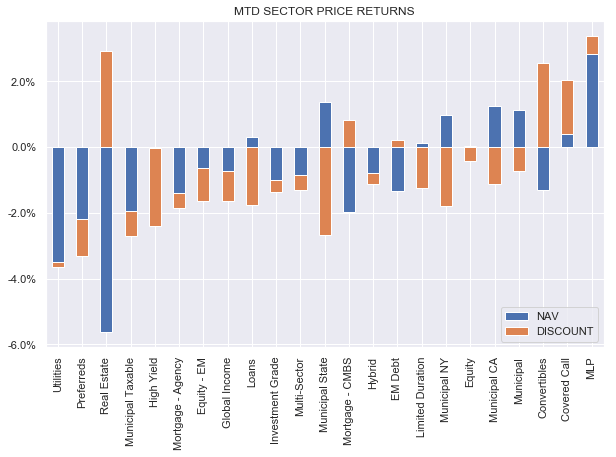
The CEF space is about 80% of the way through the full-year 2008 drop and is well below previous non-GFC annual drawdowns. The unusual combination of higher Treasury yields combined with wider credit spreads alongside lower stocks as well as a high valuation starting point in 2021 is responsible for such a sharp drop.
Systematic Income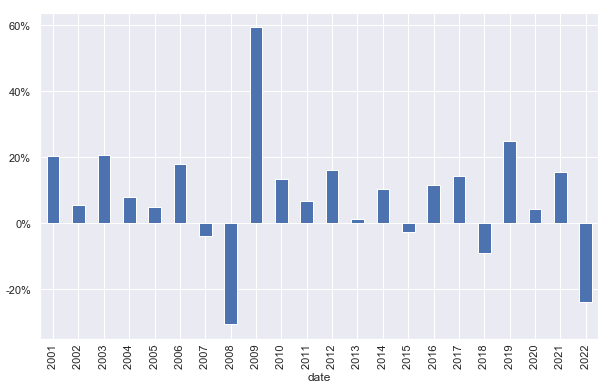
Fixed-income CEF sector discounts have widened below their June levels and are at double-digit levels. Fixed-income discounts were wider only briefly during the 2018 Fed autopilot fiasco as well as the COVID crash. The GFC period saw a longer period of double-digit discounts. Overall, we see a lot of value in the fixed-income CEF space, particularly for funds whose leverage costs are at reasonable levels – a theme we have been focused on this year.
Systematic Income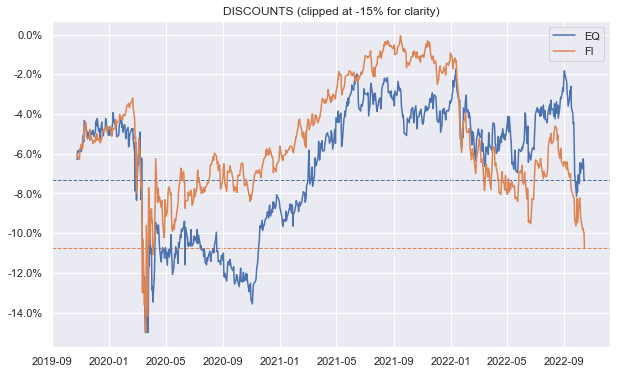
Market Themes
The CEF Putnam Premier Income Trust (PPT) came up on the service recently. From the face of it, the fund looks great – high-quality (60% in BB and above), very resilient this year (only a -4.7% total NAV return year-to-date), very low duration, no leverage, some floating-rate assets in the portfolio and nice 8.9% yield on price.
Couple of things are worth highlighting, however. One thing that’s slightly worrying is that its distribution coverage is 64% i.e. it earns only around 5.1% on NAV. The fund looks to be focused on investment-grade assets and mathematically it’s just very hard to generate a yield of 8%+ if you hold mostly investment-grade assets.
Its income also fell slightly over the first-half of the year from the previous half. This is a bit odd since it holds quite a bit of floating-rate securities and no leverage. It does have an absolute ton of other stuff like swaps and swaptions which make it impossible to figure out exactly what’s going on in the portfolio but net-net it doesn’t look like its income will increase with rising rates. The best that can be said is its income stopped falling as quickly as it did in the previous years though it’s still falling.
What’s likely contributing to lower income is that the fund does actually benefit a bit from rising rates but because it overdistributes by a lot there are fewer assets left to enjoy the higher short-term rates. The change in short-term rates has clearly been larger than its drop in net assets so we could still see its income rise over the following six months but there is no way its coverage will ever approach 100%.
The other thing worth saying is that up to the end of 2021 (i.e. before this year’s sell-off) the fund had generated a 1.9% CAGR over the last 5 years in total NAV terms. What this tells us is that its actual value generation ability is miles off its 8% distribution rate. That figure is also very disappointing next to everything else out there – we don’t care which asset you look at over the 5-year period ending in 2021 but it vastly outperformed PPT on a total NAV basis. To generate just 1.9% per year in value in a pretty strong overall environment is not a great sign that the fund can generate significant value over time in a more normal environment.
Market Commentary
The loan CEF Apollo Tactical Income Fund (AIF) raised its distribution once again – the fourth time this year. The distribution now stands 28% above its year-end level. This makes sense – ultimately we should see loan yields roughly double from their 2021-end levels i.e. whereas loans tended to pay something like Libor + 4% or about 4.2% at year-end, now they are paying 8%+ since Libor is north of 4% and this figure will be higher at the peak in the Fed Funds rate.
Moreover, there is some pull-to-par at play where the average loan trading around $95 with a 3-year life will deliver an additional 1.7% gain per annum on an unleveraged basis. This will be offset partly by a higher default rate. AIF trades at a 15% discount and a 11.7% current yield. It remains in the High Income Portfolio.
CEF leverage numbers were updated for September on the service. There were some borrowing cuts in BlackRock Muni funds in particular which seems to echo their recent distribution cuts. The rise in leverage costs this year for Muni funds would have likely necessitated the cuts however the deleveraging (i.e. borrowing cuts) are an additional income headwind for these funds.
Eagle Point CLO CEFs posted September NAVs. Interestingly, both (ECC) and (EIC) NAVs fell 9.5%. That’s odd given EIC has a CLO Debt / Equity focus while ECC is primarily CLO Equity. Perhaps EIC has been increasing its CLO Equity footprint as well as leverage though it could be a fluke too.
The result is that ECC is trading at a 3% estimated premium while EIC is at a 17% estimated premium (i.e. based on daily estimated NAVs which are 1-2% below the September numbers). ECC is trading at a much more reasonable valuation now and looks to be only a bit more expensive than OXLC. All else equal ECC is a more attractive CLO Equity fund as its reinvestment periods are longer which gives it greater ability to generate value by reinvesting loan repayments into other loans trading below par. The entire pull-to-par goes straight to the bottom line of CLO Equity. On the other hand, EIC trades at a ridiculous double-digit premium – holders should rotate either into ECC or XFLT if they prefer partial CLO Equity exposure.
Systematic Income CEF Tool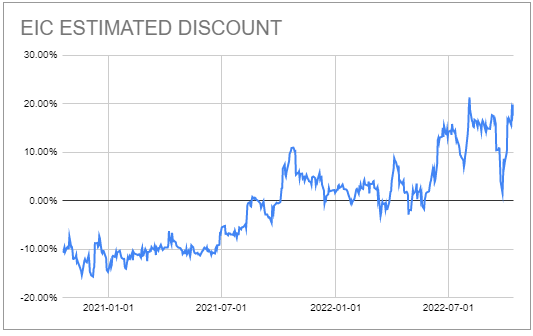
Stance and Takeaways
The broader CEF space has moved to lower lows which marks an attractive moment to consider adding new capital to the space. Many pockets of the broader CEF space are trading at very attractive levels. We continue to maintain focus on funds with attractive valuations, decent-quality assets and whose leverage costs remain modest. This includes funds such as FINS, DMO, PTA and others. If and when credit spreads move out to levels associated with previous recessions, adding capital to higher-yielding assets will, once again, begin to make a lot of sense.
Be the first to comment