

Darren415
This article was first released to Systematic Income subscribers and free trials on Oct. 8.
Welcome to another installment of our closed-end fund (“CEF”) Market Weekly Review where we discuss CEF market activity from both the bottom-up – highlighting individual fund news and events – as well as top-down – providing an overview of the broader market. We also try to provide some historical context as well as the relevant themes that look to be driving markets or that investors ought to be mindful of.
This update covers the period through the first week of October. Be sure to check out our other weekly updates covering the BDC as well as the preferreds/baby bond markets for perspectives across the broader income space.
Market Action
It may not have felt like it but the broader income market was up on the week, including the CEF space which gained close to 1.5% after a tough three weeks that combined for a 10% drop. The CEF index remains around 20% down for the year.
Systematic Income
Fixed-income CEF discounts range-traded and remain attractive historically while equity CEF discounts tightened.
Systematic Income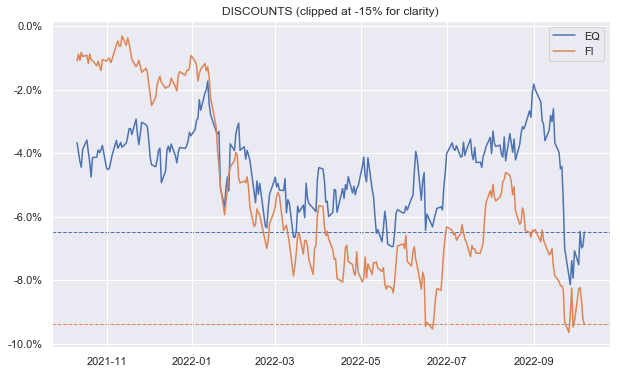
A number of sectors remain attractively valued in both absolute terms (i.e. discounts – y-axis) as well as relative terms (i.e. discount percentile – x-axis). These include Munis, Loans, High Yield and others. Utilities are in valuation la la land primarily because of GUT – the median discount in the sector is a still expensive zero.
Systematic Income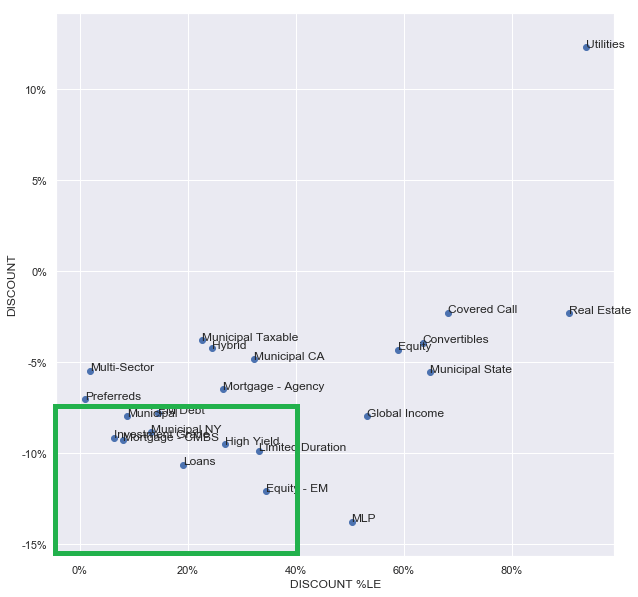
Market Themes
Gauging the performance of a CEF came up on the service, specifically, how to determine whether a given CEF has outperformed or underperformed. We can use the high-yield AllianceBernstein Global High Income Fund (AWF) as an example.
It can be very tempting to just compare the fund to the popular ETF benchmarks such as JNK over the longest possible period. On this metric, AWF is an outperformer. However, this kind of comparison can easily lead to the wrong conclusion.
First, comparing a CEF to ETFs is not really apples to apples as it ignores leverage and other performance factors. Second, a comparison of CEF prices to ETF prices will largely be a function of what CEF discounts have done over the period in question which is often driven by broad market sentiment and is not always indicative of the value management are generating (which is what we are after in gauging performance).
Third, using a very long comparison period is not always right since there are many examples of funds that generated a lot of alpha early on but ran out of gas so to speak and have underperformed consistently more recently.
The way we would gauge the performance of a CEF on the service is to glance at the fund’s return over the 3Y and 5Y periods against the sector (both median and average) in total NAV terms which are highlighted below from our CEF Tool.
Systematic Income CEF Tool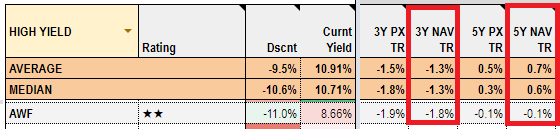
What we see is that AWF has underperformed the sector by 0.5% per annum and by 0.8% per annum over the last 3 and 5 years in total NAV terms. This is more of an apples-to-apples comparison as it compares a CEF to other CEFs in the sector. Second, the focus on total NAV returns rather than price returns provides a cleaner way to gauge management alpha. Finally, it looks over a couple of shorter periods, which is helpful in gauging recent performance as well as any changes in performance.
This would, obviously, be a starting point – other key performance factors include the consistency of performance (i.e., the number of years the fund has outperformed the sector), risk-adjusted performance, performance across certain periods such as the COVID crash and many others. It’s always tempting to reach for a single convenient metric in CEF analysis but doing so can lead to the wrong conclusion.
Market Commentary
There were lots of CEF distribution announcements as usual at the start of the month. Many of the usual patterns in distributions are showing up that we have seen before. Funds with managed distributions like some of the MFS funds (e.g. MMT etc) continue to cut distributions as their NAVs fall (or higher NAVs drop out of the averaging window). Fixed-coupon asset / floating-rate liability funds like Muni funds continue to cut – there were a couple of dozen funds across BlackRock and Nuveen that cut yesterday, many by chunky amounts of around 20%. Calamos convertible funds (CGO, CHW) that tend to adjust their distributions infrequently to their NAV levels also cut. As expected, floating-rate funds have been holding up well.
The Angel Oak Financial Strategies Income Term Trust (FINS) shareholder report came out. Net investment income rose by 17% from the previous six-month period. It’s still below the current distribution rate however the average Libor that went into the latest net income period was around 1% and Libor is around 3.75% now and is headed towards 4.5%+. In other words, there is another 3.5% of uplift in the fund’s net income which should push its yield on price towards 8-9% which is pretty good for a mostly investment grade portfolio.
The Virtus Convertible & Income Fund II (NCZ) postponed its October and November distributions as its preferred asset coverage is below 200% (i.e. its leverage is above 50%). Last time this happened was in July when its leverage was only slightly above 50%. This time leverage is further above 50% – around 51% so it will take a bit more time to get it back in line. The red line below shows the previous dividend suspension and the green line shows when it was reinstated. If/when the leverage line dips below 50% the dividend will be paid out.
Systematic Income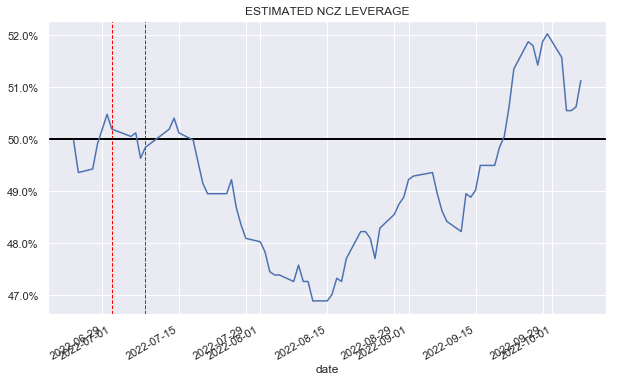
Earlier, NCV and NCZ announced a tender offer of their auction-rate preferred shares (ARPS) at 99.95% of “par”. This makes a lot of sense. The way these preferreds work is that they pay 2x short-term rates (7-day AA CP rate to be precise). That was great when short-term rates were around zero (2x zeroish is still zeroish) but not so great when short-term rates are around 3-4%.
It really would have been better to do a tender offer in late 2021 when the interest on these was zero so the holders would be incentivized to redeem. It’s not at all obvious anyone would tender investment-grade preferreds that are paying 6-8%, particularly below par. Of course, the other reason it makes sense is it will lower the fund’s leverage profile making these distribution suspensions less likely.
Stance and Takeaways
The market has struggled in the last few days after a big bounce and a number of securities are trading near their year-to-date lows. We continue to tilt to decent-quality funds so long as high-yield corporate bond credit spreads remain below 5%. That includes funds like JPI, PTA, FINS, DMO and others.
Be the first to comment