

Darren415
This article was first released to Systematic Income subscribers and free trials on July 9.
Welcome to another installment of our CEF Market Weekly Review where we discuss CEF market activity from both the bottom-up – highlighting individual fund news and events – as well as top-down – providing an overview of the broader market. We also try to provide some historical context as well as the relevant themes that look to be driving markets or that investors ought to be mindful of.
This update covers the period through the first full week of July. Be sure to check out our other weekly updates covering the BDC as well as the preferreds/baby bond markets for perspectives across the broader income space.
Market Action
It was a good week for the CEF sector as markets continued to recover from their June swoon. Most CEF sectors are up in July on the back of higher stocks and tighter credit spreads. Only the higher-quality sectors which are more sensitive to Treasury yields which rose are down on the month.
Systematic Income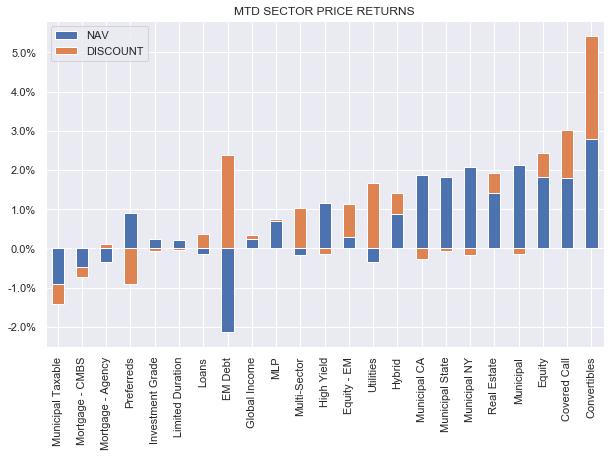
CEF discounts tightened sharply, erasing their previous dip. We now view fixed-income discounts as fairly-valued rather than cheap while equity CEF sector discounts remain expensive in our view.
Systematic Income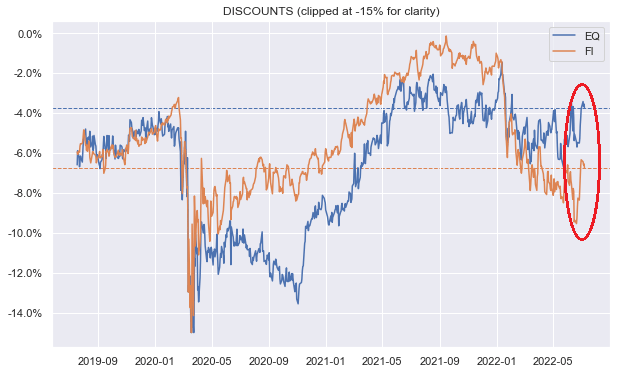
All in all, the valuation picture in the CEF market is less appealing than it was in June as both discounts and credit spreads have tightened over the last few weeks. The CEF market has now moved back to where it was about two months after about a 13% trading range. It is yet to break out of its lower lows / lower highs trend.
Systematic Income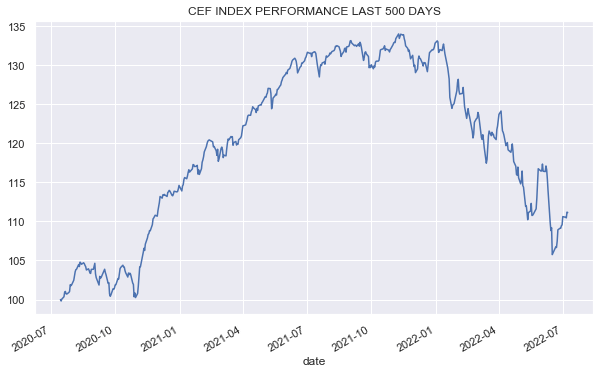
Market Themes
One of the themes that we have discussed over the last few months is that higher underlying asset yields allow discounts to act as a yield lever, magnifying the additional yield each percent of discount widening can deliver to investors.
One way to look at this dynamic is as an offset to, typically high, CEF management fees. In short, when underlying asset yields are high and discounts are wide, active management fees are, in effect, often greatly reduced or even eliminated in some cases.
For instance, let’s take a look at the yield disaggregation of the Limited Duration Preferred & Income Fund (LDP) shown below. What we see is that the management fee on net assets is around 1.06% while the additional yield boost due to the discount is around 0.49%. So, one way to think about the current environment is that investors get a 50% discount on the fund’s active management fee.
Systematic Income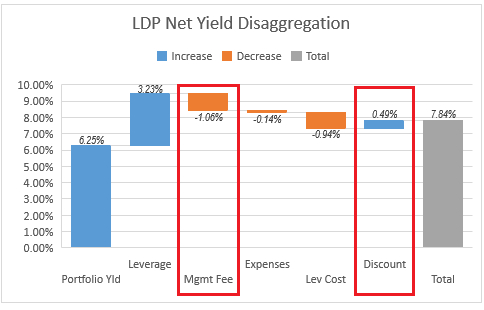
Two additional things are worth considering. First, this clearly works better when the management fee is not excessive and when the discount is reasonably wide. Funds that trade at a premium, in effect, carry an additional active management fee.
And two, investors clearly should avoid value traps. We don’t want to pay a low effective management fee if the value added by management is negative. And vice-versa, sometimes it makes sense to pay an additional management fee (i.e. buy a fund at a premium) if that is warranted. In our experience, the former situation (i.e. value traps) is much more common than the latter.
Market Commentary
Start of the month brought CEF distribution news. As already highlighted in a separate article, the PIMCO Dynamic Income Opportunities Fund (PDO) hiked. Our view here is possibly unusual in that we would have preferred no hike in the regular distribution with the spillover delivered as special distributions (the fund wouldn’t be able to avoid a special distribution given tax rules i.e. a CEF needs to pass on 90% of its net investment income to maintain its corporate tax-free status).
This is because the fund’s discount has now tightened from a double-digit level to around 5%, making reinvestments go in at a higher price. Investors who follow either the fund’s bottom-up yield profile or the fund’s coverage / UNII profile don’t need to be told that the fund was internally generating yields above its distribution.
Invesco cut a number of Muni CEF distributions as did MFS and Nuveen. Nuveen also cut two of the preferreds CEFs (JPS and JPT), likely due to the previous deleveraging which we already highlighted and which is what it did during the volatile period in 2020. This trend of Municipal CEF distribution cuts is something we have highlighted earlier and is a trend that will carry on for some time.
Interestingly, Nuveen raised distributions for all their loan funds which makes sense in the context of Libor having risen well above the typical 0.5-1.25% range of loan Libor floors.
Tax-Advantaged Preferred Securities & Income Fund (PTA) released its semi-annual report. Net income increased 4% from the previous semi-annual period which was a pleasant surprise given higher leverage costs and no variable-rate preferreds in the portfolio (except for PNC.PP which just floated).
Even though PTA has fixed 85% of its floating-rate hedge cost it’s interesting to see the rise in short-term rates hasn’t impacted its NII. Perhaps it rotated into higher-coupon preferreds in the last 6 months. Borrowings haven’t changed materially – something that will allow it to keep income ticking along unlike FPF or the Nuveen funds (which just cut).
There was a comment on a recent article to the effect that – the fund keeps distributing ROC (per monthly Section 19 statements) – isn’t that bad? In our view – not really. Section 19 ROC has been a long-standing and unusual feature of the Cohen funds in the sector. There are no obvious reasons for this. Relative to the preferreds CEF sector the Cohen funds have a similar sub-sector profile, similar rating profile, similar expenses, similar leverage, similar coupon profile, similar return profile and a NAV distribution rate that is actually below the sector average.
In short, there is no obvious reason why the Cohen funds should have a lower level of income generation in the sector. If they did really have a much lower level of income generation in the sector they should not have been able to generate a return in line with the sector while also carrying the largest duration hedges in the sector. So it’s weird – could be an accounting thing or a different treatment of the swaps. It’s also important to highlight that often the monthly ROC figures disappear when the final annual report comes out. This is the kind of thing that can trip people up – sometimes an overreliance on imprecise coverage or net investment income estimates can send the wrong signal.
Stance & Takeaways
As highlighted above, the CEF market has staged a small rally, supported by tighter discounts and credit spreads as well as higher stocks. In absolute terms, CEF valuations are reasonably attractive; however, they are not more attractive than in the period in which we were adding to CEF holdings across our Income Portfolios. For this reason, we are not chasing this rally and would rather wait to see how the macro picture develops over the coming months. The recent strong payrolls report suggests that the Fed will have to push harder to stop what is still fairly robust economic activity which could easily spill over into renewed market volatility.
Be the first to comment