

da-kuk/E+ via Getty Images
This article was first released to Systematic Income subscribers and free trials on Jan. 9.
Welcome to another installment of our CEF Market Weekly Review where we discuss CEF market activity from both the bottom-up – highlighting individual fund news and events – as well as top-down – providing an overview of the broader market. We also try to provide some historical context as well as the relevant themes that look to be driving markets or that investors ought to be mindful of.
This update covers the period through the first week of January. Be sure to check out our other weekly updates covering the BDC as well as the preferreds / baby bond markets for perspectives across the broader income space.
Market Action
The CEF market gave back some of the positive performance of the Santa Rally that we highlighted in the last review.
Systematic Income
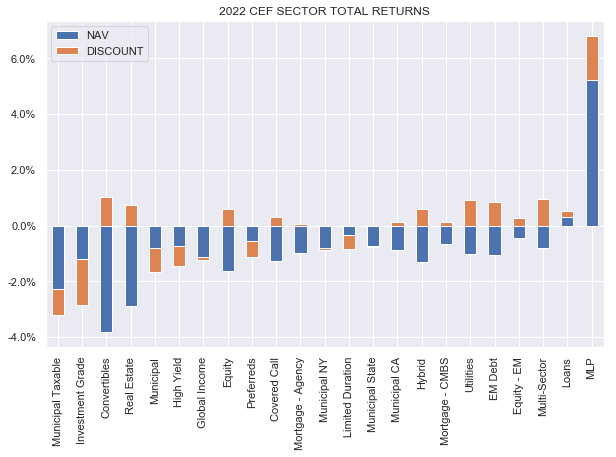
So far in this short 2022 only three CEF sectors have managed positive total price returns: MLPs, loans and multi-sector funds. Multi-sector and loan funds tend to have relatively low durations – a plus in a period of rising Treasury yields, while MLPs have retraced some of their November weakness.
As far as the discount vs NAV performance, only two sectors showed higher NAVs so far: loans and MLPs. Discount moves are mixed with about as many sectors seeing tighter discounts as wider.
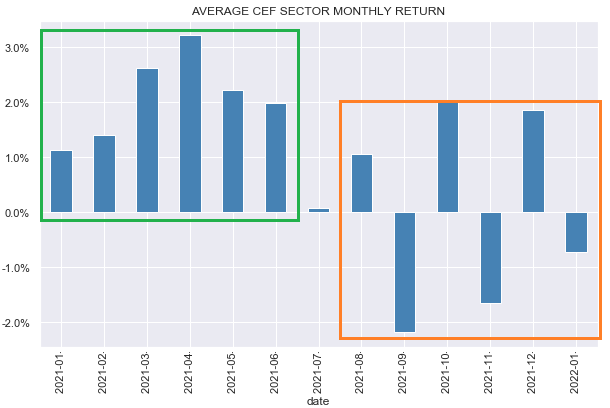
The last 6 months showed a starkly different trading pattern in CEFs – a “fat and flat” see-saw behavior versus steady gains in the first half of the year.
Systematic Income
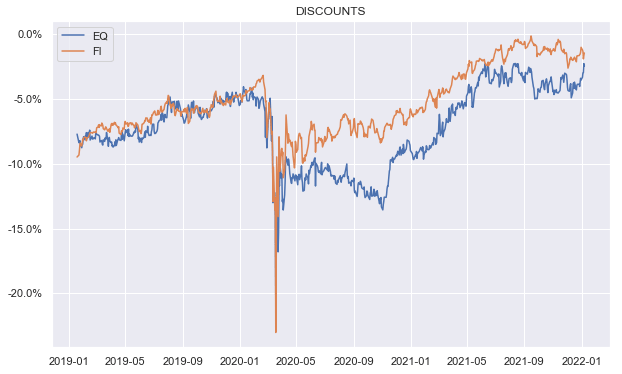
Fixed-income CEF sector discounts have been widening since their peak at close to zero around August. Equity CEF sector discounts have remains fairly strong and are now trading very close to their fixed-income counterparts after trading wider since the post-COVID period.
Systematic Income
Market Themes
Many investors like to check distribution coverage as well sources of distribution (i.e., income vs. capital gains vs. ROC) as part of their due diligence in managing their CEF portfolios. However, in the last couple of weeks we have come across a few instances of investors being misled by some sloppy disclosures on the part of CEFs. What’s worse is that some analysts have fallen into the same trap which makes life unnecessarily difficult for investors who rely on third-party analysis to make allocation decision.
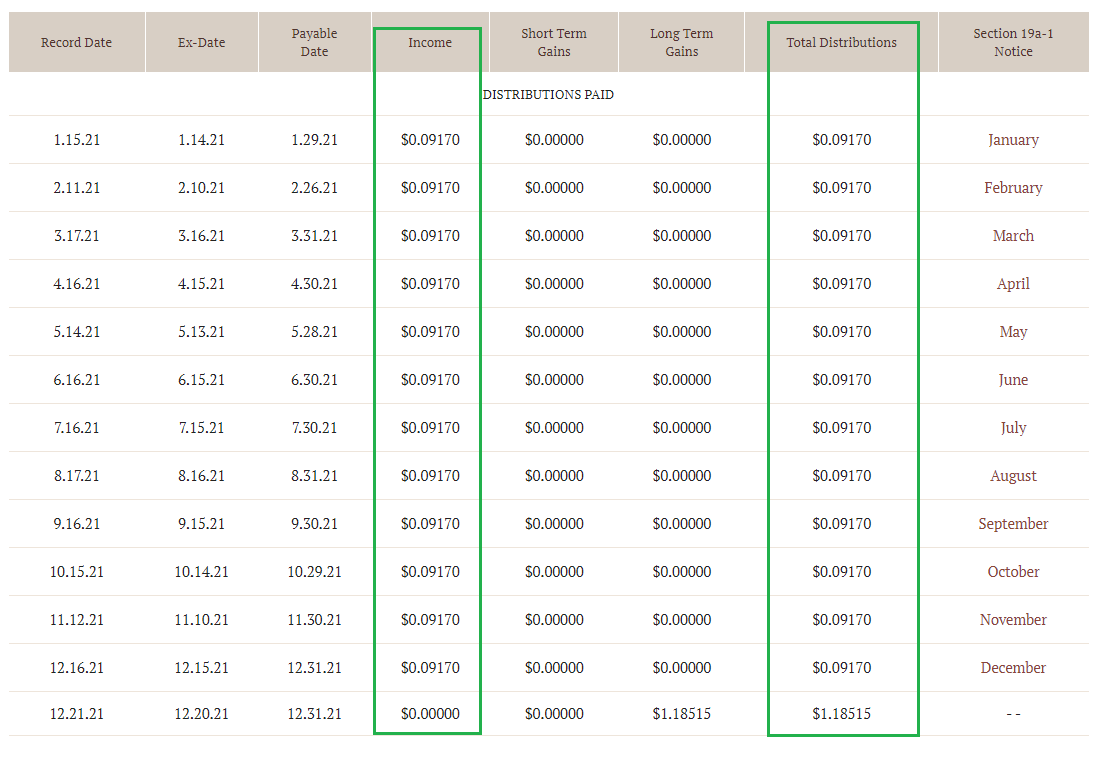
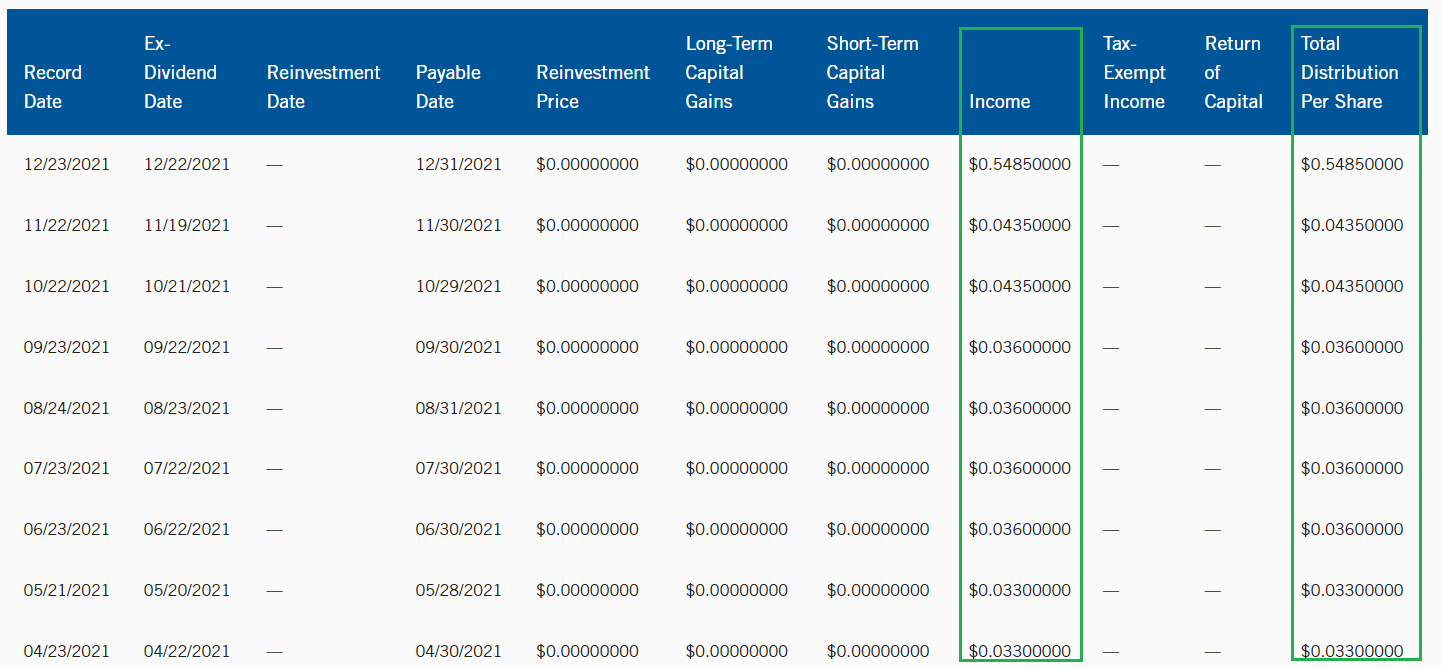
The first example comes from RiverNorth – we will use their Opportunistic Municipal Income Fund (RMI) as an example. The fund has a helpful table on its website where it shows that, apart from the special 2021 year-end distribution which was paid out of long-term capital gains, all the regular distributions came out of fund income.
RiverNorth
Many investors would leave it at that and move on with certainty that the fund’s regular distribution is fully covered by income.
However, if we click on the last Section 19a Notice as of December of 2021 it looks like this. It clearly shows that the December distribution was only 52% funded out of net investment income.
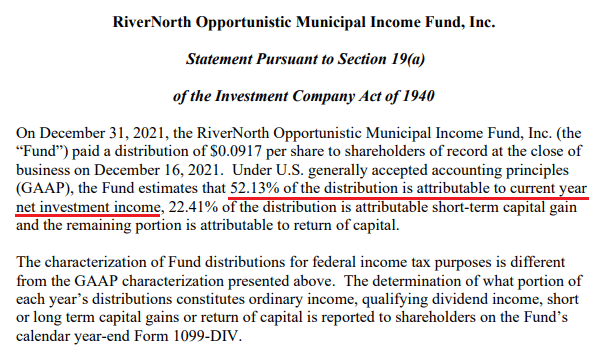
RiverNorth
The numbers were November were 52.43%, for October 56.99%, for September 53.09% and so on – clearly very different numbers than the website implies.
Let’s use another example – the Western Asset Inflation-Linked Opportunities & Income Fund (WIW). Again, the fund’s website reports its distributions fully covered by income.
Franklin Templeton
And again, if we go to the Section 19a notices we see that the December was 66% covered by income, the November distribution was 80% covered by income, the October distribution was 78% covered by income and so on. The total fiscal year-to-date coverage is 78% for the fund.
Which source should investors trust – the fund’s website or the Section 19a disclosure? In our view, investors should go with Section 19a numbers. This is because Section 19a is part of the Investment Company Act of 1940 – a key piece of legislation which regulates the fund industry and bears its full weight. As such it is considered official fund disclosure and shareholder communication.
Of course, contemporaneous Section 19a figures are estimates which can be restated later on, however, the company is still obligated to produce them in good faith. The website, on the other hand, is primarily there for marketing purposes. This is not to suggest that the fund is trying to mislead investors – it’s just that they probably don’t pay a ton of attention to website figures which they are simply not regulated to worry about.
Where does that leave investors?
Use caution in using numbers off a website. Instead, dig into Section 19a numbers if they are available (they should be unless 100% of the distribution is covered by income). Alternatively, use shareholder reports as a guide.
For instance, if we use the last WIW shareholder report we see that its net investment income yield on NAV has moved in the range of 2.4% to 3.3% or so – well below its 4.2% current yield on NAV. This can serve as a reasonable underlying yield capacity sense-check.
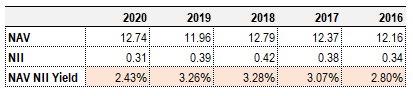
Systematic Income, SEC
Market Commentary
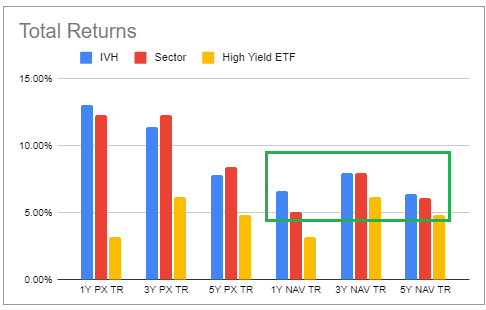
The Delaware Ivy High Income Opportunities Fund (IVH) – cut its distribution from $0.08 to $0.07. The fund’s distributions have been all over the place – they were at $0.085 at the start of 2021, then were progressively cut to $0.07 then had an uptick back to $0.08 and now a cut again to $0.07.
For six months up to September the fund generated monthly NII of $0.08 so the need for cut is not obvious and means its current distribution coverage is a high 114%. Plus, the fund is only running at a leverage of 25% which leaves it some room to generate more income. The fund doesn’t appear to have a managed distribution policy so it’s not clear why it would choose to update its distribution so often.
On the one hand, it’s very annoying when a fund changes its distribution so frequently but on the other it does create a potential opportunity. A lot of income investors will stay away from a fund that moves its distribution around which is probably one reason why it has continued to trade at one of the widest discounts in the High-Yield bond sector.
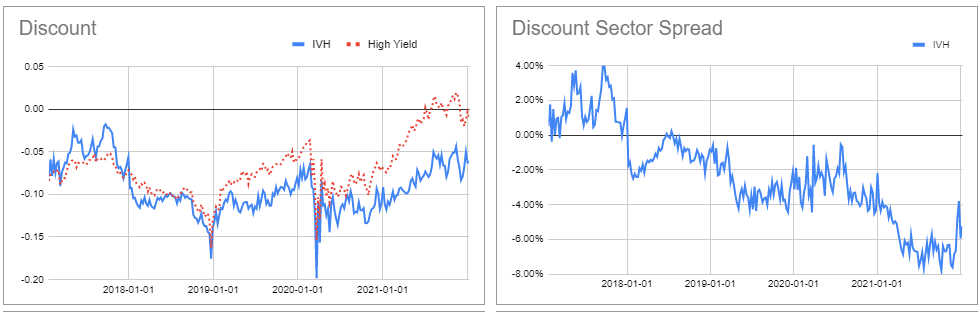
Systematic Income CEF Tool
IVH has outperformed the sector on a 5Y total NAV return basis and matched it on a 3Y basis.
Systematic Income CEF Tool
Another fund in the High Yield sector that looks attractive is the BNY Mellon High Yield Strategies Fund (DHF), trading at a 7.16% current yield, 108% coverage and 4.3% discount vs 1% average sector discount alongside sector-beating NAV returns.
Elsewhere, the start of the month brought CEF distribution updates. There were no changes from PIMCO. The company has tended to make 3 cuts each year and, given they have made 3 cuts recently, will probably hold off for a while till the next round of cuts. Eaton Vance made 2 changes in (ENX) and (EVG). Nuveen had two cuts in (NIQ) and (NQP). RiverNorth had 4 changes: 3 Muni funds increased distributions (RMI), (RMM), (RFM) and one cut (RFMZ).The RiverNorth funds performed well last year in NAV terms, outpacing the broader tax-exempt sector by about 4%. However, a couple of things are worth mentioning. First, the leverage of the funds looks quite high – RMM is around 35% leveraged which only takes into account its explicit leverage. The fund also holds leveraged CEFs as a third of its portfolio which carries additional embedded leverage. Obviously, this works on the way down as on the way up.
Secondly, the fund’s management fee is 1.4% which is about 0.8% above the sector average. Thirdly, its CEF holdings accrue their own level of fees. What this means is that about a third of the portfolio accrues a fee of 2% (1.4% for RiverNorth and around 0.6% for the CEFs it holds by the CEFs’ own managers). In an environment where investment-grade tax-exempt yields top out around 2% that doesn’t make a ton of sense since all the underlying income gets paid away as fees.
Fourthly, we have to be careful comparing the fund’s NAV performance to other funds in the sector because the tightening of CEF discounts over 2021 will be reflected in a higher NAV return of RMM because the prices of CEFs it holds are part of its NAV. This makes it difficult to do an apples-to-apples total NAV return comparison between funds-of-CEFs like RMM and typical CEFs which don’t hold other CEFs. In short, a big part of the reason the RiverNorth muni funds have outperformed the sector in NAV terms is simply because tax-exempt fund discounts tightened in 2021. Had CEF discounts widened, these funds would likely have underperformed.
Something else worth highlighting is the fact that these funds will tend to make significant distributions that don’t fall into the typical municipal tax-exempt income bucket, including ordinary income and capital gains which obviously have tax implications for investors. In other words, these funds are less tax-exempt than what a lot of people would think.
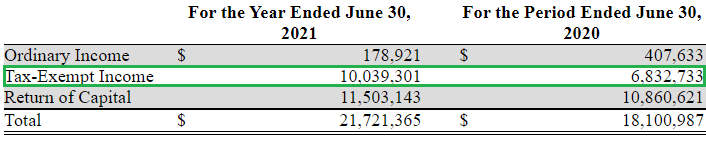
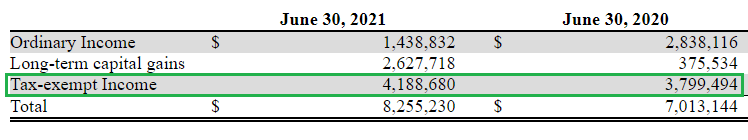
The tax picture for RMM looks like the following, with the typical tax-exempt income making up less than half of distributions. And although ROC is also tax-exempt, it does decrease the investor’s tax basis which can have higher than expected capital gains implications on the sale of the fund. For instance, an investor who bought the fund at $10 and sold it at $10 will have to pay capital gains in a taxable account if the fund distributed ROC along the way.
SEC
RMI has distributed significant ordinary income in the previous two years as well with tax-exempt income running at less than half its total distributions.
SEC
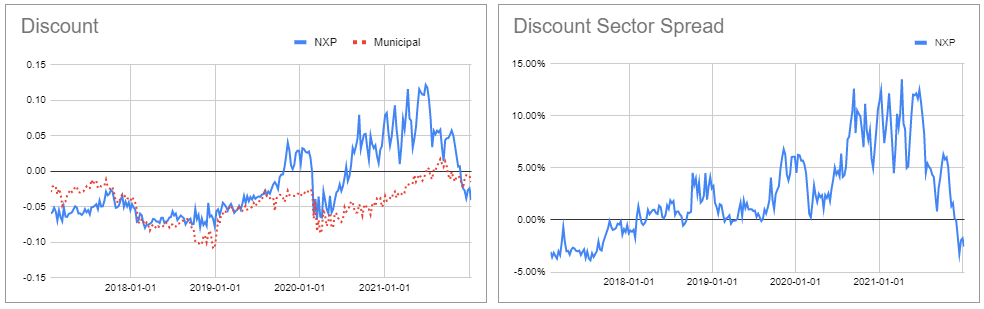
Sticking with the muni sector, the unleveraged tax-exempt Nuveen CEF (NXP) has seen its significant premium recently move to a discount.
Systematic Income CEF Tool
NXP is an interesting tax-exempt option for investors worried about higher rates but who also want to have a foot in the sector. It’s a national tax-exempt fund with a lower duration than leveraged options (around 6.5 vs. an average of 9-10 for the broader sector) given its lack of leverage. It is higher-quality than the average tax-exempt CEF with a 60% allocation to AA/AAA bonds. It has a very low management fee of 0.2% which is about a third of the typical tax-exempt CEF. And it is trading at a 4% discount so it’s like getting an active ETF or mutual fund but at a discount.
In the broader CEF space, funds that stand out are some of the usual suspects. The Cohen & Steers Tax-Advantaged Preferred Securities and Income Fund (PTA) is trading at a 5.7% discount and a 6.5% current yield and looks most attractive in the sector.
In the tax-exempt space, the MFS High Yield Municipal Trust (CMU) remains an appealing choice, trading at a 7.3% discount and a 4.24% current yield. The fund outperformed the sector by 1.5% in total NAV terms last year.
The Nuveen Core Plus Impact Fund (NPCT) in the Investment Grade sector is near a 7% discount (vs. 3% sector average) and a 6.9% current yield. The fund’s duration is very high at 14.4 so it’s worth waiting for some consolidation in the recent rise in Treasury yields before considering an allocation.
In the multi-sector space, the Western Asset Diversified Income Fund (WDI) trades at a 6% discount and a 7.6% current yield and features a low duration profile. Both NPCT and WDI are term funds as well – a structure which provides a kind of discount anchor.
The Apollo Tactical Income Fund (AIF) remains attractive in the credit space at a 6.9% discount and a 7% current yield.
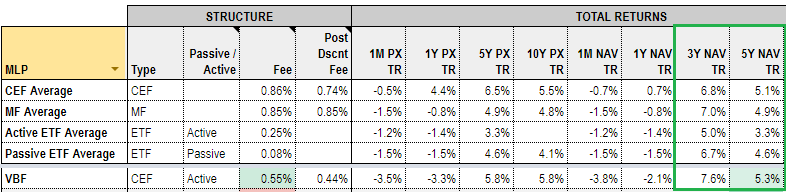
We had a short exchange on the Invesco Bond Fund (VBF) on the service chat. VBF is an unleveraged investment-grade CEF. Structurally, it’s similar to NXP which was highlighted above in the sense that it’s unleveraged and actively managed. In this it shares a resemblance to mutual funds with two benefits 1) it has a lower fee than most sector mutual funds (though a bit higher than active ETFs in the sector) and 2) it trades at a discount which ETFs tend not to do and mutual funds don’t at all.
In terms of historic returns, it has beaten the average sector CEF, mutual fund and ETF over the last 3 and 5 years in NAV terms.
Systematic Income Fund Tool
So, overall, there is some appeal in this fund for investors who 1) would otherwise consider an open-end fund or 2) for investors who don’t want a leveraged option.
It may seem odd to go for an unleveraged CEF, however, once the Fed makes a few hikes, higher-quality CEFs are going to struggle to deliver reasonable net investment income on the leveraged portion of their portfolio. For example, after 3 hikes, a fund with a 3% yielding portfolio (for context, BBB i.e. the lowest investment-grade rung corporate yields are trading at a yield of 2.77%) and a 0.8% expense rate will only pass on around 0.65% to investors (or about 22% of the 3% asset yield) on its leveraged assets, using the remaining 2.35% for leverage costs and fees.
We’re obviously going through a bit of a tantrum in fixed-income and investment-grade bonds tend to get hit the most in these periods. That said, one reason why longer-term Treasury yields have been fairly sticky below 2% is because the market doesn’t envision the Fed moving above a policy rate of 2%. Or, said another way, the market doesn’t think that the economy can withstand a policy rise above 2% without going into recession. Both of these views seem reasonable so adding some duration exposure here is not obviously wrong.
And adding duration exposure via investment-grade bonds rather than lower-quality bonds on the view that the Fed could very well push the economy into a recession is not a terrible idea because investment-grade bonds tend to hold up pretty well during recessions. At the same time, the discount volatility is a factor – in 2020 the VBF price underperformed the NAV by around 10% so investors who worry about a real market shock may want to avoid CEFs, even those allocated to higher-quality bonds.
As far as our overall stance in the sector, beta returns in CEFs are very likely to come in well below the strong levels investors have experienced in the last 18 months due to the combination of elevated underlying valuations and fairly tight discounts. This dynamic means we are using margin-of-safety, relative value and alpha tilts in our allocation to extract additional returns from the sector. These strategies should continue to top up beta exposure in the sector in 2022 as they did last year.
Be the first to comment