

Diego Thomazini/iStock via Getty Images
This article was first released to Systematic Income subscribers and free trials on Mar. 26
Welcome to another installment of our CEF Market Weekly Review where we discuss CEF market activity from both the bottom-up – highlighting individual fund news and events – as well as top-down – providing an overview of the broader market. We also try to provide some historical context as well as the relevant themes that look to be driving markets or that investors ought to be mindful of.
This update covers the period through the fourth week of March. Be sure to check out our other weekly updates covering the BDC as well as the preferreds / baby bond markets for perspectives across the broader income space.
Market Action
It was another mostly down week for CEFs with most sectors seeing lower NAVs and wider discounts. Equity-linked sectors outperformed on the back of a bounceback in stocks while fixed-income sectors were uniformly in the red, driven by a continued rise in Treasury yields. Incidentally, this is pretty much how the overall March picture is stacking up as shown below.
Systematic Income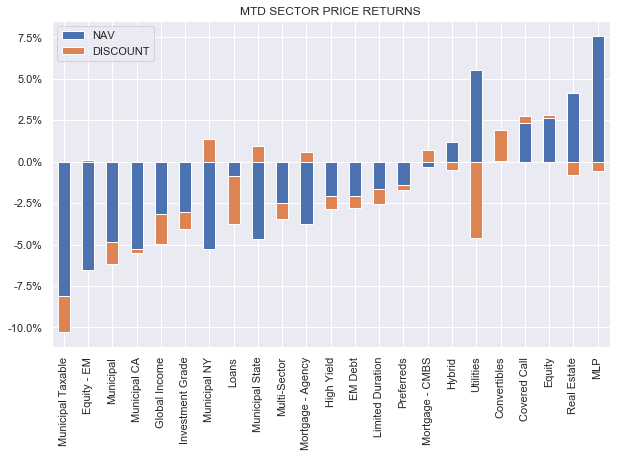
Overall CEF market returns in March so far are not as bad as those of January and February as previous equity weakness has been partially reversed.
Systematic Income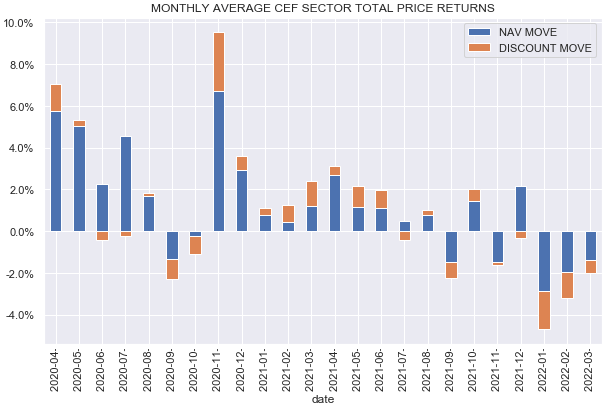
Year-to-date the median sector return is in the double-digits in the red with all but one sector registering wider discounts.
Systematic Income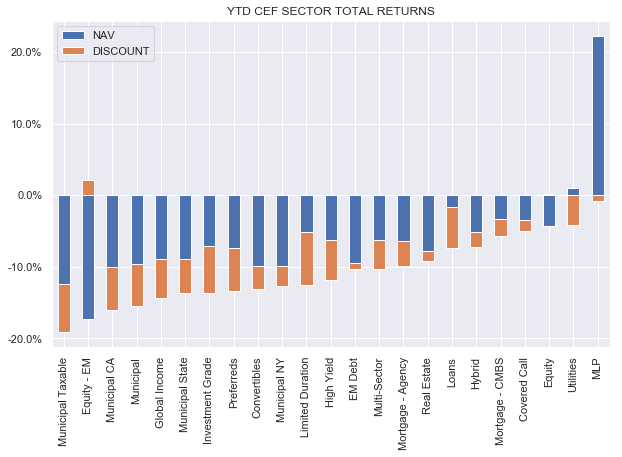
Overall, the CEF market is basically flat over the past year though it has bounced back about 3% from the trough of the recent sell-off.
Systematic Income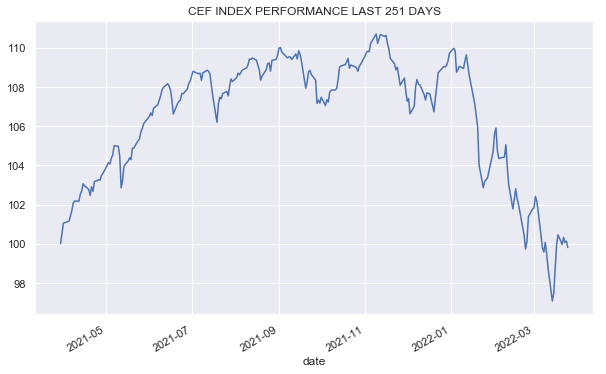
Last week we wondered whether CEF discounts would be able to hold onto their recent bounce after seeing three of their previous bounces erased. The answer now appears to be no. The key difference is that discounts have not yet widened below their troughs a few weeks ago though they are not far from them.
Systematic Income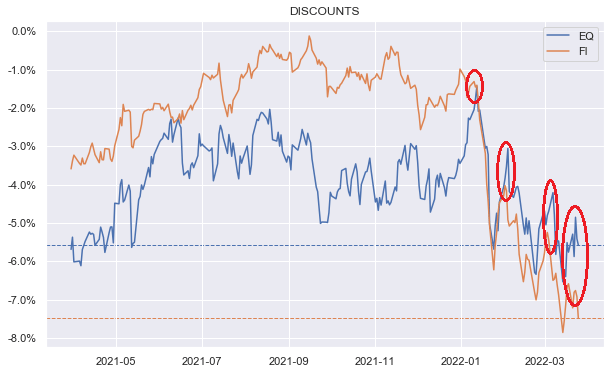
Overall, we find fixed-income CEF sector discounts to be, in aggregate, at an attractive level while equity CEF sector discounts remain somewhat expensive.
Systematic Income
However, while fixed-income fund discounts are attractive, credit spreads have, annoyingly, bounced back. This suggests that based on our credit CEF swirlogram we are at OK levels but not particularly close to the Back Up The Truck area as shown below.
Systematic Income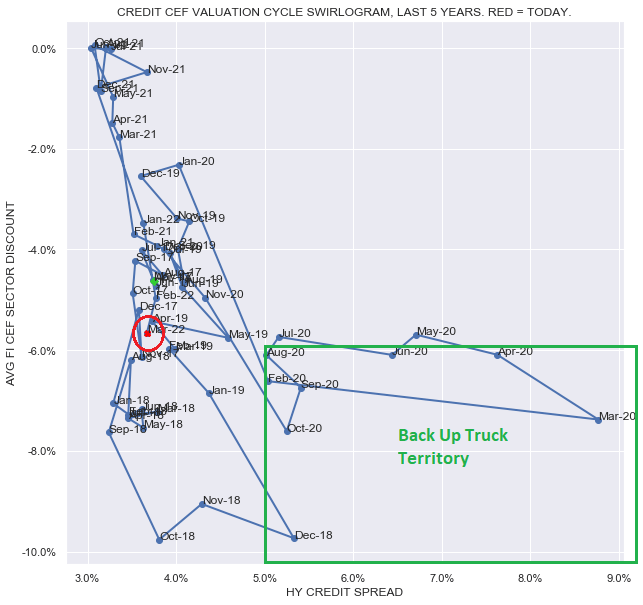
Market Themes
Out of all the challenges (and opportunities) that CEF investors were presented with during the COVID crash of March-2020 CEF deleveraging was probably the least noticed.
A CEF deleveraging happens when a CEF finds its leverage level too high. This could be because of a leverage cap mandate in its prospectus – something that many funds have, particularly those in the preferreds sector. Or it could be because the leverage is simply too high for the comfort level of the fund’s manager. A deleveraging is typically caused by a drop in the prices of the fund’s holdings which then, mechanically, drives up the fund’s leverage (defined simply as borrowings / total assets). Since the numerator is fixed while the denominator falls, the leverage rises as asset prices fall, all else equal.
There are many good examples of deleveraging – perhaps, the best is to use a pair of popular funds (PCI) and (PDI), with PCI now having been merged into PDI. As we discussed at the time, PCI entered the drawdown at a very elevated leverage level of mid-40s versus a more modest level for PDI in the high 30s. A sharp sell-off in credit assets caused a sharper drawdown by PCI (i.e. orange line in the chart below falls more) and a more modest rebound. Had PCI kept its borrowings intact the rebound in asset prices would have allowed it to close the NAV gap with PDI and this never happened.
Systematic Income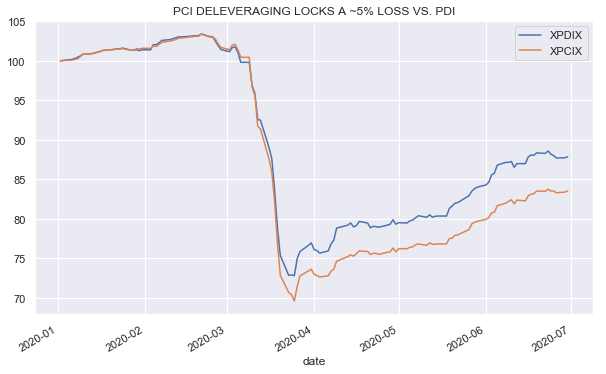
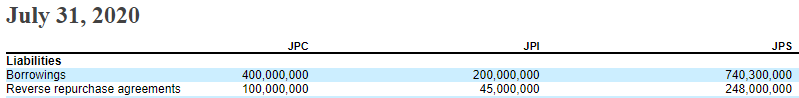
Tracking deleveraging requires investors to follow borrowing levels. This is facilitated by those funds which release updates on a monthly basis, however few funds do this. For the vast majority of funds we need to go to the semi-annual shareholder reports. For example, for the three Nuveen preferred CEFs that deleveraged in March we can see that their borrowings were substantially higher before the crash than after. For example, JPC carried $612m of borrowings before the crash and only $500m after it.
Nuveen Nuveen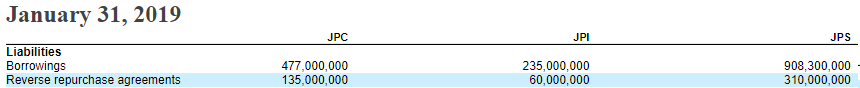
Once the fund manager decides to deleverage, they will sell the fund’s assets in order to pay back some of the fund’s borrowings, to push the leverage level back lower to a more comfortable level. The knock-on impact, of course, is that the fund will typically sell assets lower than when they bought them, locking in economic losses. This means they will also not be able to claw back the fund’s NAV to the pre-drawdown level even if asset prices come fully back since now the fund has fewer assets. Another consequence of a deleveraging is that the fund now has fewer income-producing assets and hence, a lower income level.
Why the broadbased deleveraging in 2020 was not particularly notable is for two reasons. One is that it’s not easy to gauge, particularly for those investors who don’t care to parse through shareholder reports and, even those who do, have to often wait months for the next semi-annual report to be issued. And the second reason why broadbased deleveraging was not very visible in 2020 was that leverage costs fell sharply as the Fed cut the policy rate to a near zero level from around 1.5%, shaving 60% off the leverage cost of most funds and more than making up for the loss of income due to the deleveraging.
Of course, not all deleveraging went unnoticed. The MLP sector deleveraged to such an extent that many funds even suspended distributions to preserve NAV. All in all, the sector lost about a third of its pre-crash distributions.
Systematic Income CEF Tool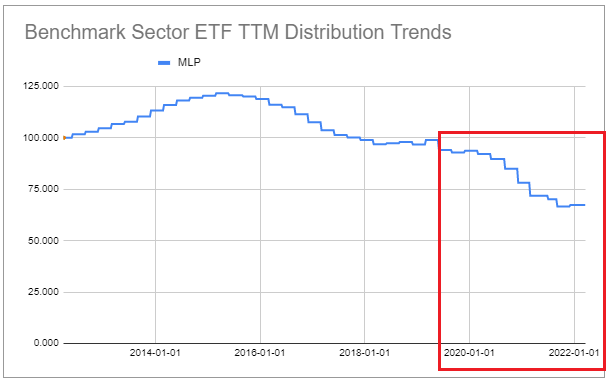
A clear difference between today and 2020 is that the Fed’s policy rate is moving higher rather than lower. And so if we do see a deleveraging, leverage costs are not going to save the day and will actually provide a second drag on fund income levels.
Another key difference is that the current peak drawdown has been much more mild than the one in March of 2020. This means that funds are in much better shape (so far) than they were in the previous crash.
Systematic Income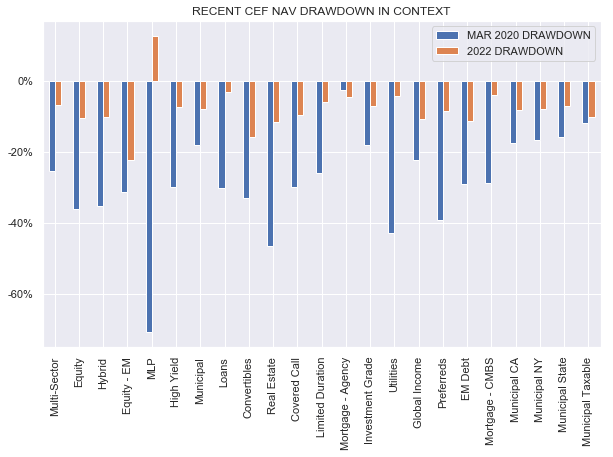
This latest drawdown has been primarily an interest rate driven drawdown. And while this move higher in rates has been painful, the move in credit spreads has been very benign. For instance, credit spreads have risen by less than 1% so far this year. In March of 2020 they rose by 7.5% or close to 10x more. In our view, if credit spreads remain well-contained then few, if any, funds will be forced to deleverage. However, if we see credit spreads weaken significantly then some funds will likely be forced to act.
FRED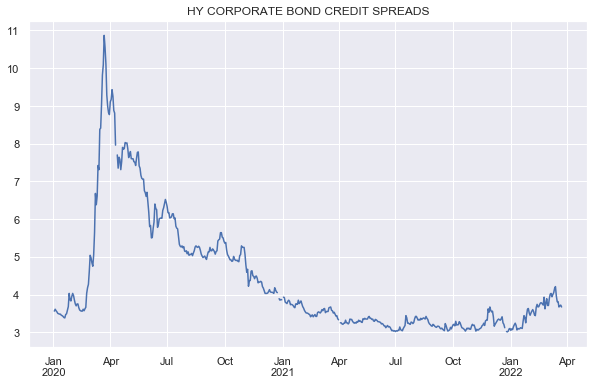
To give some perspective, the following chart shows the impact of the two drawdowns. The CEF drawdown this year pushed NAVs lower by around 9% on average at the lows versus around 33% for the COVID drawdown. A fund with leverage of 35% would have seen its leverage rise to 37.2% this year versus 45% during the COVID crash. Clearly, a rise in leverage by a bit more than 2% (35% to 37.2%) is much easier for a fund to digest without having to deleverage than a rise of 10% (35% to 45%).
Systematic Income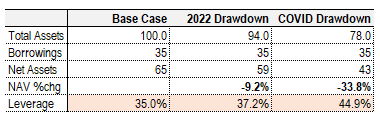
That said, as usual, we would be careful holding funds with either very elevated leverage, very long duration such as taxable muni funds or funds with a leverage mandate cap as these funds are more vulnerable to a deleveraging in case of further market stress.
Market Commentary
The limited duration CEF Barings Global Short Duration High Yield Fund (BGH) released its shareholder report. For the last semi-annual period the fund earned $0.1533 per month versus its distribution of $0.1056 i.e. distribution coverage of 145%. The fund’s NAV NII yield is 10.73% and 12% on price.
It has to be said that some of this is pure optics. For example, the fund holds $2m of a 9.63% 2030 Ford bond. The bond was trading at a price of 144% (including accrued) at the end of the year (the period covered by the shareholder report) which translates into a yield to maturity of around 3.5% however the bond’s yield as it shows up in the fund’s income statement is 6.7% (i.e., 9.63% x 100 / 144).
The fund has a lot of similar bonds with coupons in the high single digits so there is little chance its portfolio yield is in double-digits – something like 7-8% is more like it. The fund cut its distribution by a quarter in mid-2020 due to a deleveraging – it cut its borrowings by 40%. Since then it scaled its borrowings by 45% so it’s surprising they haven’t upped the distribution.
The fund also marginally shed borrowings in the second half of 2021 by about 12% (moving its leverage from 30 to 27.5%) which, in retrospect, was a good move given the direction of bond prices since then. The YTD total NAV return is -3.2% which is better than all the PIMCO taxable funds, for example. It has a quarter of its portfolio in floating-rate assets which have recently received an income boost from rising short-term rates. Portfolio allocation is pretty low-quality so it does require some conviction on the part of investors that the macro cycle is not about to topple over.
The valuation of credit CEF BNY Mellon Global Credit Income 2024 Target Term Fund (DCF) has finally rightsized and it’s trading at an attractive level at a 6.1% discount – roughly in line with the loan sector average.
Systematic Income CEF Tool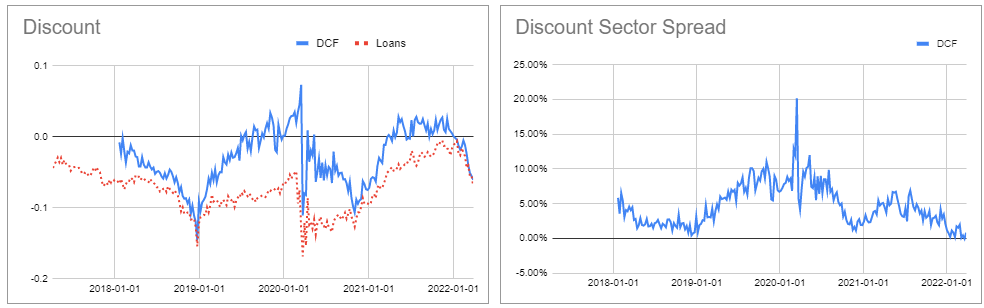
The idea here is that as a 2024 term fund it has a decent chance of being terminated i.e. the discount should move to zero. The fund is roughly 40% bonds / 60% floating-rate assets like loans and CLO Debt. NII has been stable and has already risen given the moves in short-term rates.
The key idea here is that all else equal you’d rather be holding a term fund at an X discount versus a perpetual fund at the same discount because the term fund offers potential upside in the form of discount compression to zero and, even in the scenario that the fund cancels the termination (via a shareholder vote) and doesn’t offer an exit at NAV, the term fund’s discount shouldn’t move a whole lot since it’s already trading at a discount equal to that of the perpetual funds. This is particularly the case for a fund like DCF which has put up sector-beating historic total NAV returns.
PIMCO and Nuveen coverage and UNII numbers for February were released and updated in our investor CEF Tool. PIMCO tax-exempt fund coverage continued to fall slightly – funds are down about 3-10% in coverage terms over the past year. Keep in mind this is in a period of flat leverage costs so this is expected to accelerate since short-term rates have only recently started to rise.
Systematic Income CEF Tool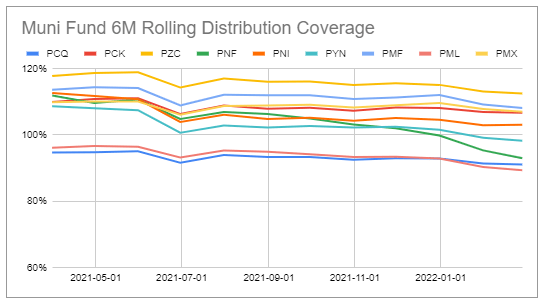
Taxable PIMCO coverage was generally OK except for PGP whose 6-month rolling coverage fell to 83% from 109%. (PDO) coverage and UNII has remained sky high – we would expect (PAXS) numbers to be similarly high (assuming its leverage has actually scaled up) when its numbers are released.
Systematic Income CEF Tool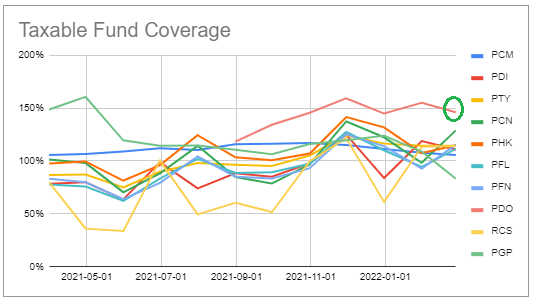
Stance And Takeaways
The Loan CEF sector halo has disappeared very quickly. The sector discount was trading wider relative to the broader market over 2021 but quickly closed the gap into year-end and moved out to trade at a tighter level in the first few months of the year just as concerns over rising rates were gaining momentum.
Since then, however, the sector discount has sharply underperformed the CEF market as shown below. It’s not obvious why this would be the case since the speed of interest rises has only gathered speed. It could be due to a simple reversion of what were pretty expensive discount levels at the start of the year or it could be due to some investors expecting loan CEF prices to gain outright rather than deflate more slowly than an average CEF.
Systematic Income CEF Tool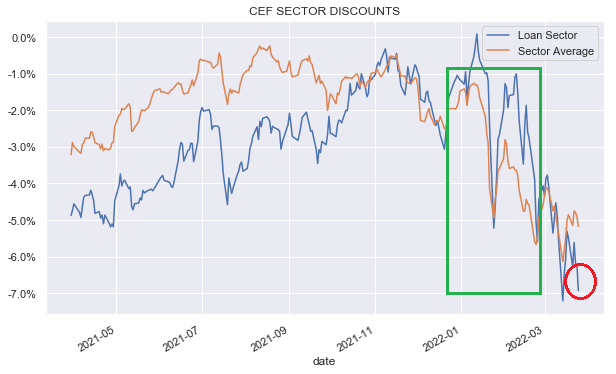
The chart below shows how different CEF sectors (excluding MLPs for clarity) stand on the basis of their year-to-date total NAV returns (x-axis) and their discounts (y-axis). The chart shows that loan funds have put up the best NAV performance so far this year (again, ex-MLPs) but are now trading at one of the widest discounts – an odd combination. In our view, the sector is now trading at an attractive valuation after being unattractive for the past 6 months or so.
Systematic Income CEF Tool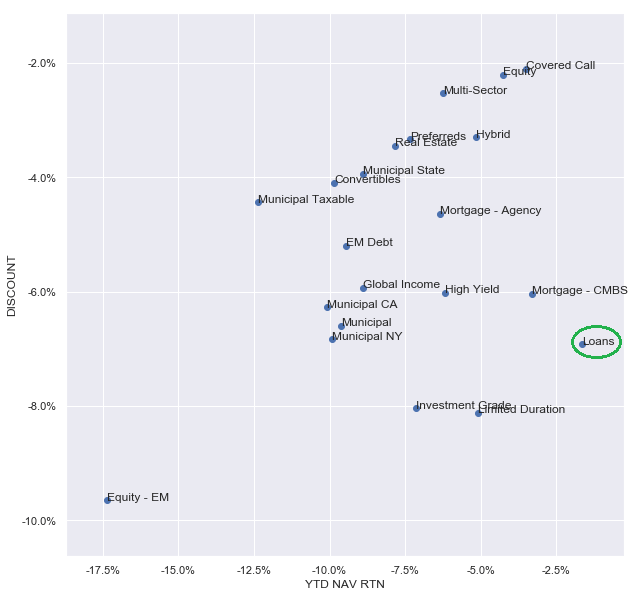
Outside of US-centric crises, loans have tended to remain resilient during global risk-off episodes as the following table shows.
TCW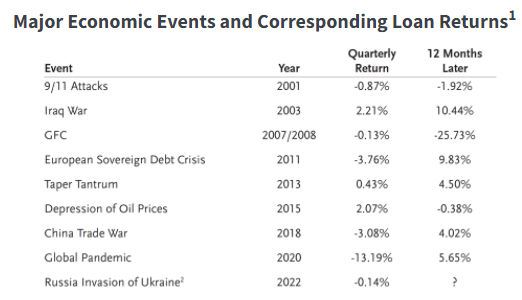
Within the sector we see value in the Apollo Tactical Income Fund (AIF), trading at a 12.3% discount and 7.3% current yield as well as the Ares Dynamic Credit Allocation Fund (ARDC), trading at a 12.2% discount and 8.5% current yield. Both funds have also outperformed the sector by a significant margin over the longer-term.
At the same time investors should keep some dry/drier-powder holdings since, as we discussed above, corporate bond credit spreads and loan discount margins are not yet outright cheap. The recent commentary by the Fed where it explicitly acknowledges a plan to overtighten to bring inflation under control presents a non-trivial risk of a recession sometime over 2023. And while this is not our base case it poses some risk to credit and equity funds.
Be the first to comment