


cemagraphics/iStock via Getty Images
Written by Nick Ackerman, co-produced by Stanford Chemist. This article was originally published to members of the CEF/ETF Income Laboratory on March 23rd, 2022.
The most challenging time to buy an investment is when it keeps making lower and lower lows. Often though, that’s when the best opportunities are made. CBRE Global Real Estate Income Fund (NYSE:IGR) is one fund I’ve been covering for a while now. Despite an interest in the fund, I’ve never been compelled to take that next step of initiating a position. However, with the latest weakness and discount remaining wide, it has piqued my interest just a bit more.
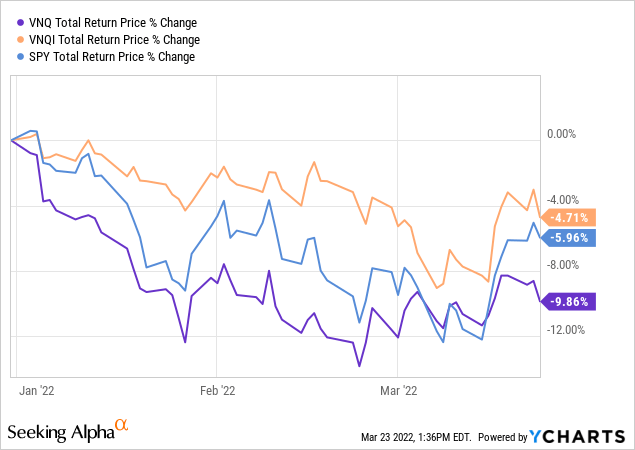
The fund holds a basket of REITs with a tilt towards global real estate investments. Taking a look at some performances of ETFs that track the sector, we can see the weakness is apparent. Below, we are looking at the Vanguard Real Estate Index ETF (VNQ). We are also using Vanguard Global ex-US Real Estate Index ETF (VNQI) to measure the global real estate market. Finally, we include the S&P 500 ETF (SPY) for some context.
We see below that VNQ has performed at the bottom on a YTD basis relative to these two other ETFs.
Ycharts
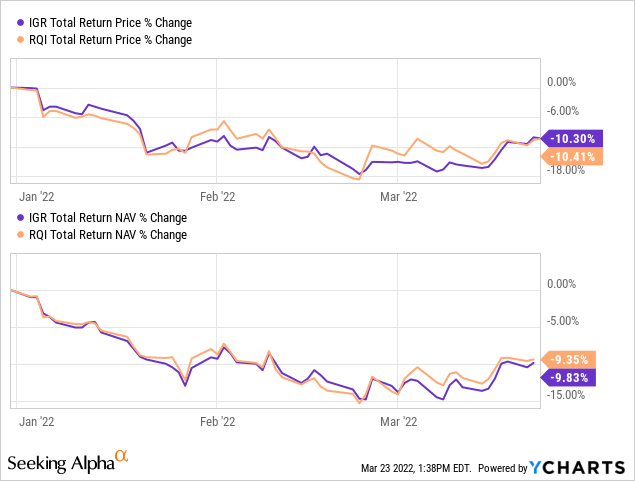
Interestingly, when we compare IGR to Cohen & Steers Quality Income Realty Fund (RQI), we see that they have performed quite similarly on a YTD basis.
Ycharts
Over the longer run, RQI has completely stomped IGR, so seeing such similar performances could indicate that global real estate is getting some love. Of course, I believe RQI is the gold standard, so it isn’t too surprising to see RQI still holding up reasonably well – or at least similarly to VNQ above even though they are leveraged. It seems that RQI is at the most significant disadvantage when the market panic selling, such as in March 2020. It is at those times when VNQ generally outperforms.
At the same time, IGR’s discount is materially wider than RQI’s at this time. In the end, I would replace RQI with IGR, but there is a real possibility that I could see myself adding to IGR sometime soon.
That is despite my previous article acknowledging that the fund’s discount had already tightened relative to the previous update before that. In this case, the overall decline on top of the discount at this time is what is getting me more interested after taking a pass previously.
There’s a lot of “ifs” going into IGR at this time. IF global real estate can outperform, IF the economy does well, IF the management selects the correct positions, then we could see something like IGR exceeding RQI. I don’t particularly see that being the case, and I will personally stick with RQI.
On the other hand, I’m looking to increase my own international exposure for diversification as valuations remain attractive. So I believe the counterargument could be just as compelling. My main hesitation now is that the fund’s discount is already quite tight from where it had been historically.
The Basics
- 1-Year Z-score: 2.25
- Discount: 5.57%
- Distribution Yield: 8.33%
- Expense Ratio: 1.24%
- Leverage: 26.18%
- Managed Assets: $1.426 billion
- Structure: Perpetual
IGR invests with an objective of “high current income, and its secondary objective is capital appreciation.” They do this by investing “globally with an emphasis on the income-producing common equity and preferred stocks of real estate companies.” They mention that “up to 25% of its assets in preferred shares of global real estate companies.” From when I’ve been covering the fund, preferred has only been a marginal allocation of the fund. For example, at the end of 2021, the preferred stock exposure made up 6.6% of the fund.
We also see that they write options on positions in their portfolio. That’s not unheard of but is more unusual when a fund is also utilizing leverage. Options contributed to the fund’s gains in the previous available Annual Report.
The fund is fairly large, with over $1.4 billion in total managed assets. Even excluding the leverage, the net assets are over $1 billion for the fund. That has translated into a fair bit of liquidity for investors, with an average of almost 370k shares traded a day. That’s a fairly hefty amount, relatively speaking when compared to other CEFs.
The fund’s expense ratio is rather reasonable. When including leverage, it comes up to 1.46%. They increased their credit limit over 2021 as well; they can borrow a max of $400 million. Based on the latest data provided at the end of February 2022, they have just over $373.234 million outstanding. Higher than the ~$320.488 million at the end of 2021 means they’ve been piling into some new investments. That could be a great thing considering that the prices are lower than three months ago.
On the other hand, this is another important metric to watch with higher interest rates coming. Their borrowings are based on a floating rate that targets the Federal funds rate plus 75 basis points. That’s one point for RQI in this regard, as they also have floating rate-based debt, but they have incorporated swaps to hold their rate steady for ~4 years.
Performance – Weaker Long-Term Results
As I briefly mentioned above, the longer-term results for IGR have been rather lackluster when compared to peers. So if one is investing now, I think they have to be fairly confident that the discount is attractive and expect global real estate to perform better going forward. While I want to believe that, my gut keeps telling me to stay invested with RQI, so that’s why my approach would be to potentially add in IGR alongside RQI.
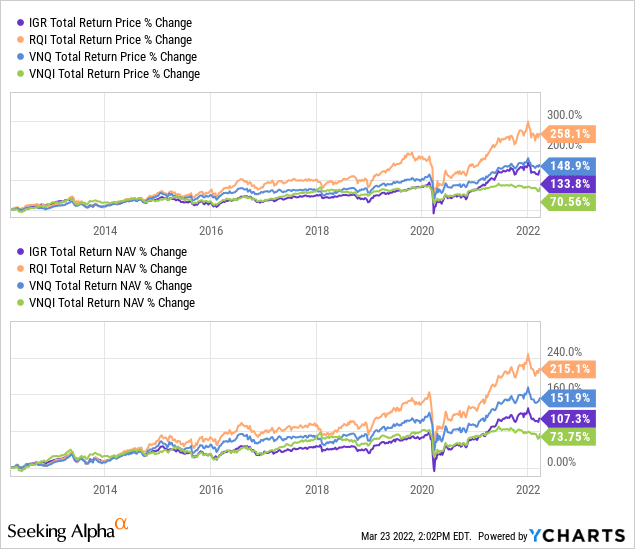
Below are returns comparing the last 10-year total returns with the funds we compared above; IGR, RQI, VNQ and VNQI. On a brighter note, IGR still carries a substantial weighting to U.S. real estate investments. That had translated into their performance topping out VNQI. However, it seems that it was merely a more recent development.
Ycharts
That also doesn’t touch on why we buy funds such as IGR and RQI; it is for the higher payouts they can offer. They do this by paying out gains along the way. VNQ and VNQI could replicate that if you sell yourself, but with IGR and RQI, this is just passively happening without selling any of your shares. Of course, that’s the main argument that seems to come up when comparing CEFs to ETFs. It’ll be a never-ending discussion that only continues to go around in circles as investors have different objectives and goals.
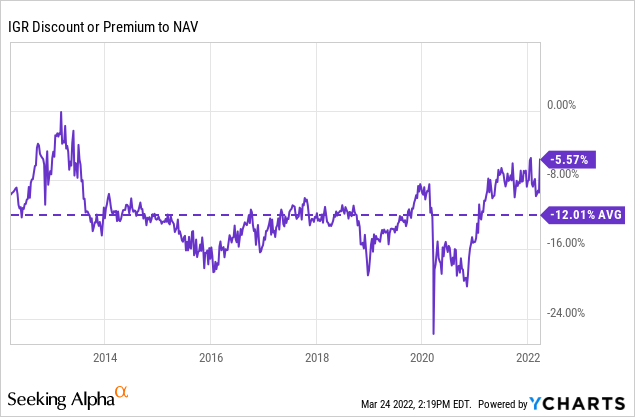
Looking over the last ten years, IGR’s discount is narrower than the average in that period. In fact, just over the last couple of days, this discount has narrowed materially. That is something to consider before investing. It comes down to thinking if the combination of the latest overall declines in the sector/market makes it attractive. In my opinion, this scenario is making it appealing.
Distribution – Investors Get A Bump
In completely unexpected news, IGR has bumped up its monthly payout to investors. They were previously paying $0.05 per month but have now initiated a $0.06 payout per month. This works out to a distribution yield of 8.33%. On a NAV basis, it comes to 7.75%.
The fund only has one distribution cut in its history as well. It is substantial, but considering it was 2008/09, I wouldn’t criticize it too much.
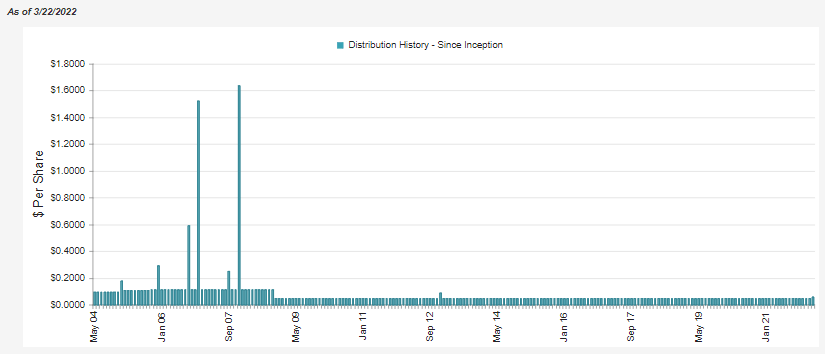
IGR Distribution History (CEFConnect)
The fund will rely on capital gains to fund their distribution; that’s why it comes as a bit of a shock. Apparently, they feel fairly confident in being able to pay a higher distribution despite the general softness.
On the other hand, the tremendous amount of realized and unrealized gains from 2021 could have pushed them into this decision. They didn’t pay a year-end despite the gains realized last year.
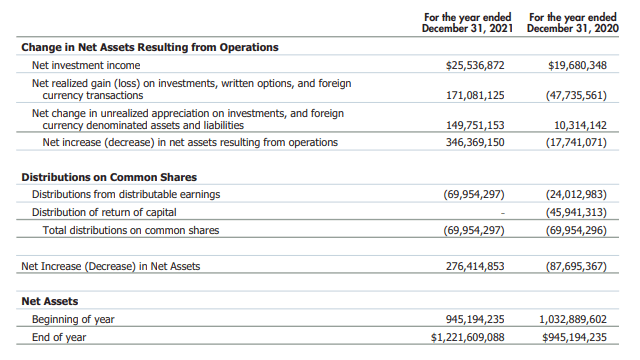
IGR Annual Report (CBRE)
Net investment income coverage for the prior fiscal year itself was 36.5%. That’s why capital gains will be required if they want to close that shortfall. With the higher distribution going forward, that would work out to roughly $84 million required for distribution payouts being paid to shareholders over the next 12 months. That is based on the new $0.06 monthly amount and 116,590,494 shares outstanding.
For tax purposes, in 2021, a significant majority of the payout was classified as long-term capital gains. That isn’t too surprising given the earnings we see above.
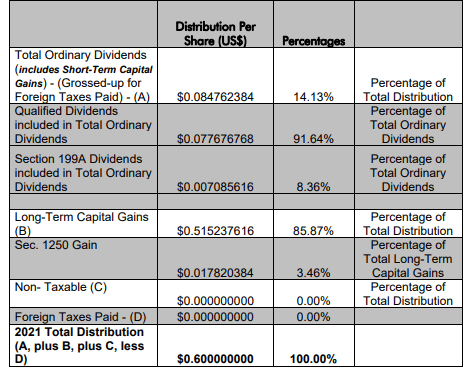
IGR Tax Classifications (CBRE)
On top of that, the portion that was identified as ordinary income worked out to 91.64% of that smaller allocation being qualified dividends or section 199A dividends. These can both be fairly tax-advantaged for an investor. That makes this fund appear to be appropriate for a taxable account. However, every individual will be different.
IGR’s Portfolio
The portfolio turnover is relatively high. That can mean they are making many changes, so it could have already changed somewhat drastically when we look at the fund’s positioning. That’s a downside of CEFs is they aren’t necessarily the most transparent in terms of what they are holding and updating those holdings.
IGR is actually fairly active in this regard, as they update the data monthly. Others only update positioning quarterly. The last reported turnover for IGR was 78.44%. Over the last five years, it has been as low as 44.97% and as high as 124.07%.
At the end of February, the portfolio was positioned roughly 65% in U.S. holdings (when combining the U.S. preferred portion) and 35% elsewhere around the globe.
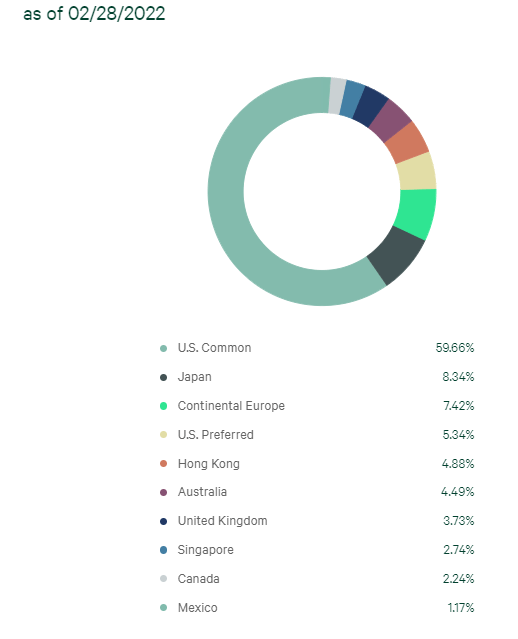
IGR Country Weighting (CBRE)
This was mostly similar to the last time we took a look at the fund. Weighting in Japan had inched up, but so did the U.S. common allocation marginally, so it came from elsewhere in the fund.
Looking at the sector allocation of the underlying real estate portfolio shows us the fund is fairly diversified. Residential, retail and industrial REITs make up the largest allocations, but plenty of other sector exposure is also represented.
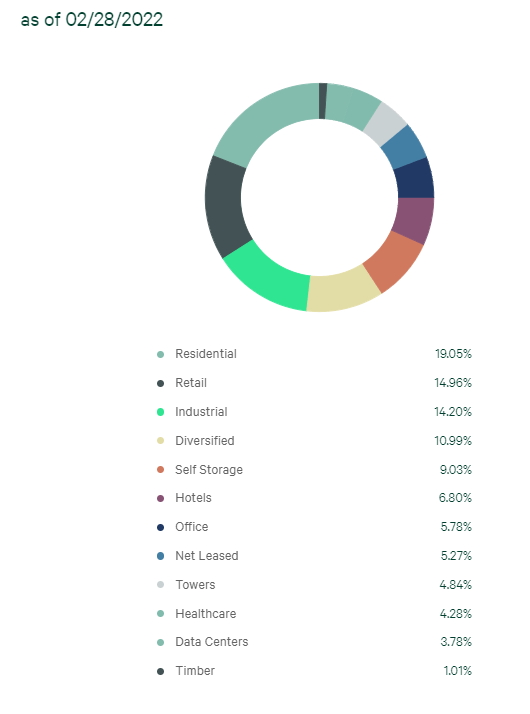
IGR Sector Weighting (CBRE)
In this case, residential exposure had actually climbed up a couple of points from 16.55%, where it was at the end of October 2021. Retail exposure also climbed a bit higher, and industrial exposure slipped a bit. It had previously had industrial exposure as the second-largest weighting in the fund.
One thing that should be noted is that this fund holds a fairly concentrated portfolio. They have a total of 83 holdings. According to Cohen & Steers, RQI holds 188 positions.
Chances are higher that if IGR has been selected successfully, they could easily outperform. However, the opposite is also true. If they pick poorly, they can easily underperform again. This happens because each position in IGR becomes more critical the more concentrated the portfolio.
It isn’t surprising to see the top ten holdings in IGR comprise 46.12% of their total assets. Taking this further for comparison’s sake, despite RQI holding more than double the number of positions in their portfolio, RQI’s top ten also make up a weighty 44.8% allocation.
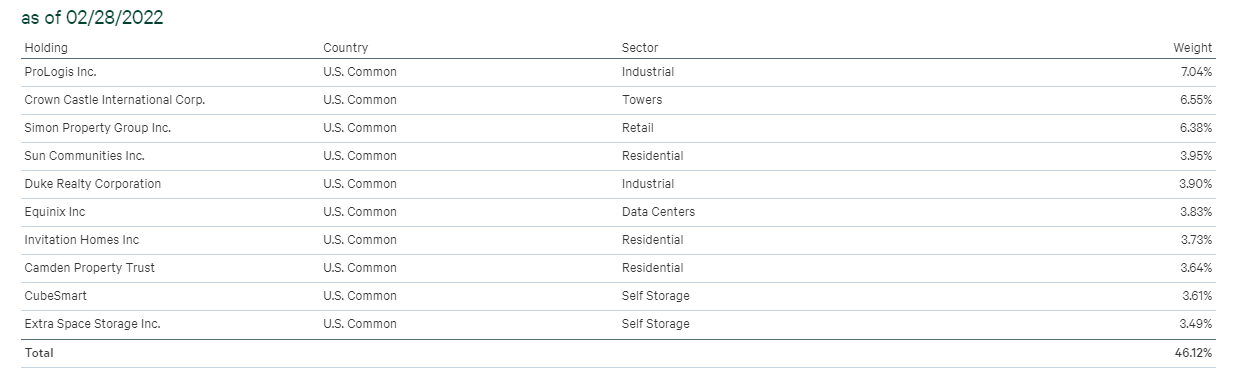
IGR Top Ten Holdings (CBRE)
Since the top ten comprises all U.S. positions, most real estate investors will find a lot of these names familiar. I almost wish they would have put an even greater emphasis on international positions to set the fund further apart.
Since our last update, one of the notable changes is that American Tower Corp. (AMT) is no longer in a top position in the fund. It had previously been the number one position at a 7.46% weighting. Crown Castle International Corp. (CCI) had come in the number five spot with a 4.41% exposure, which has now taken the crown of the number one spot.
One of the contributing factors here was the performance between the two positions. CCI hadn’t performed exactly at a level where you would want to brag, but it had outperformed AMT quite materially. The period below is from October 31st, 2021, to February 28th, 2022. That marks from the last time we looked at the top ten to the last time the list has been made available.
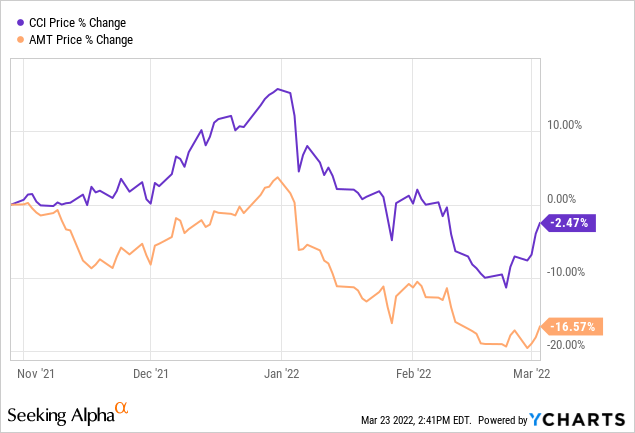
Ycharts
Conclusion
IGR has continued to catch my interest and, with the latest declines, is looking a bit more appealing than the last time I covered the fund. Since that period, the discount has hardly moved but has remained relatively narrow relative to the longer-term average. So it is really the combination of the declines in the broader sector and market in tandem with the discount that makes it quite appealing. At the same time, I remain hesitant to unload RQI in favor of IGR fully. If initiating a position, it would be alongside continuing to hold my RQI position.
Be the first to comment