

alexsl
“Next verse, same as the first.”
– Herman’s Hermits
This is now the third consecutive quarterly letter in which we express a cautious stance toward both the global economy and financial markets. At this point, perhaps “cautious” is too mild a descriptor.
For the first six months of the year, commodities were the only primary asset class to offer a positive return. As of July, there was truly “no place to hide.”
In the third quarter, commodities joined U.S. and international equities, U.S. Treasury bonds, and gold delivering a negative return. Commodities played catch up to the downside – they were the worst performing primary asset class in the third quarter down 10.9%. The Barclays Aggregate Bond Index held up “best” down 4.7%. U.S. equities fell 4.9% and global equities were down 7.2%.[1] “Safe-haven” assets, typically go-to investments in periods of economic and financial stress, fared even worse. Long-dated U.S. Treasury bonds and gold continued their poor performance in the third quarter. Gold was down 8.2% and Treasury bonds lost 10.3%.
This brought year-to-date totals through September 30th to: commodities +19.8%, gold -8.1%, Barclays Aggregate Bond Index -13.8%, U.S. equities -24.4%, global equities -26.1%, and the U.S. Treasury long-bond -28%.
Through September, a 60/40 benchmark was down 20.1% for the year. Grey Owl’s All-Season[2] strategy finished the same period down 12.9%.[3]
Economic Growth
To summarize the state of the U.S. economy, we again present the U.S. ISM Manufacturing Purchasing Manager Index (PMI)). Slowing since November of last year, the deceleration continued into September and is now teetering on a contractionary reading. The ISM PMI is a reasonably accurate leading indicator of overall economic growth. Its persistent slowdown continues to portend a decelerating U.S. economy.
Figure 1 – US ISM Manufacturing PMI[4]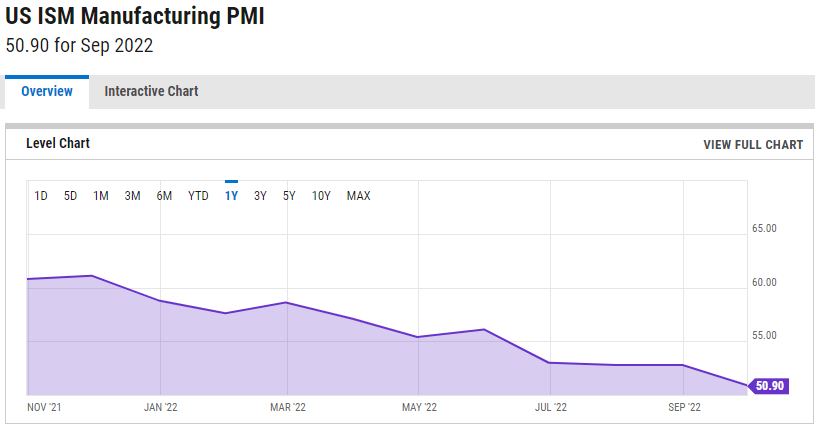
Corporate Profits
Last quarter, we indicated our belief that “downward revisions in earnings are probable. Until that occurs, continued pressure on equities and other risky financial assets remains likely.”
At the end of June, consensus expectations for S&P 500 (SP500) full year 2022 operating EPS was $224.54. We pointed out that this implied 12.6% annual growth from the 2019 level of $157.12 (pre-Covid) high in EPS. That expectation was almost DOUBLE the 5.7% annual earnings growth from 1999 to 2019.[5] We were (and are) skeptical of that rate of growth now that the trillions of dollars of Covid-related government direct subsidies to businesses and transfer payments to individuals are gone.
Fast forward to today, and downward revisions have finally begun. At this point, they are still modest. Now, the consensus expects $206.74 full-year 2022 operating earnings. While this number is down a considerable amount from the $224.54 expectation earlier in the year, it is only down a bit from the actual $208.21 in 2021.
Further, actual earnings are beginning to reflect the new lower consensus (and are likely pushing expectations even lower). As of October 28, just over half (251) of all S&P 500 companies have reported and earnings are down 3.2% compared to last year.
While the process has begun, until more meaningful revisions occur, we expect continued pressure on equities and other risky financial assets.
Investor Sentiment versus Positioning
To further emphasize the disconnect we see between expectations and the developing reality of slower growth, let’s look at investor “sentiment” compared to “positioning.”[6]
Broad market indices such as the S&P 500 have been in a downturn since late December 2021. More speculative small capitalization technology stocks, crypto-currency related securities, and “lock-down” beneficiaries began their fall way back in early 2021.[7] Some lockdown-beneficiary stocks are down 80%+. For example, Peloton (PTON) is down 95%[8] from its peak.
After multiple quarters of declining prices, financial news and “surveys” show a significant majority of investors exhibiting a “bearish” outlook. Given the elapsed time and the current tone, one might think the bad news is priced in and there is no one left to turn bearish.
Unfortunately, “bearish sentiment” does not show the full picture. Verbal gauges of sentiment are far less informative than actual investor positioning. On that front, investors still appear quite complacent, if not, bullish. The monthly asset-allocation survey by the American Association of Individual Investors shows equities continue to make up well over 60% of a typical portfolio. As the chart indicates, this level has dropped to the low-40s before prior bear markets found a bottom.
Figure 2 – Asset Allocation Survey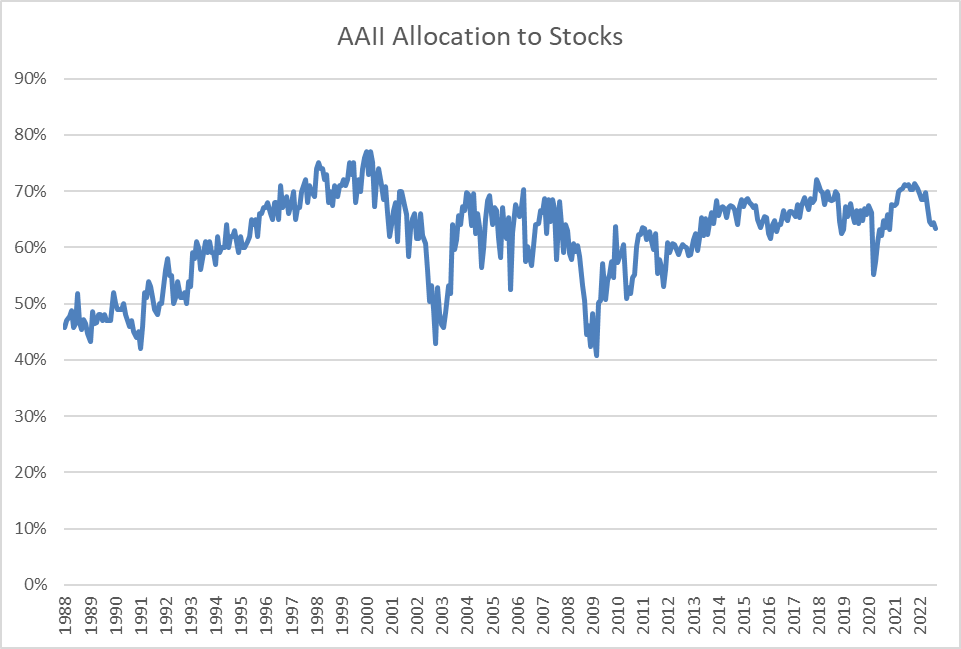
Fixed Income Update
Last quarter, we described our error of increasing exposure to safe-haven U.S. Treasury bonds and gold too early. With economic conditions continuing to deteriorate and inflation beginning to ebb, we suggested a turning point could be near. We were wrong again.
Growth continues to slow (see the ISM chart earlier in this letter) and forward gauges of inflation (see the commodity index chart below) are trending lower. We still believe that at some point in the current cycle of slowing economic growth and slowing inflation, U.S. Treasury bonds will provide a positive return.
Figure 3 – TradingView.com; GSCI Commodity-Indexed ETF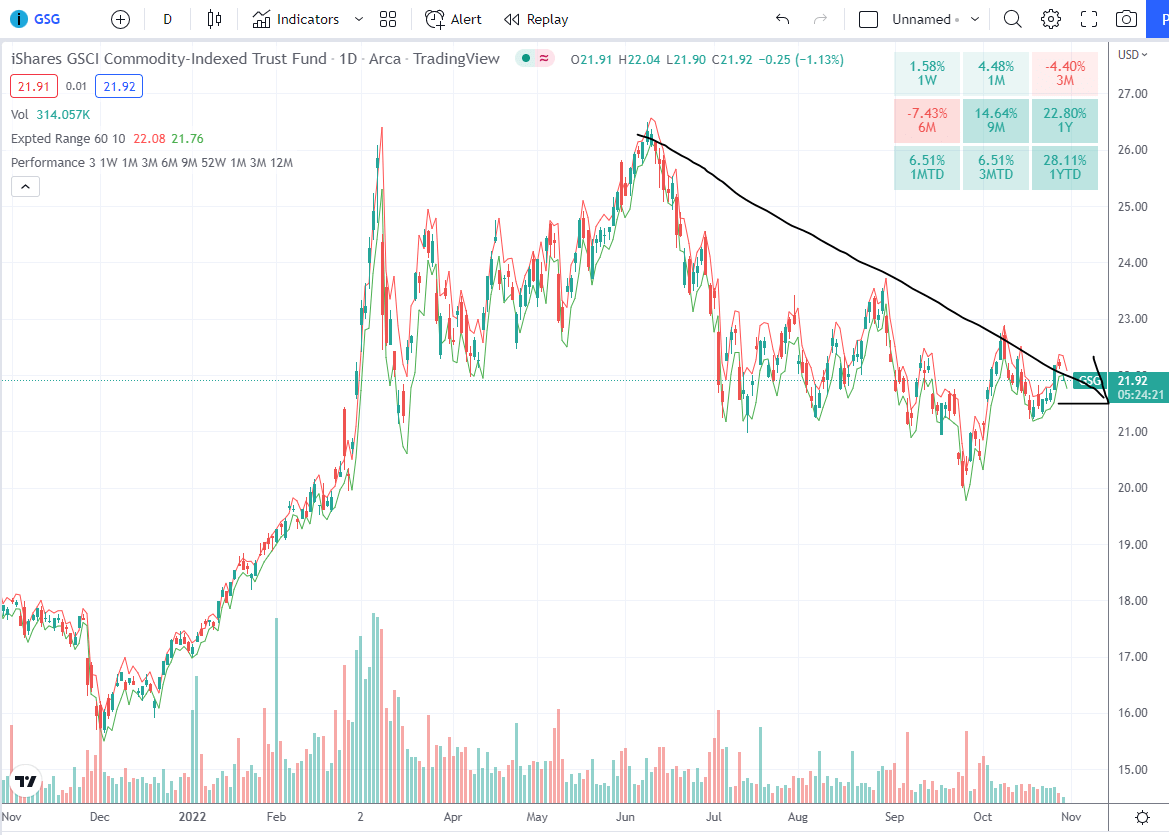
Not wanting to be stubborn, our fixed income position is more moderate now, but we are watching closely for an opportunity to increase exposure in this area.
Positioned for Continued Economic Deceleration and Market Volatility
Since the end of 2021, we have positioned the Grey Owl All-Season portfolio for a risk-off environment. That action continues. Our “safe haven” positions, particularly our cash allocation, are the largest they have ever been.
We are acutely aware that markets will shift toward growth and risk-taking long before that becomes obvious in the reported economic data. When market internals begin to strengthen and sentiment indicates a nadir, we aim to quickly move to a more aggressive, risk-oriented posture. The season continues to call for caution, patience, and preservation of capital.
For now, “next verse, same as the first.”
Grey Owl Capital Management
Grey Owl Capital Management, LLC
[1] We refer to U.S. equities, long-dated U.S. Treasury bonds, gold, and commodities as “primary” asset classes borrowing the language of HCWE & Company. The idea is that these four assets best capture two variables that explain a significant amount of asset price movement: global growth (explained by investor risk sentiment) and inflation. This framework is the basis for a permanent portfolio, an “all-season” portfolio, risk-parity, etc. U.S. equities and commodities are “risk” assets, while U.S. Treasury bonds and gold are “haven” assets. The market (or asset class) returns are measured on a total return basis using index exchange-traded funds (IETF): SPY for the S&P 500, ACWI for the MSCI All-Country World Index, GSG for the S&P GSCI Commodity Index, TLT for 20+ Year Treasury Bond index (i.e. “long-dated” US Treasury bonds), and GLD for gold.
[2] Despite the generic and frequent use of the term, we renamed our strategy Grey Owl All-Season after Bridgewater Associates requested we do so claiming it conflicted with a strategy they call All-Weather.
[3] The Grey Owl All-Season strategy performance is taken from an individual representative account. The 60/40 benchmark is 60% ACWI and 40% AGG for the iShares Core U.S. Aggregate Bond ETF.
[5] Annual growth calculated on a compound basis.
[6] Hat tip to John Hussman: Are We There Yet?
[7] ARK Innovation ETF (ARKK) had an intraday peak on 2/16/21.
[8] PTON closed at $7.69 on 10/26/22 and made an intraday high of $169 on 1/13/21.
Be the first to comment