

sshaw75/iStock Unreleased via Getty Images
Introduction
In this article, I want to discuss a number of important things, all of which will explain why I am a big believer in owning Caterpillar (NYSE:CAT) shares on a long-term basis for both income and outperforming capital gains. We will start by discussing current economic headwinds, which are pressuring shares of this Illinois-based machinery giant. However, while stock price weakness isn’t fun, it is offering new opportunities for what I believe is going to be a multi-decade tailwind for Caterpillar due to accelerating demand for (rare) metals on top of secular growth in construction. Basically, demand for metals is set to explode. On top of that, it will become harder to mine high-quality metal ores, which will require more equipment. Also, ESG trends support Caterpillar as it offers multiple ESG-friendly solutions like EV machinery and autonomous mobility. When adding CAT’s ability to turn high demand into shareholder value, I have little doubt that the CAT ticker remains the place to be. Moreover, even if you don’t care for CAT, I hope to present a good outlook for the mining/metal industry.
So, let’s look at the details.
Current Struggles
Caterpillar is currently trading close to 5% lower on a year-to-date basis. The stock is down roughly 20% from its 2021 all-time high close to $250. It’s important to discuss why that is before we dive into the longer-term outlook.
The answer is based on two words: growth slowing.
Various economic indicators peaked in the summer of 2021. One of them is the Empire State Manufacturing Index shown in the chart below. Whenever economic growth peaks, it does not mean that a recession is imminent. However, it does mean that (large) investors – let’s go with “smart money” – start selling into strength. After all, the risk/reward for cyclical stocks like Caterpillar is best when economic growth is bottoming, not when it’s peaking.
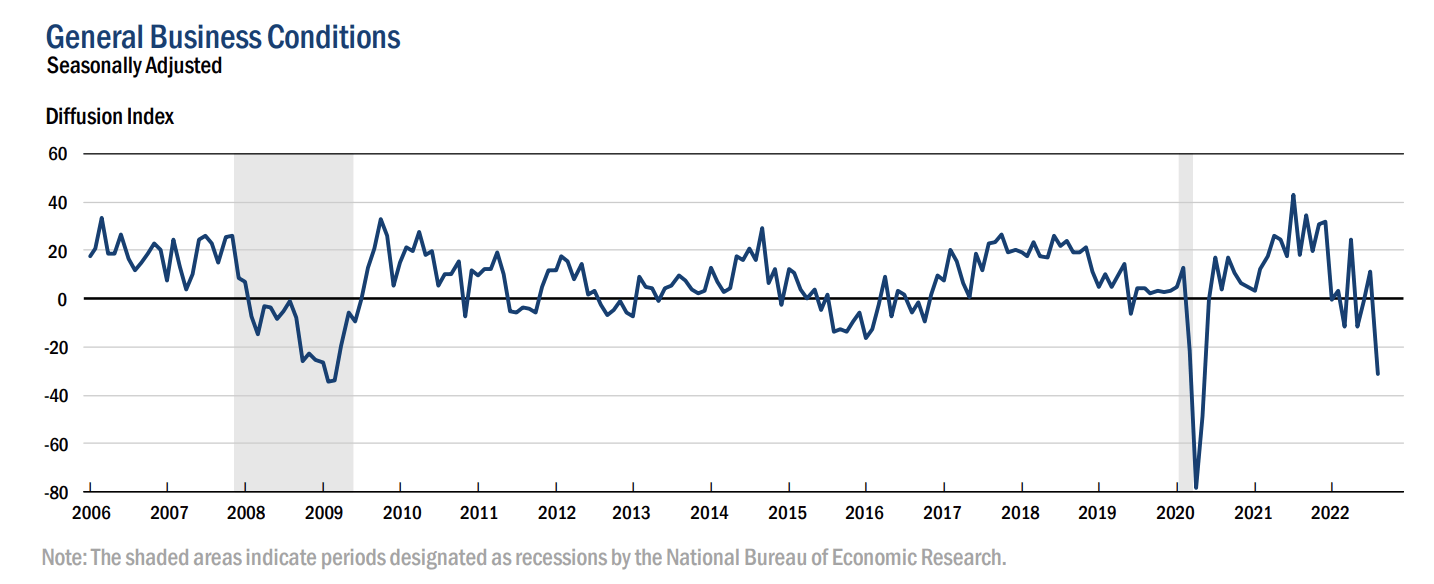
New York Fed
The chart above shows a very steep decline in business conditions. While one single indicator is volatile, it needs to be said that weakness is now all over the place.
For example, the Philadelphia Fed manufacturing index also started to contract. The data below does not yet include August data (no release yet). Yet, we see that both current activity and future activity are now contracting. Future activity is even worse than it was during 2015 (manufacturing recession).
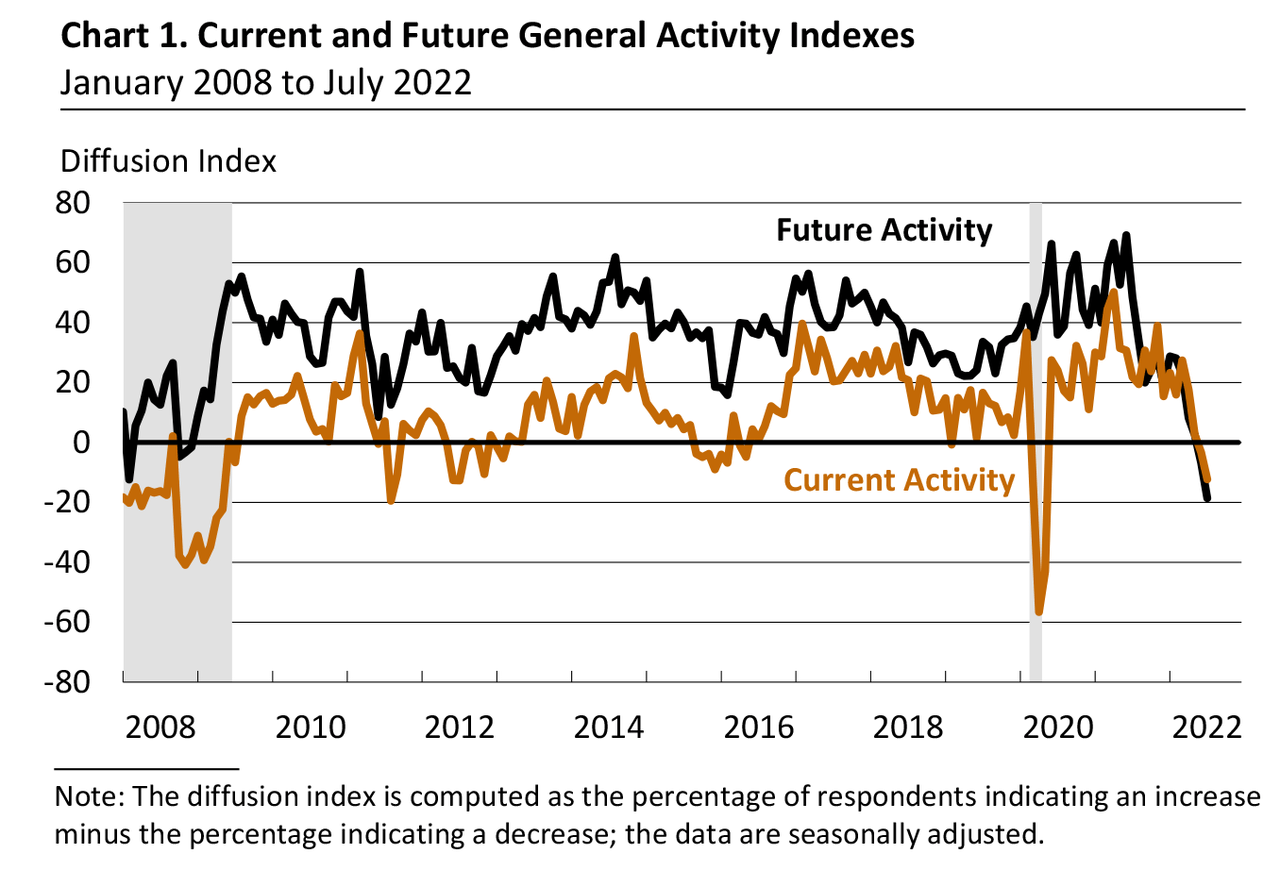
Philadelphia Fed
Looking at the graph below, we see the ISM manufacturing index (orange) and the Caterpillar share price. What we see is that whenever economic conditions peak, CAT loses steam. It does confirm what I mentioned at the start of the article, and it shows why CAT is weakening. It’s simply de-risking of larger portfolios from cyclical exposure into more defensive exposure. Whenever economic growth bottoms, buyers come back, causing CAT to surge.
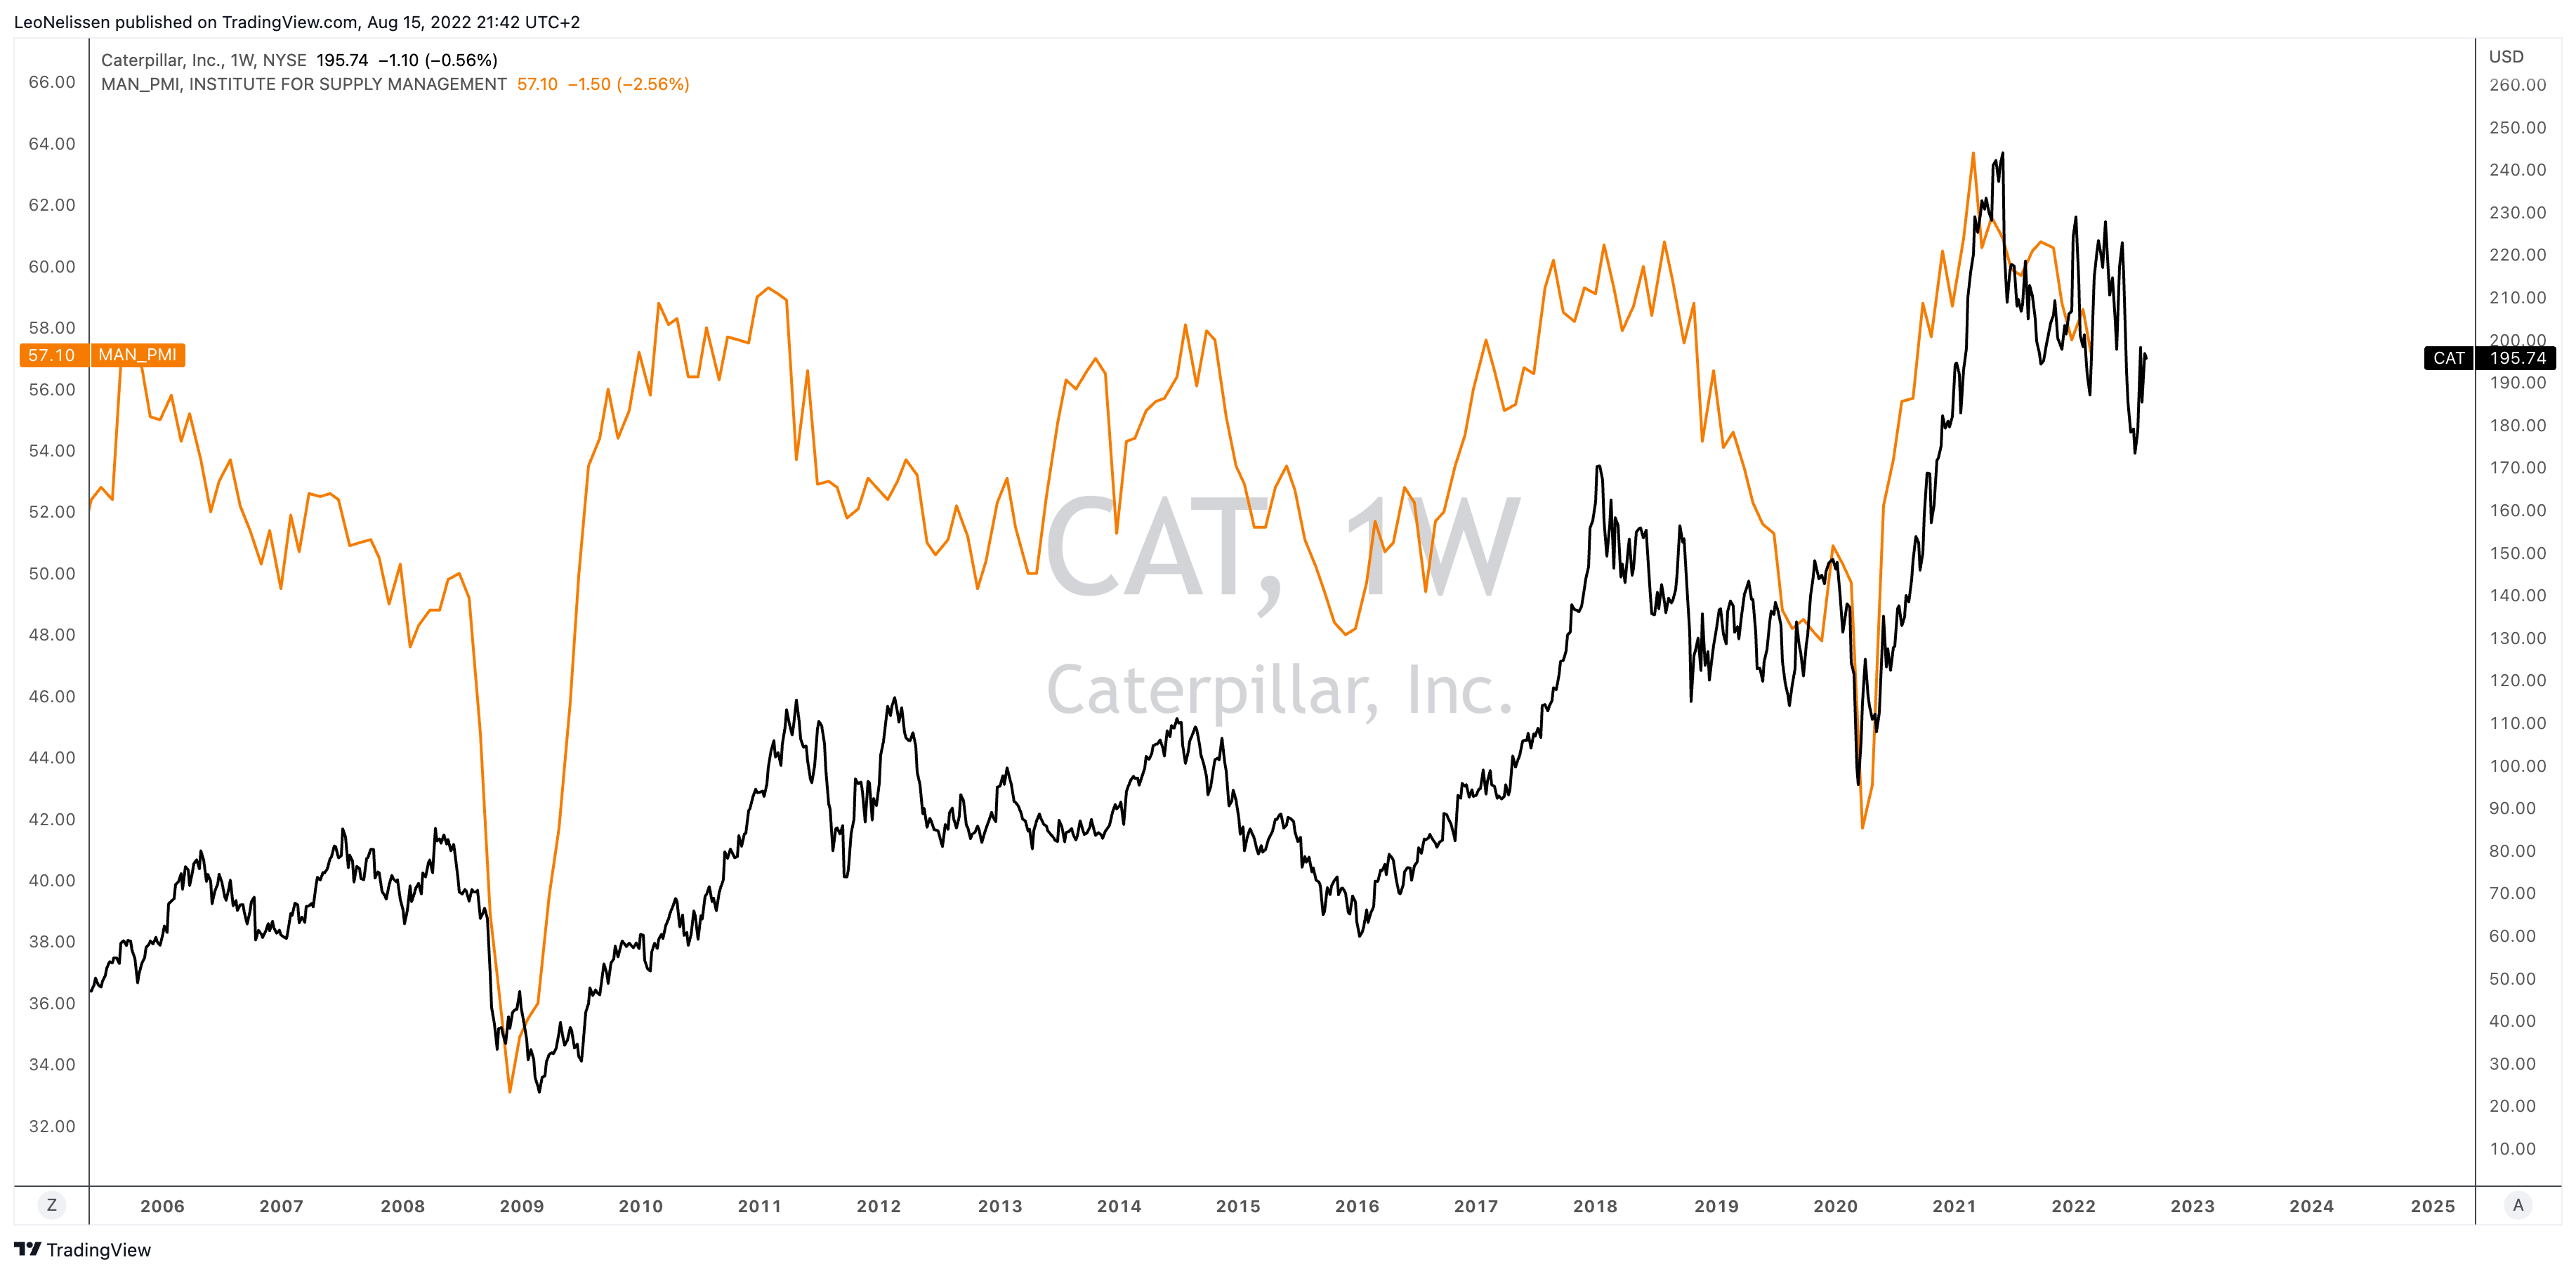
TradingView (Black = CAT, Orange = ISM Index)
The next chart also works, which compares CAT to the price of copper – often referred to as “Dr. Copper” because of its ability to “predict” economic growth.
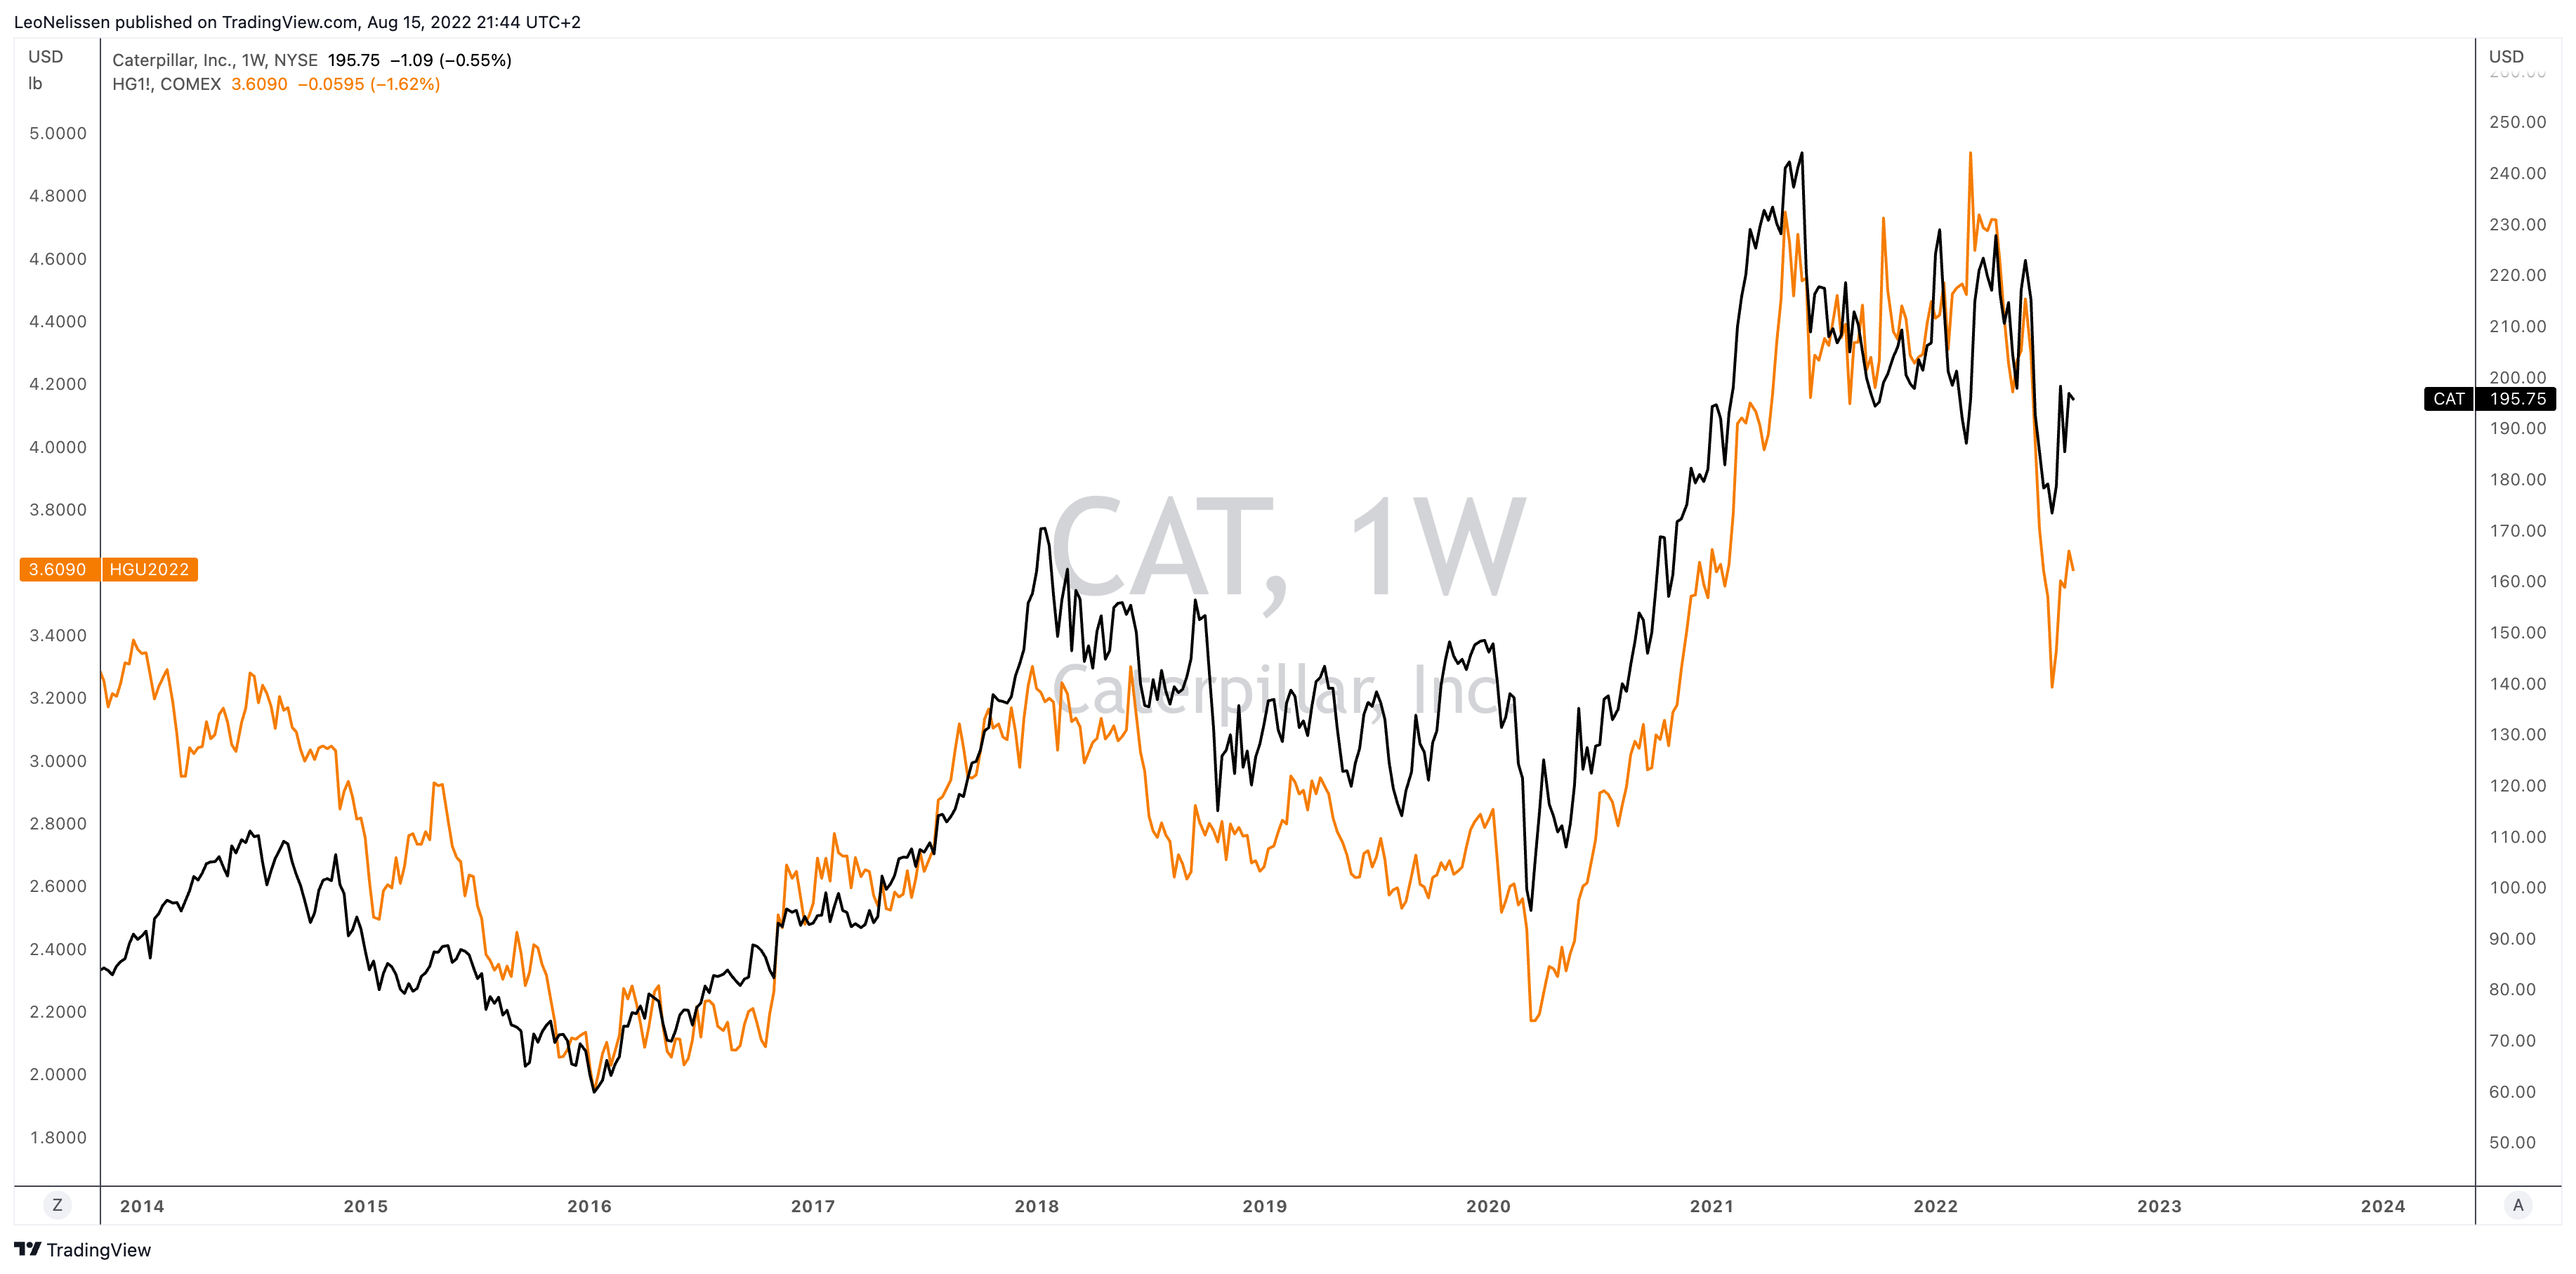
TradingView (Black = CAT, Orange = COMEX Copper)
In this case, economic weakness is caused by a toxic mix of related issues. For example, supply chain issues and high inflation have “destroyed” consumer confidence. Meanwhile, the Federal Reserve is determined to aggressively hike its rates to combat inflation, even if it means hiking into economic weakness.
What this means is fighting inflation by hurting demand. After all, the Fed cannot directly impact supply.
So, that’s why even CAT is now in a bad spot as it’s truly a tricky environment for the economy in general, to put it mildly.
While falling leading indicators (like the ones above) will almost certainly lead to lower economic expectations, the outlook was already somewhat weak. Using Wells Fargo’s outlook, we see expectations that real gross domestic product growth will fall to a mere 1.7% in 2022 followed by 0.4% contraction in 2023 as inflation is expected to fall to 3.5% with core inflation still hovering at 2x the Fed’s target. While these are expectations, it perfectly shows the challenges facing the economy. Not just in the US, I need to add here.

Wells Fargo
While all of this is “annoying” for shareholders of cyclical companies, it’s good as it always comes with good buying opportunities.
And that’s what I care most about, buying quality companies at good prices.
Especially when there’s a great long-term outlook. This brings me to the next part of the article.
Secular Mining Growth, A Huge Tailwind For CAT
We just discussed cyclical demand. Lower economic expectations reduce the short and mid-term demand for all kinds of metals due to lower production of cars, homes, electronics, and other items. Longer-term, however, we’re dealing with a strong secular growth trend.
One way to describe secular growth is as follows:
Secular growth occurs when something fundamentally changes within a sector or industry, creating a wave of new demand. Secular growth rates can be materially higher than cyclical growth rates, as secular growth depends on changes in customer behavior rather than changes in GDP.
The current secular growth trend is the energy transition. In order to achieve the Paris Climate Agreement goals, global economies have to transition from carbon-intensive energy sources to renewables. In its 2022 investor presentation, Caterpillar highlighted what this means for global metal demand. In 2020, demand for key commodities was roughly 7,000 kilotons. In 2040, demand could hit 15,000 kilotons. That’s roughly 3.9% compounding growth per year.
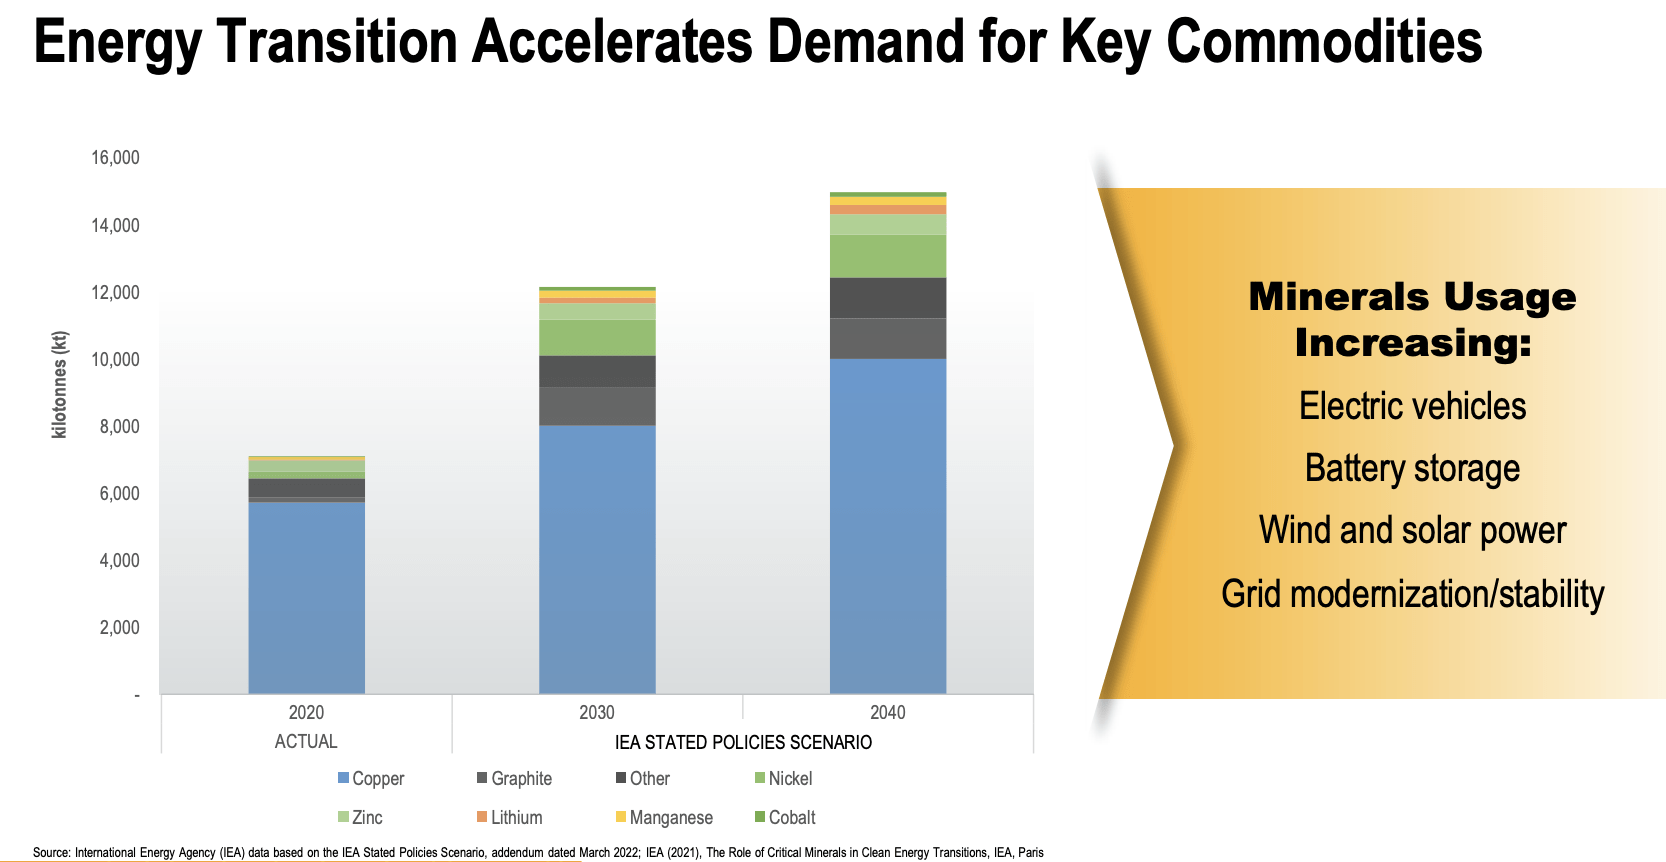
Caterpillar
This makes sense as sustainable energy comes with higher demand for electric cars, battery storage, wind and solar, and grid modernization. On top of that, we’re dealing with a rising middle-class in key countries like India, which is set to accelerate material demand.
While we can debate how “clean” these technologies really are, there is no debate that the world has chosen to go in that direction. And the numbers don’t lie.
The IEA estimates that an electric car uses roughly 210 kilograms of minerals per vehicle. A conventional car uses 40 kilograms. The same goes for wind and solar technologies, which require far more materials than coal and natural gas.
With that said, the expected 2040 demand under the STEPS and SDS scenarios predicts a significant shift (and increase) in metal demand. STEPS is basically what demand will look like if we continue the current adoption rate of renewables. The SDS scenario is required in order to reach the Paris Climate Agreement goals.
What we are dealing with is that more than 40% of copper demand will be used in “clean” technologies. The share of lithium is set to rise to 90%. The same goes for other metals that are often hard to mine. If you want a visualization of these trends, please visit page 7 of the IEA report. I cannot share their chart due to copyright reasons.
Moreover, I believe there is another angle to this already juicy bull case: geopolitical risks. Right now, European countries are debating on how to accelerate the energy transition to become independent from the Russian energy supply. The problem is that going all-in on renewables means becoming dependent on whoever supplies key materials. Right now, that’s China.
Using the EV supply chain as an example, China dominates material processing of almost every single key material. According to the IEA:
China dominates production at every stage of the EV battery supply chain downstream of mining. Three-quarters of battery cell production capacity is in China, with the same for the specialized cathode and anode material production, for which China accounts for 70% of cathode and 85% of anode material global production capacity. Over half of global raw material processing for lithium, cobalt and graphite also occurs in China. With 80% of global graphite mining, China dominates the entire graphite anode supply chain end-to-end.
As the chart on page 28 of this presentation shows (no chart in this article due to copyright reasons), China’s influence can be reduced significantly in all key materials on a long-term basis.
The geographical distribution of mineral extraction is unlikely to shift significantly in the near term given today’s project pipeline. However, when comparing current mining production to mineral reserves (reserves refer to the resources which could be economically extracted at the time of determination), there appears to be significant unrealized potential for diversification of extraction in the longer term.
While this is a long-term trend, I think this is necessary as no country can be allowed to dominate any energy-related supply chains. Hence, I believe that we will encounter a wide range of small-scale mining operations in various countries. It will be capital intensive, but a huge win for providers of mining equipment. Additionally, I believe that buying equipment providers is better than buying small(er) miners anyway as these miners often come with significant risks like production and local political risks – most miners will be located in countries with less-than-optimal political stability, to put it mildly.
While both the secular growth trend in metals and more diversified mining will cause mining equipment demand to accelerate, we also need to incorporate lower ore quality. Using the bigger metal in terms of mined volumes, copper, we’re dealing with a 30% increase in material to mine an equal amount of copper in the 10 years ahead according to Caterpillar.
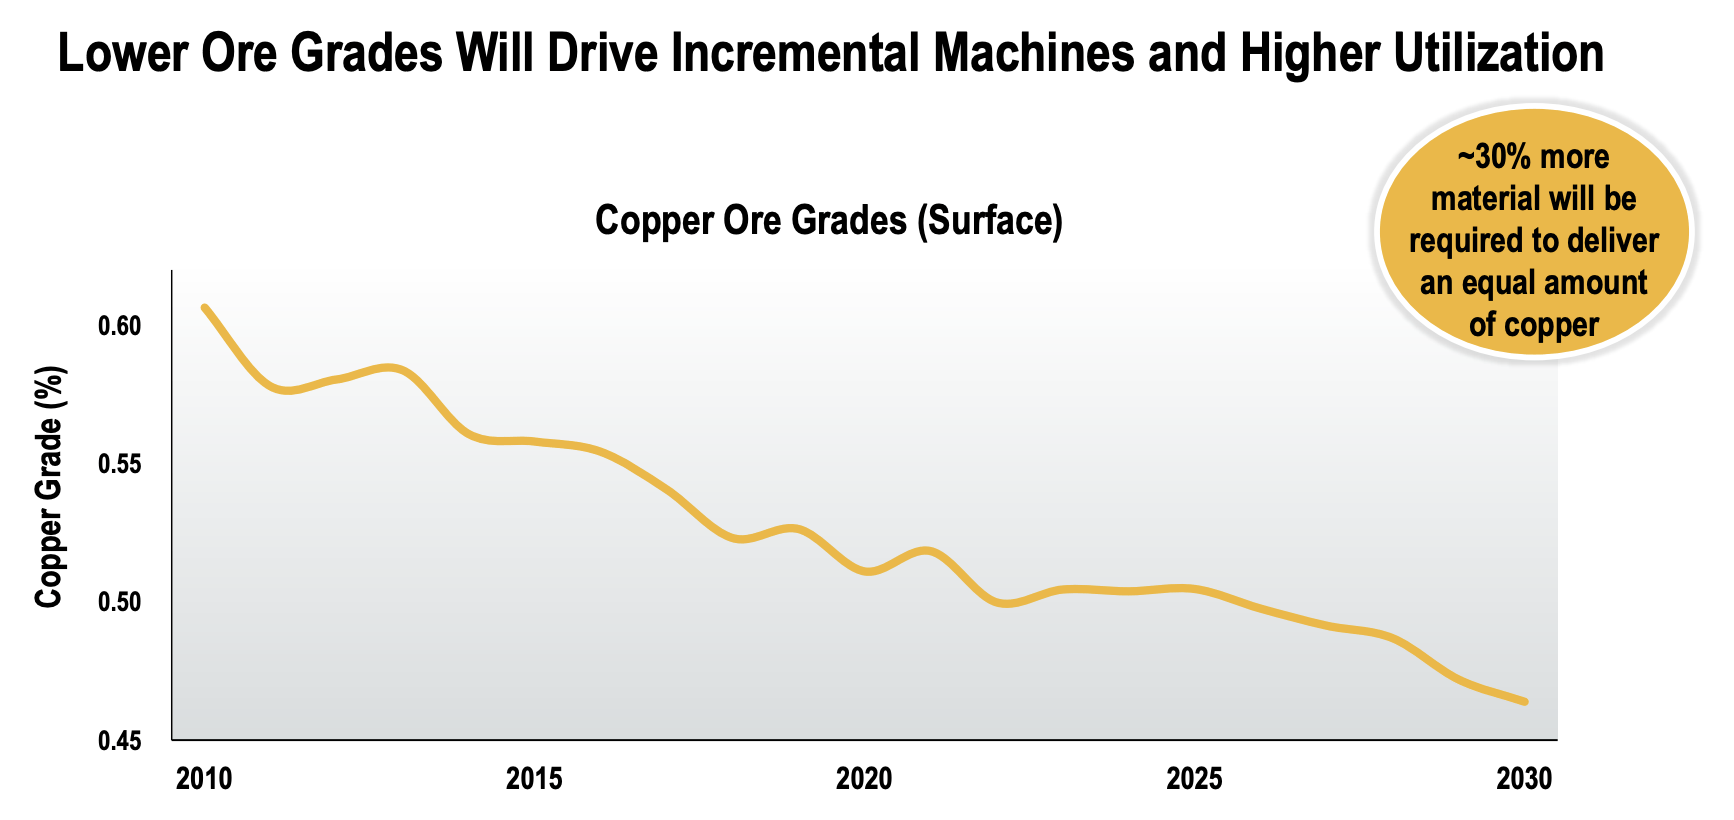
Caterpillar
With all of this in mind, what can we expect in terms of mining equipment sales?
According to research conducted in 2021, the global mining equipment market share could reach $393 billion in 2030. That’s up from $153 billion in 2021. That’s 9.9% annual compounding growth.
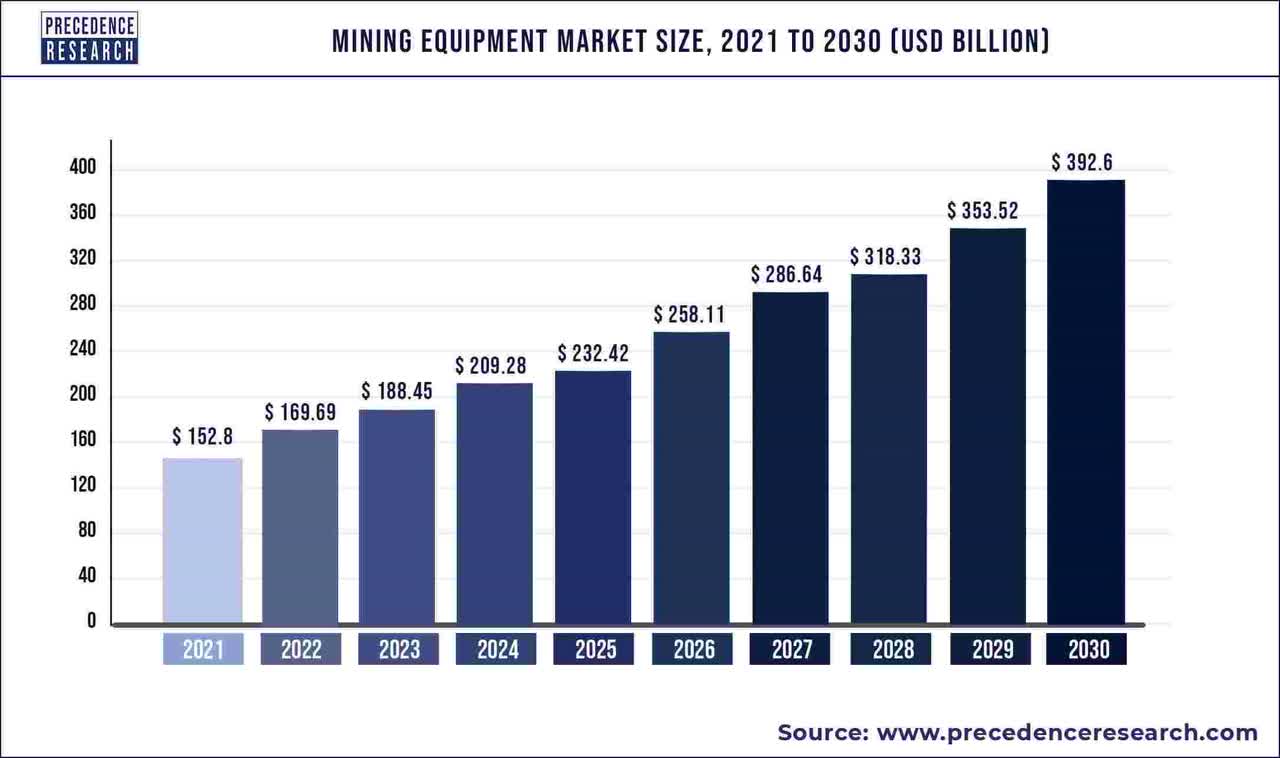
Precedence Research
According to Precedence Research, growth drivers will be an increase in urban population, which pushes up demand for both oil and natural resources. Over the next 20 years, emerging economies in Asia and Africa will account for more than 50% of the global urban expansion. This means more local industrialization and a higher need for metals.
The key takeaways of this public report were:
– Asia Pacific mining equipment market was valued at USD 36.71 billion in 2021 and is expected to grow at a CAGR of 6.2% from 2022 to 2030.
– The underground mining equipment segment is expected to grow at a CAGR of 15.3% from 2022 to 2030.
– By application, coal segment was accounted 38% revenue share in 2021.
– The surface mining equipment market reached USD 34 billion in 2021.
– The metal mining application is expected to grow at a CAGR of 5.4% from 2022 to 2030.
With that said, there’s a third trend, although less important because of missing guidelines.
“Sustainable” Mining
First of all, ESG in mining is a tricky topic for one reason; there’s no clear plan and no meaningful guidelines. According to Theo Yameogo, mining expert for EY:
The journey toward sustainable mining has no maps. ESG is a moving target, and every company starts from a different place. Developing a cogent framework and setting an individual pace for adopting digital change are only the beginning. Mining and metals, an industry that works on the scale of decades, must chart future disruptions through collaboration, openness, and trust in technology and people.
What matters here is that CAT is prepared for new trends in the mining industry – as well as other industries it operates in. For example, in 2025, the company will start pilot projects with customers for electric mining trucks. After 2027, electric trucks are expected to be deployed. Its partners are major mining companies like BHP, Rio Tinto, Newmont, and Teck Resources, which means exposure to all major metals and almost all major mining companies.
Moreover, autonomous mining is becoming a cornerstone of CAT’s capabilities. In 2023, the company is expected to have close to 900 autonomous trucks (cumulative since 2013). After 25 years of development, it now has 11 customers for its automated products operating 20 sites with 30% productivity improvements on zero injuries according to the company.
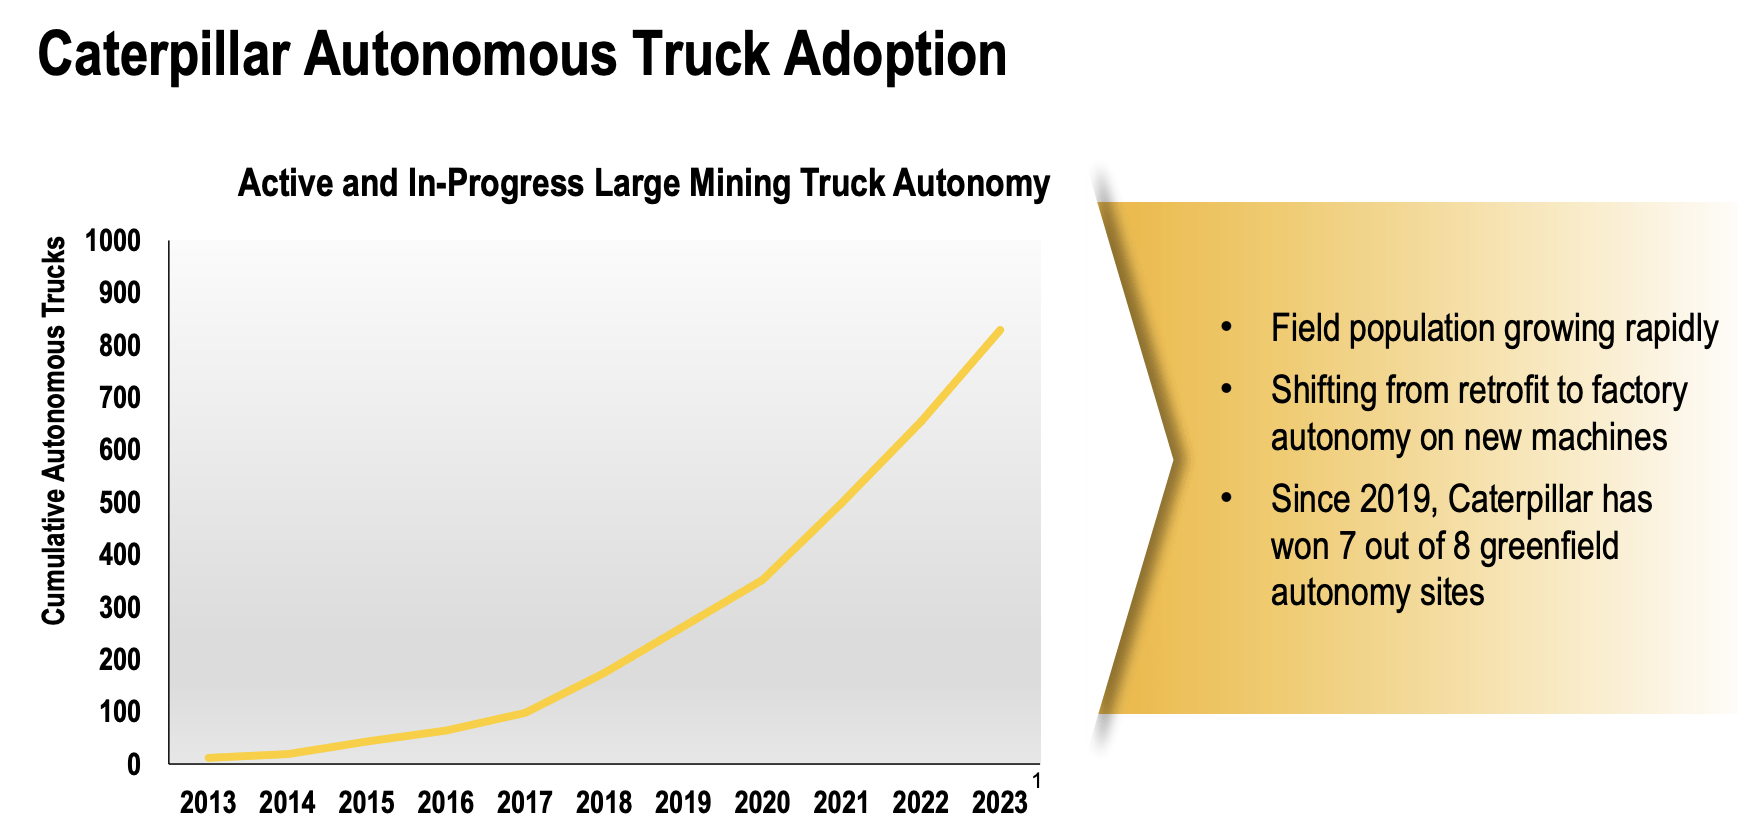
Caterpillar
Caterpillar has been preparing for this trend for years. In 2020, Reuters reported that autonomous driving got a much-needed tailwind from the pandemic as COVID was a major risk for metal supplies. Moreover, Caterpillar stepped up investments in autonomous driving in the years between 2012 and 2017, when the giant suffered from a long-term decline in sales due to subdued commodity prices and falling CapEx from customers.
Now it benefits from autonomous driving and rapidly rising demand for metals.
Other Honorable Mentions
While this is a mining-focused article, Caterpillar confirms that it sees high long-term growth in construction as well. After all, it’s roughly 40% of total sales, depending on the year and business environment.
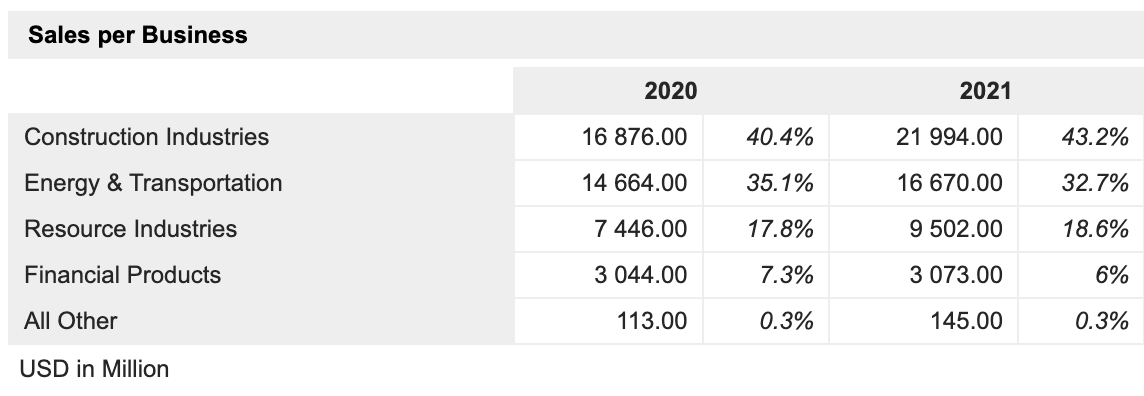
MarketScreener
Including needs for the energy transition, CAT sees between 2x and 3x growth between 2021 and 2040.
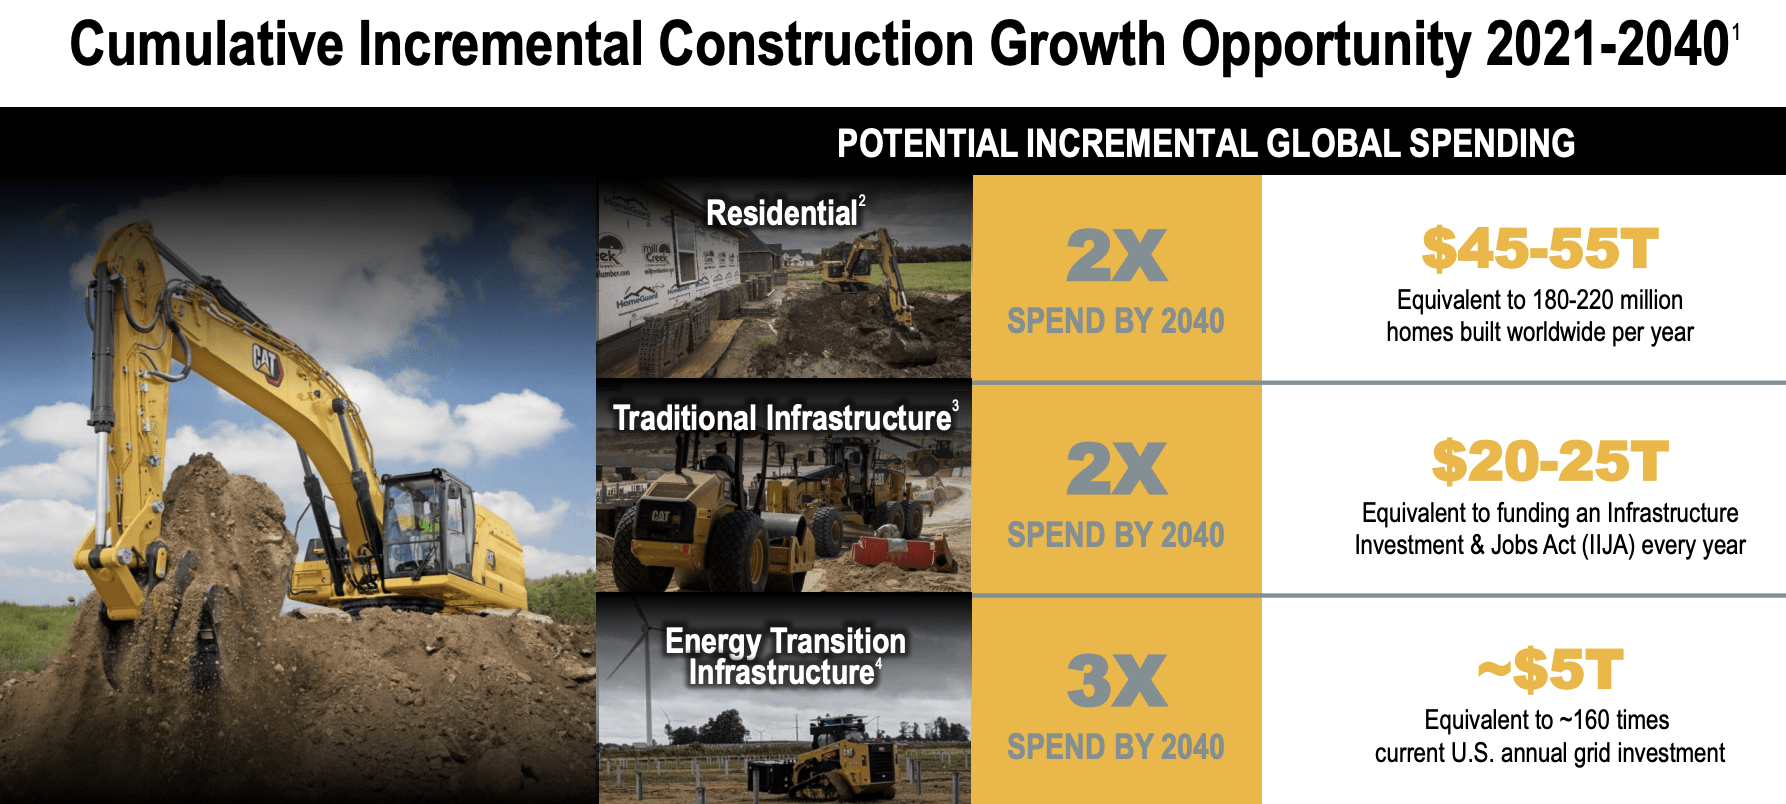
Caterpillar
This implies close to 4% (average) annual compounding growth across construction-related industries.
According to the company:
But, residential construction first. It’s been strong, and we anticipate that strength to continue. According to Oxford Economics, it’s estimated the world needs to increase housing development, on average, $2.5 trillion per year. Now, that gets up to $45 trillion to $55 trillion, really, double the current spend, by 2040. Really, what we’ve seen over the last several years, this has, really, already started. Our belief is there’s a significant gap, things are healthy, and this supports that future growth.
So Much Value In Caterpillar
The beautiful thing about Caterpillar is that while it does have a high correlation with economic growth indicators, commodities, and related, it is a long-term outperformer. The stock has returned 13.0% since 1985, which beats the S&P 500 by 250 basis points per year. The only issue is that the standard deviation is rather high at 30.9%, which investors need to take into account.
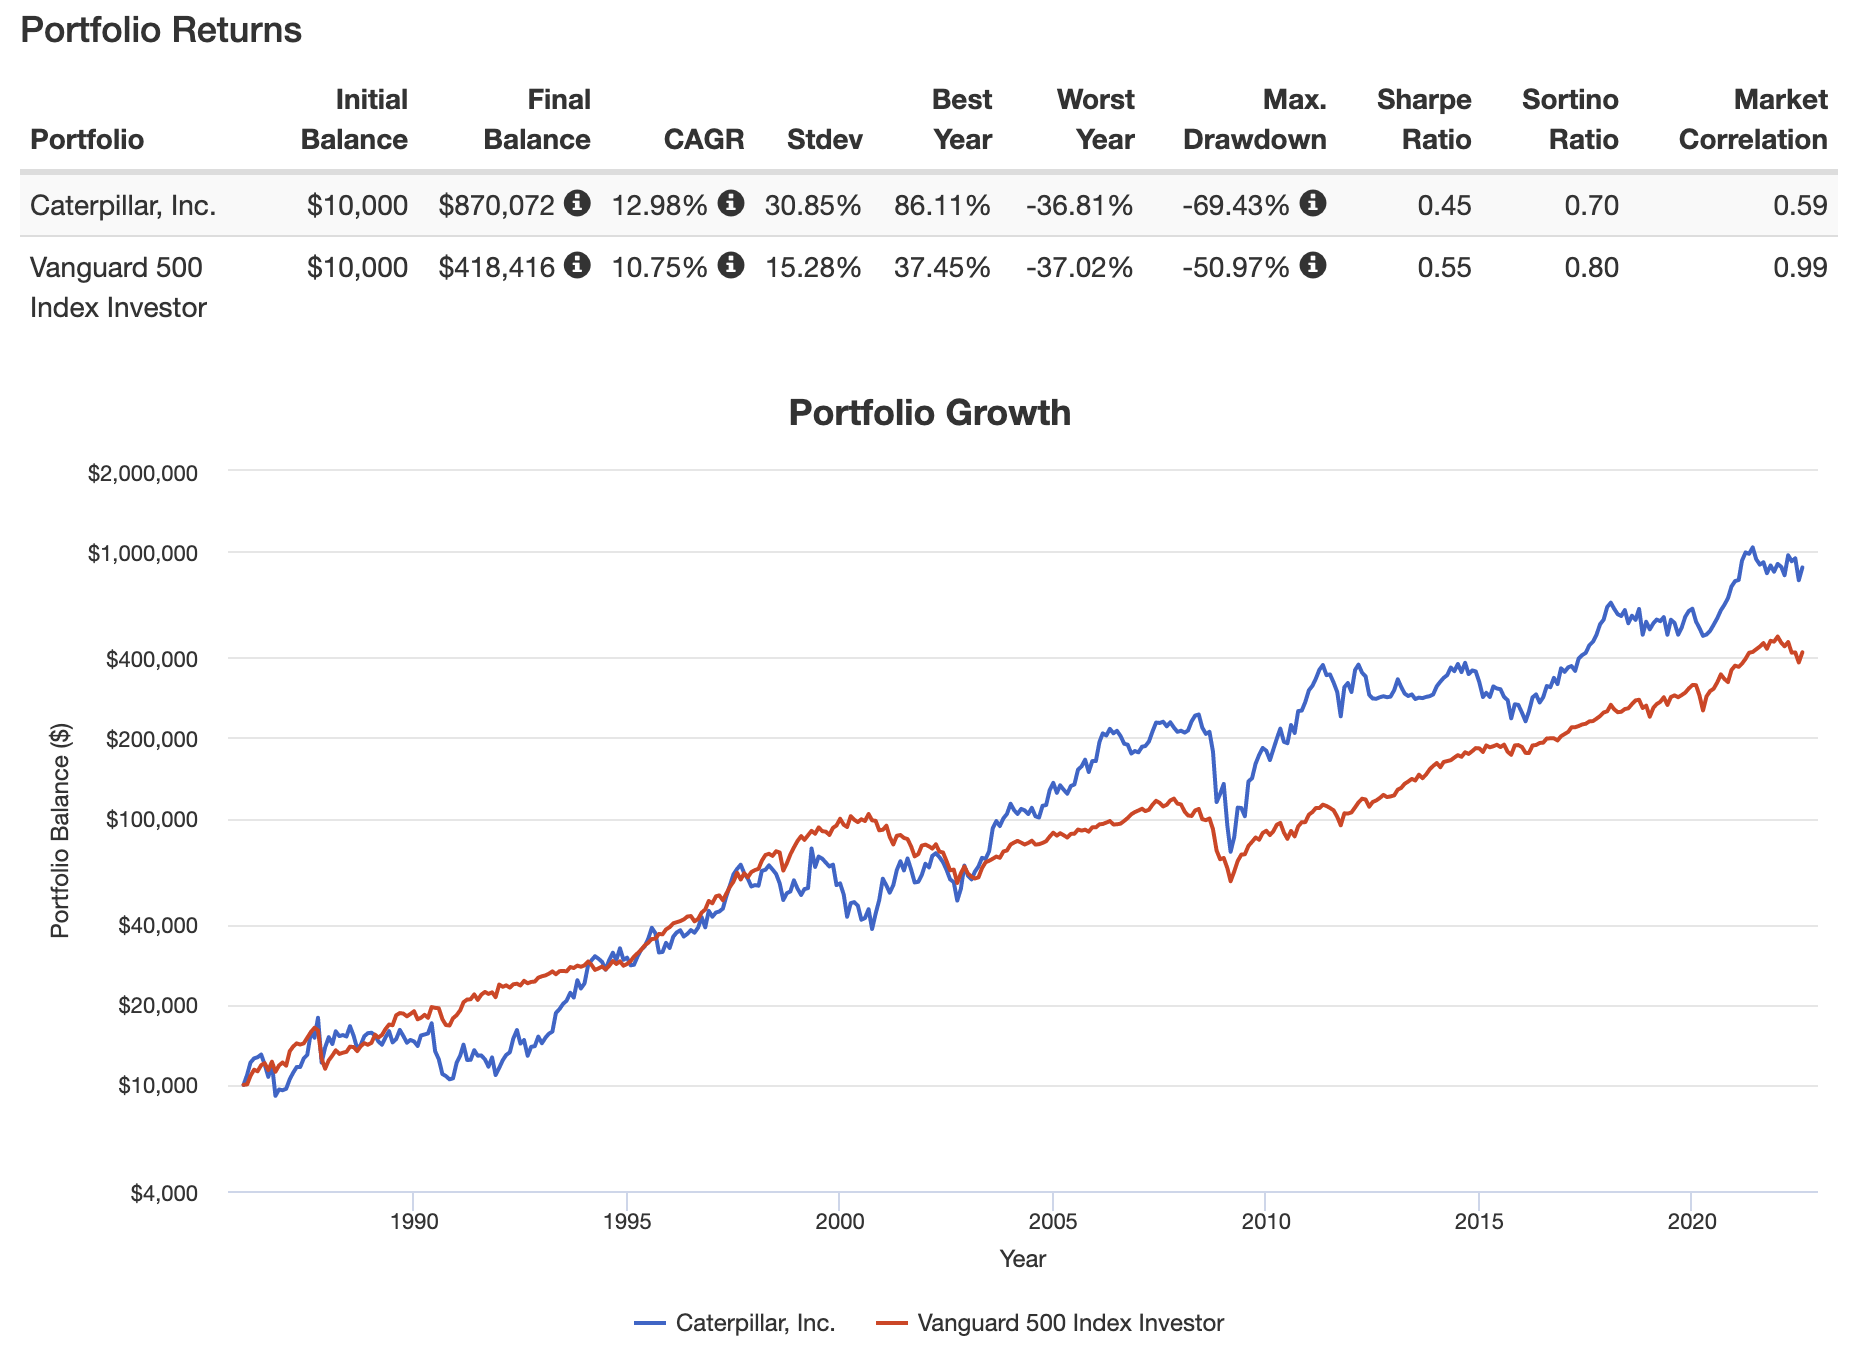
Portfolio Visualizer
In order to show how much value CAT generates, let me show you its margins and ability to generate free cash flow. In this case, I’m starting in 2012, which was when growth peaked due to weaker commodities and slower global growth.
Between 2012 and 2023E, EBITDA growth is more or less zero. However, the company is expected to do $6.8 billion in free cash flow next year, more than at any point, except for 2013. In 2024, that number is expected to slightly exceed $8.0 billion with an EBITDA margin of 18.5%. Recently it has been hard for the company to improve margins due to the pressure from rising costs related to broken supply chains.
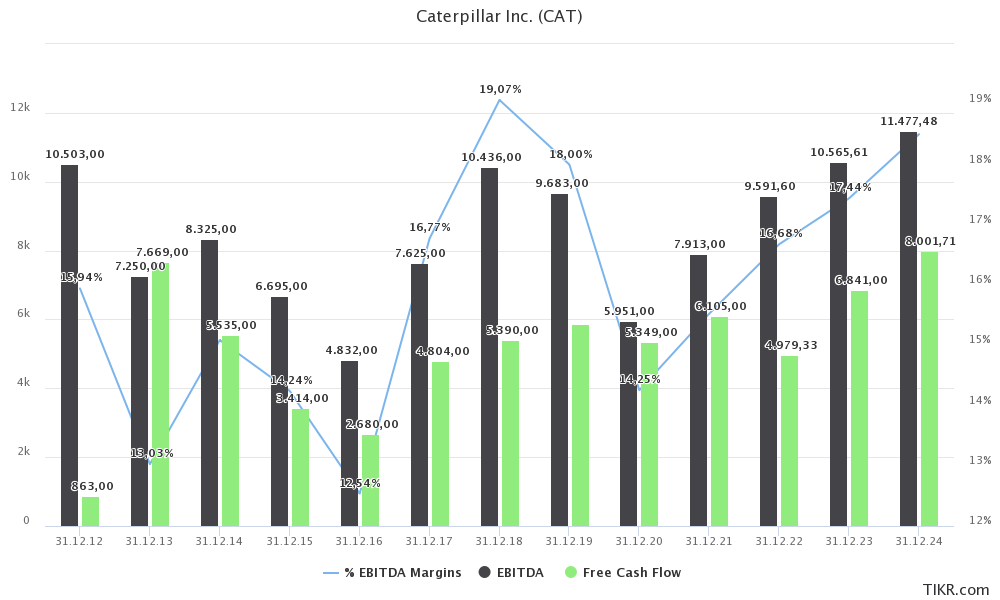
TIKR.com
For example, in 2Q22, the company saw a headwind of $966 million in its operating profit due to manufacturing costs. Higher pricing of $1.1 billion more than offset these issues, yet it’s hard for the company to grow margins at the pace it did after the 2016 manufacturing bottom.
While the margin recovery is slow, for now, I expect that to change as supply chain issues are slowly easing. However, the secular bull case I discussed in this article is sustainable. Hence, I assume that the company can reach 20% EBITDA margins in the 5-10 years ahead. That would pave the way for at least $10 billion in free cash flow. However, using 2024E FCF estimates of $8.0 billion, we’re already dealing with an implied FCF yield of 7.7% using the company’s $104 billion market cap. This means the 2.5% dividend is safe (with more upside) on top of aggressive buybacks.
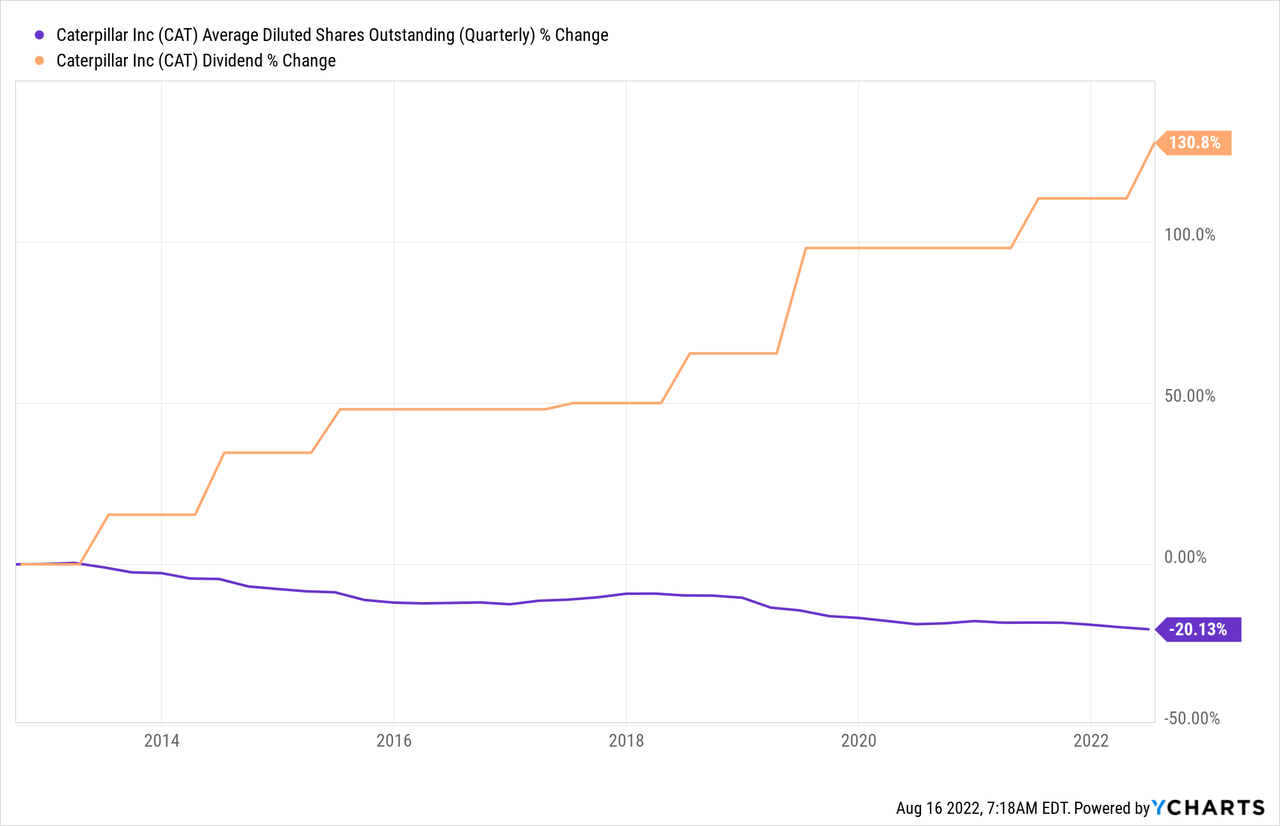
Over the past 10 years, the company has bought back 20% of its shares outstanding and hiked its dividend by 130%. This helped the company tremendously as it was able to generate high total returns for shareholders.
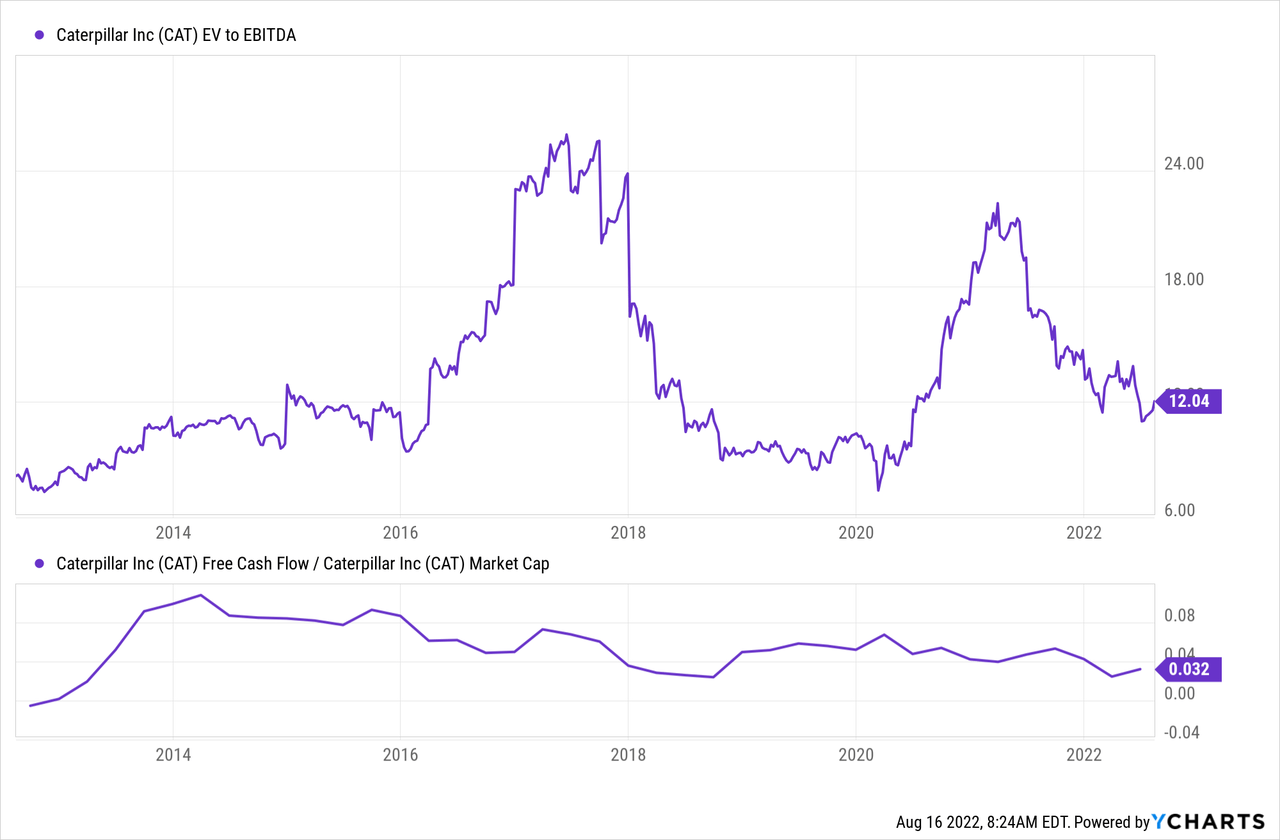
With that said, the company is currently trading at 12.9x 2023E EBITDA ($10.6 billion). This is based on a $136.4 billion enterprise value consisting of its $104 billion market cap, $27.2 billion in expected 2023 net debt, as well as $5.2 billion in pension-related liabilities.
This valuation is very fair, especially given the implied free cash flow yield of almost 8%. It means investors are not overpaying to get access to free cash flow.
Moreover, none of this takes the long-term bull case into account, which is likely stronger than anything the company has seen in the past 10 years. Hence, I am convinced that CAT can continue to outperform the market on a long-term basis.
Takeaway
A few months ago, I was considering selling Caterpillar in the future (at much higher prices) to consolidate my industrial exposure. Needless to say, that plan is off the table.
We’re at the start of a long-term commodity bull market, supported by the global move towards renewables, which is poised to boost demand. That’s a huge win for Caterpillar. Not only because it’s a leading supplier of machinery and equipment, but also because I expect that this uptrend comes with more mining activity to diversify metals supply as well as ESG initiatives at major operators, which benefits Caterpillar’s investments in EV mobility.
On top of that, I’m very bullish on autonomous mining, which is something CAT has worked on for more than 20 years with accelerated investments in R&D prior to the start of this commodity bull market.
Moreover, the company sees strong growth in construction as well, driven by higher infrastructure spending.
Taking all of this into account, CAT shareholders are in a good place. Not only is CAT in a terrific position to turn higher (expected) sales into strong free cash flow used to boost shareholder distributions, but the company also offers investors a way to benefit from the mining bull market without the need to invest in risky mining projects.
CAT is a well-diversified investment that I believe will continue to generate high and market-beating total returns.
Last but not least, current cyclical economic developments provide investors with the opportunity to initiate a new position or add to an existing position. My advice is to buy gradually to incorporate the chances that the market sees more selling related to current economic conditions.
(Dis)agree? Let me know in the comments!
Be the first to comment