

Rawpixel/iStock via Getty Images
This is the second part, in my two part series, on Carvana Co. (NYSE:CVNA). Today’s piece highlights the fundamentals and discusses the business whereas part one, published yesterday, highlighted the compelling technical setup.
Back on August 10, 2021, shares of Carvana Co. peaked at $376.83. Like so many former technology stock high fliers, once loved and widely owned by some of the world’s best money managers, the pendulum has now swung wildly in the other direction. No question, the stock was punching well above its weight and never deserved a $63 billion market capitalization, at least at this point in its business life cycle.
Fidelity 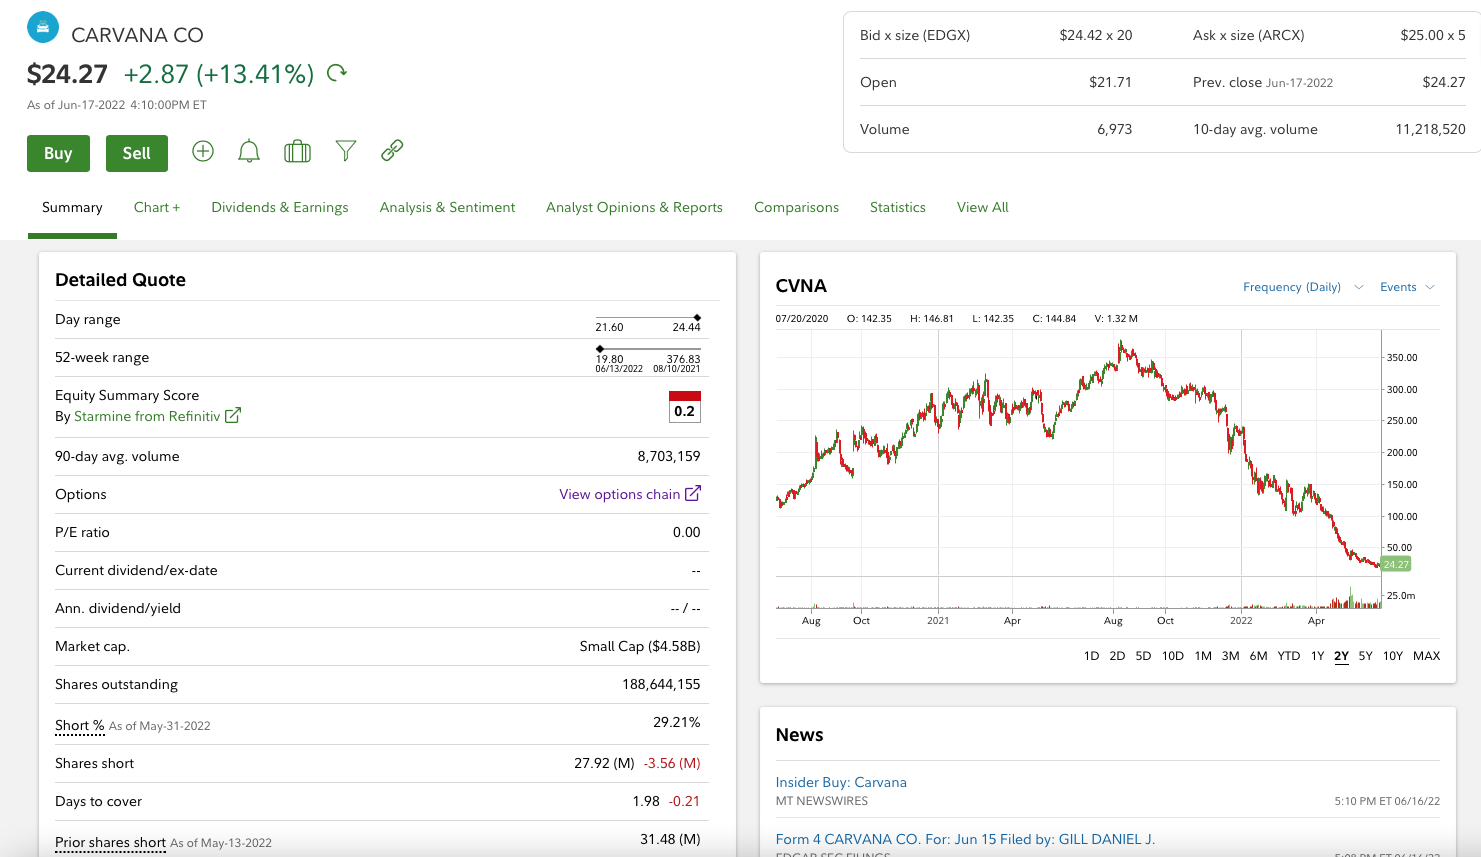
As often happens, notably more so in a fierce bear market, like the present one, the wild swings in sentiment often mean the market dramatically over values and then dramatically under values good businesses.
The Business
Carvana is the second largest seller of used vehicles in the United States. In case you are wondering, CarMax Inc. (KMX) is number one, and KMX claimed that they reached 4% national market share during Q1 FY 2022. For perspective, CarMax has 230 national stores and is planning to build an additional 10 stores during FY 2022.
As you can see, CVNA sold 425K retail units in FY 2021.
Carvana May 2022 IR Deck 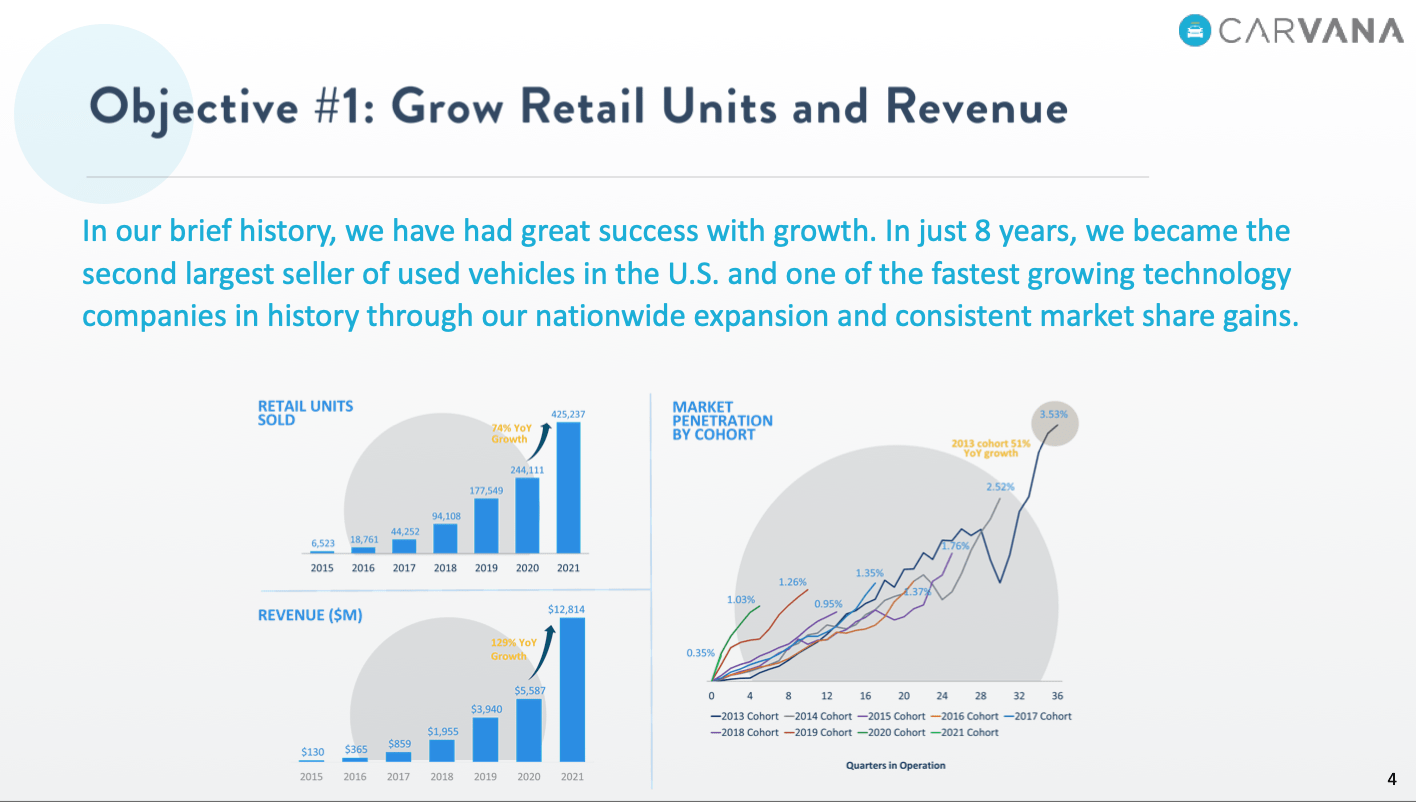
One of Carvana’s key metrics is GPU (Gross Profit per Unit). From its FY 2021 10-K – here is how the company defines GPU:
We define total gross profit per unit as the aggregate gross profit in a given period, divided by retail units sold in that period including gross profit generated from the sale of the used vehicle, gains on the sales of loans originated to finance the vehicle, commissions on sales of VSCs, revenue from GAP waiver coverage, and gross profit generated from wholesale sales of vehicles.
As you can see, Carvana nicely grew this metric during FY 2021.
Carvana May 2022 IR Deck 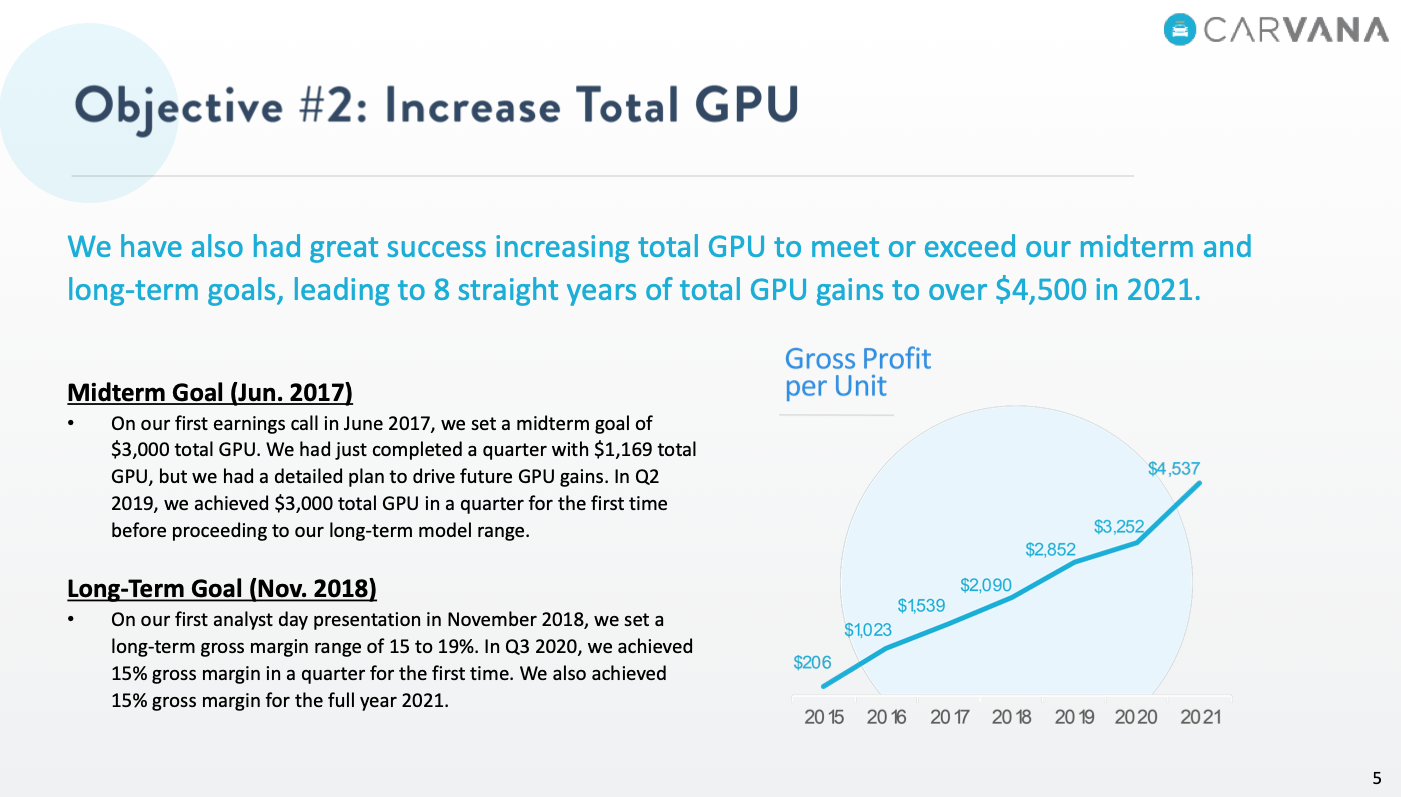
If we take a step back, let’s better understand this business. In a short period of time, through technology, marketing, and an innovative new business model, Carvana has disrupted the used car industry. As its CEO, Ernie Garcia III, often says, over a long period of time, there are roughly 40 million used cars bought and sold every year. The market is highly fragmented with thousands of players offering similar experiences and that have similar economics. Taking a step back, over a long period of time, so encapsulating multiple points in an economic cycle, on average and in aggregate, the operating margins and profitability are fairly consistent. With the exception of CarMax, with 4% market share, and a few other smaller players, no one has successfully scaled this business on a national level.
As Carvana doesn’t own a big network of large and expensive dealerships, they go to market differently. This is an online purchase or sale and there isn’t the traditional haggling and drawn out negotiation dance. There is the customer acquisition piece, where an interested seller provides Carvana with the VIN numbers, the mileage, and they describe the condition of the vehicle. Carvana then make a customer an offer based on that information, cross referencing against its large and expansive databases.
If the offer is accepted then there the following major steps:
- The paperwork piece where titles and monies are exchanged (or Carvana arranges to pay off the note holder of the underlying vehicle with the bank/ finance company).
- The inbound transportation cost (where a Carvana truck (or 3rd party truck) picks up the vehicle).
- The vehicle is then brought to the nearest reconditioning center in Carvana’s network, it is inspected and reconditioned. When it is ready for re-sale, a number of pictures are taken and it is listed on Carvana’s website.
- When the vehicle is re-sold, Carvana makes money on the difference between the cost to acquire the vehicle, cost to transport it (inbound), the cost to recondition it, and depreciation over that time period.
- They can also make money selling an extended warranty as well as providing financing (Carvana securitizes all of its loans – they don’t take the underlying balance sheet or credit risk).
- Lastly, there is the cost of outbound freight to deliver the sold vehicle to the new buyer.
From a CAPEX perspective, outside of the working capital required to build enough inventory to support the company’s rapid growth, the IRCs (inspection and reconditioning centers) and the owned transportation fleets are the most expensive parts of the business.
At the end of 2021, Carvana had 14 IRCs. Per its Q4 FY 2021 conference call, that took place on February 24, 2022, Carvana had 15 IRCs, with total annual capacity utilization of 880,000 units.
This year, we made significant progress scaling our vehicle production capacity. In 2021, we added three inspection and reconditioning centers, increasing our total IRC count to 14. Following year-end, we also opened our 15th IRC near Cincinnati, Ohio, bringing our total capacity at full utilization to approximately 880,000 units as of February 24.
We remain on track to open six additional IRCs by the end of 2022. We plan to open five of these on schedule, leading to more than 1.2 million units of annual capacity at full utilization at year-end. And with our acquisition of ADESA U.S., we are currently evaluating our preferred time line on opening the sixth.
Source: Q4 FY 2021 Conference Call (February 24, 2022)
The company also pioneered and patented its vending machines. As of today, they have 33 Vending Machines.
Carvana.com
ADESA
The other elephant in the room is Carvana’s May 10, 2022 $2.2 billion acquisition of ADESA’s wholesale auction business.
Given Carvana’s really weak Q1 FY 2022 results, driven by sharply rising interest rates and high yield credit spreads widening, and a declining stock price, in order to fund the ADESA deal and provide a big cushion to weather any economic cycle, Carvana raised $4.525 billion of new capital. This took the form of $3.275 billion of 10.25% due May 2030 and selling 15.625 million shares of stock, at $80 per share (the Garcia’s bought 5.4 million of the deal).
As management noted, ADESA is the second largest wholesale auction company in the United States and this business generated $100 million of Adj. EBITDA (I believe in FY 2021). However, and of more strategic importance, Carvana now owns 56 sites and in locations that were built and acquired over a 30 year period of time.
The ADESA U.S. footprint includes 56 sites with approximately 6.5 million square feet of buildings on more than 4,000 acres.
We expect to be able to build approximately two million units of annual reconditioning capacity in these locations, while still operating ADESA U.S.’s wholesale auction business. This is the equivalent of approximately 30 greenfield Carvana IRC locations in terms of the production volume that we expect to unlock over time.
Adding the ADESA U.S. footprint will dramatically improve our logistics network over time. With the addition of these locations, we will eventually have reconditioned inventory within 50 miles of 58% of the US population and within 200 miles of 94%. This will have the benefit of reducing shipping distances, times and costs, accelerating us to our long-term financial model.
(Source: Carvana Q4 FY 2021 Conference Call (February 24, 2022))
A few sell siders have asked about the cost difference between building new greenfield locations vs. acquiring these 56 sites and Carvana’s management noted that cost to select, permit, and build would have been similar from a cost perspective, but impossible to replicate. Moreover, ADESA’s 56 site network is closer to key markets whereas prospective greenfield sites simply aren’t available in many expensive places, due to very restrictive zoning and lack of available land, such as on the West Coast and in the Northeast.
Take a look at the difference in national coverage pre and post ADESA. As an aside, jog your memory to the really successful Verizon commercials – Can you hear me now?- and look at Carvana’s greatly expanded coverage with the acquisition of these 56 ADESA locations.
As you can see, this deal greatly expands its coverage. With the ADESA deal, Carvana now has an extensive presence on the West Coast, in the Midwest, in Texas, in Florida, and in the Northeast.
I am of the view that this was a really smart deal.
Carvana May 2022 IR Deck 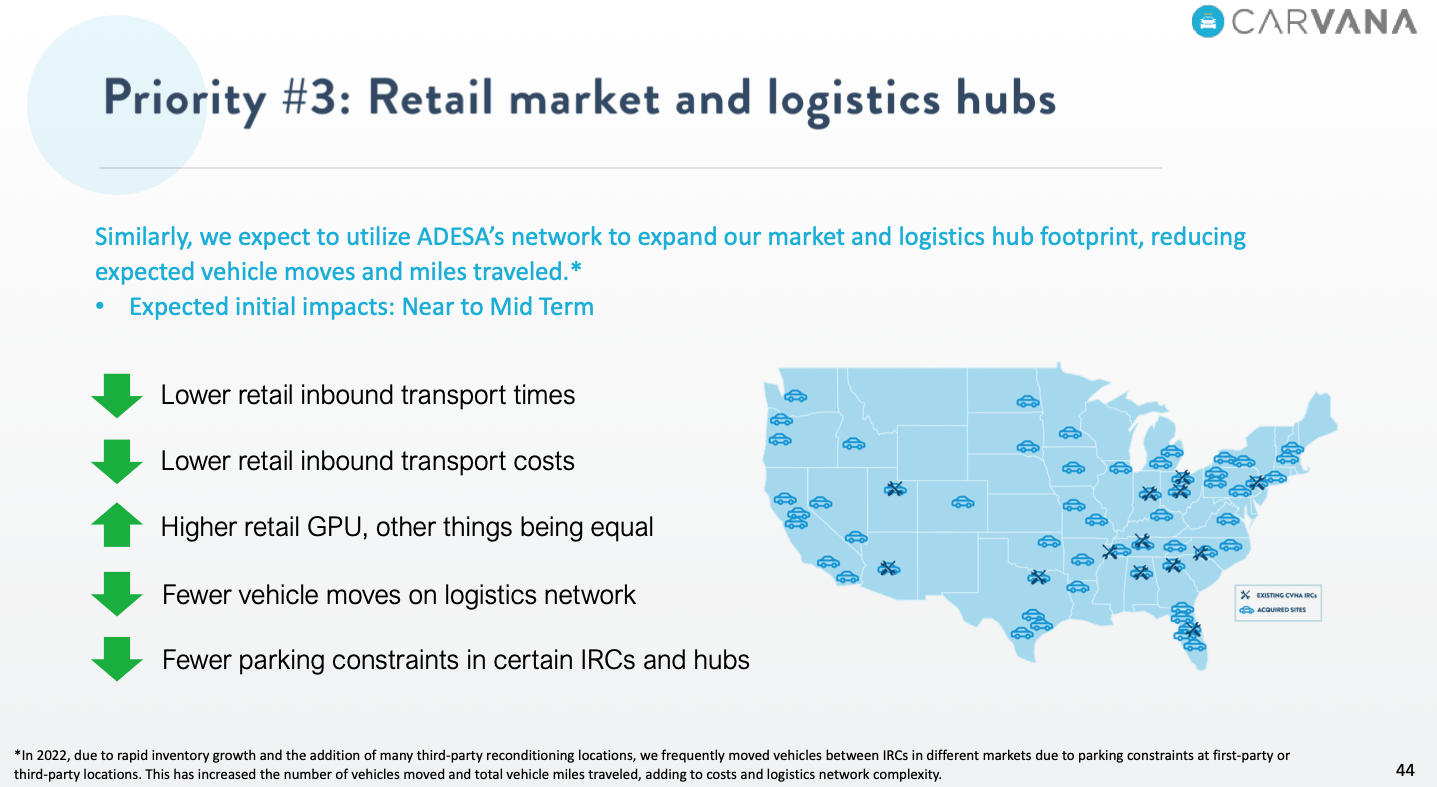
The Opportunity And Why Carvana Is So Attractive At $25 Per Share
The bear case/ narrative on Carvana is that this is just a money losing Covid winner that experienced rapid growth and never really made any money. The bears will argue that the company overpaid for its ADESA acquisition at 22X Adj. EBITDA and had to issue expensive 10.25% debt to fund it. In addition, they will tell you that they issued $1 billion more than the ADESA acquisition cost in order to fund working capital and to fund Capex to turn select ADESA locations into IRCs.
So now, the company has $3.275 billion of new 10.25% May 2030 notes as well as $2.45 billion of existing Senior unsecured notes and other working capital related debt.
In case you are wondering, Carvana’s other tranches of unsecured Senior notes are as follows: (ranging from 4.875% to 5.875% coupons with maturity dates ranging from October 1, 2025 – September 1, 2029).
Carvana Q1 FY 2022 10-Q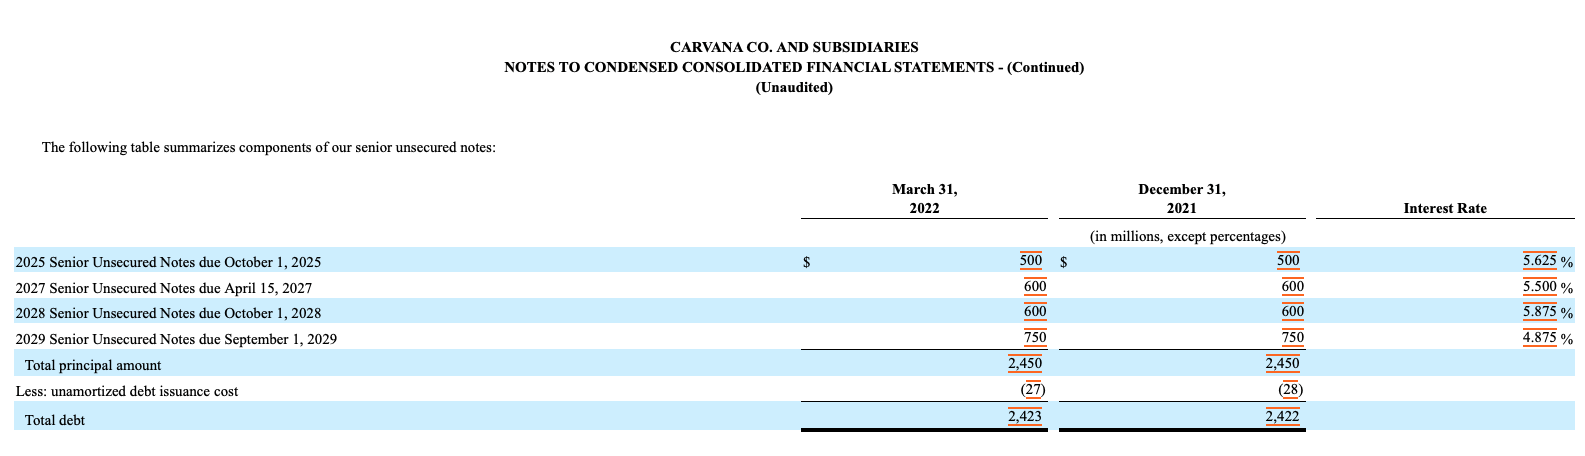
Also, the company has $3.5 billion of debt tied to inventory. However, there is $3.3 billion of inventory as well as finance receivables and beneficial interest in securitizations on the asset side of this equation. So for our purposes, we mostly need to focus on the unsecured Senior Notes, cumulatively, that total $5.725 billion.
Carvana Q1 FY 2022 10-Q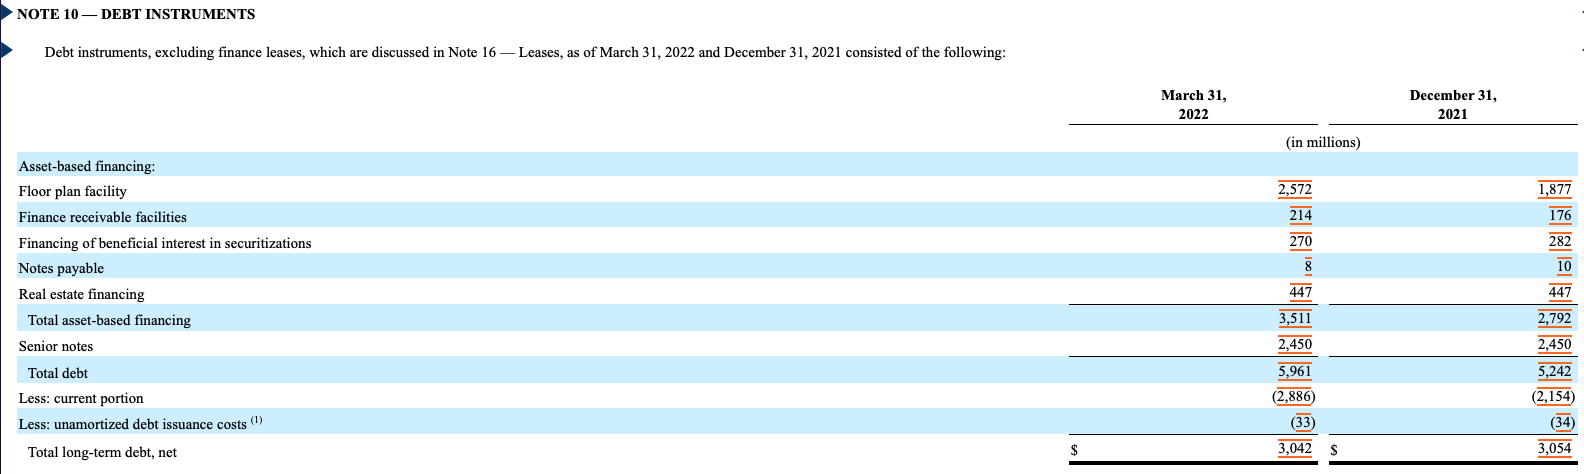
Bears will also make arguments that Carvana benefited from the rapidly rising used car prices, low interest rates and low default rates on auto loans as the underlying collateral tied to the loans performed so well.
The Antidote To The Bear Case
If you take a step back, excluding working capital, as Carvana rapidly grew its business and this meant carrying higher levels of inventory to try and match breakneck growth. Therefore, the business really doesn’t really burn that much operating capital.
For example, if you net out changes in working capital, Carvana’s FY 2021 operating cash flow losses from operations was only $512 million. The story is very similar in FY 2019 and FY 2018.
Carvana FY 2021 10-K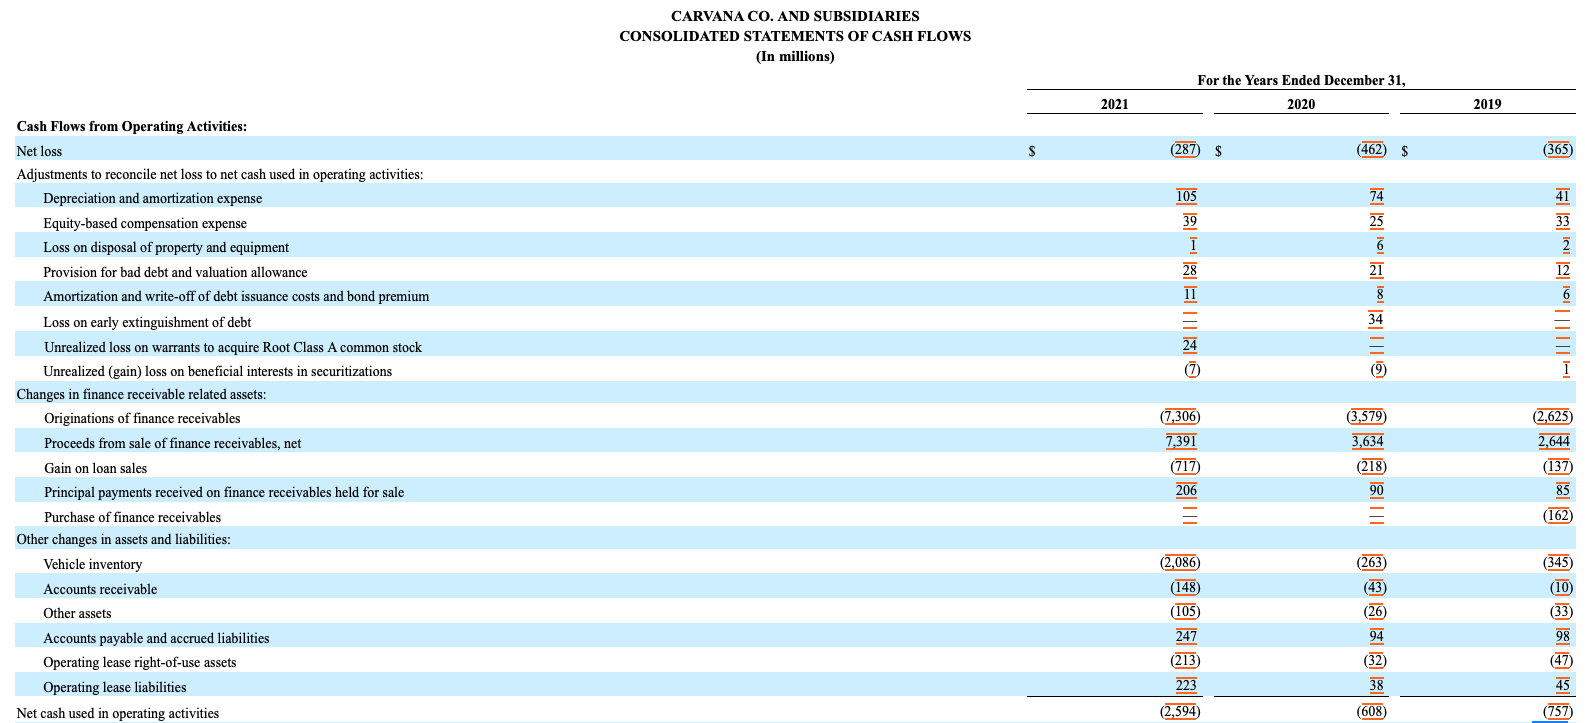
No question, Q1 FY 2022 was a very bad quarter as the multitude of factors caught management off guard, including surging Omicron, rapidly rising interest rates, persistent staffing inefficiencies in its IRCs, all exacerbated by Omicron, winter weather, and logistics bottlenecks.
Here is how management described them in its opening remarks (April 20, 2022 – Q1 FY 2022 conference call):
First, let’s discuss the impacts to our results. There were three primary drivers of our results in the first quarter. The first is our operational constraints that most severely impacted our inspection centers and logistics network. These began with Omicron, were exacerbated by winter storms and then the path to recovery has been slowed by our inspection center logistics network and inventory growth causing us to produce and move more inventory to newly opened IRCs that are further away from our average customers, leading to additional network complexity. These effects had negative impacts on both sales volumes and retail GPU.
The second was industry-wide impacts. Affordability and general consumer sentiment combine to drive fewer industry-wide sales in prior periods. While we continue to rapidly grow market share throughout the quarter, the combination of these economic factors and our operational constraints caused our growth to come in lower than we were anticipating. Because of the operational requirements of our business, we generally plan and build for growth 6 to 12 months in advance, depending on the lead times necessary to ramp each operational team.
On average, across our history, this has served us well as it has enabled us to maintain much higher levels of growth in businesses with our operational complexity historically have been able to achieve. But given the internal and external factors described above, this quarter, it caused us to carry more expenses than we had sales to offset them with.
This led to total SG&A levels that were largely on plan in total dollars being much higher per unit than prior periods and, to a lesser degree, also flowed through COGS driving down total GPU.
Thirdly, interest rates moved up rapidly in the quarter. As we originate the loans our customers use to buy parts from us and then sell them later, interest rate increases between initially showing our customers their financing terms and ultimately selling those loans leads to a reduction in the value of the loans we sell, which impact of reducing other GPU.
These factors combined to lead to a clear step back in our financial results. While this isn’t what we are shooting for, it is straightforward to understand and it suggests straightforward solutions.
That said, management noted during its Q4 FY 2021 conference call (February 24, 2022) that Q1 FY 2022 results we would weak, so the street should haven’t been shocked.
As we look toward 2022, we expect another strong year on retail units sold, revenue, GPU and EBITDA margin. We expect to grow retail units sold to over 550,000 for the full year. Following the first quarter, in Q2 through Q4 taken in aggregate, we expect total GPU over 4,000 and approximately breakeven EBITDA margin.
We expect the first quarter to be impacted by supply chain challenges brought on by the Omicron variant and severe winter storms and the recent rapid increase in short-term interest rates. We expect these effects to have a significant impact on Q1 total GPU and SG&A per retail unit sold, leading to an expected EBITDA margin loss in the mid single-digit range.
On June 7, 2022, Carvana’s management team presented at the William Blair Conference. If you closely read slide 9, note that management is re-iterating its expectation of a strong recovery in its Q2 – Q4 FY 2022 GPU.
William Blair Conference (June 7, 2022)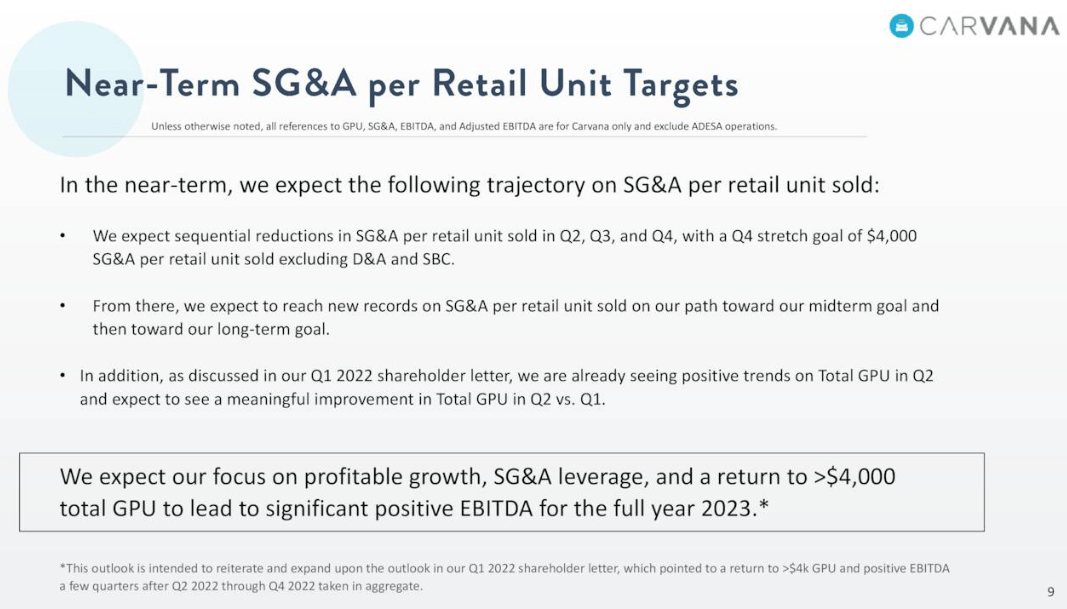
So just like Carvana told the street, on February 24, 2022, that its Q1 FY 2022 numbers would be really weak, as of June 7, 2022, they are saying that the business’s profitability has recovered. Clearly, the market is intentionally overlooking this recovery, as it doesn’t square with the super bearish narrative and extrapolation of the Q1 FY 2022 negative trends!
The Elephant in the room and ADESA
For anyone long Carvana or contemplating getting long now, I would highly encourage readers to spend an hour reviewing its 50+ May 2022 investor deck (see here).
As for me, I tend to believe management that the ADESA deal makes a ton of strategic sense and could prove to the key differentiator in really scaling this business.
Carvana now has national network coverage and 56 well located sites near high population markets that are arguably much more valuable to Carvana than purely on a stand alone basis as a wholesale auction business.
Carvana May 2022 IR Deck 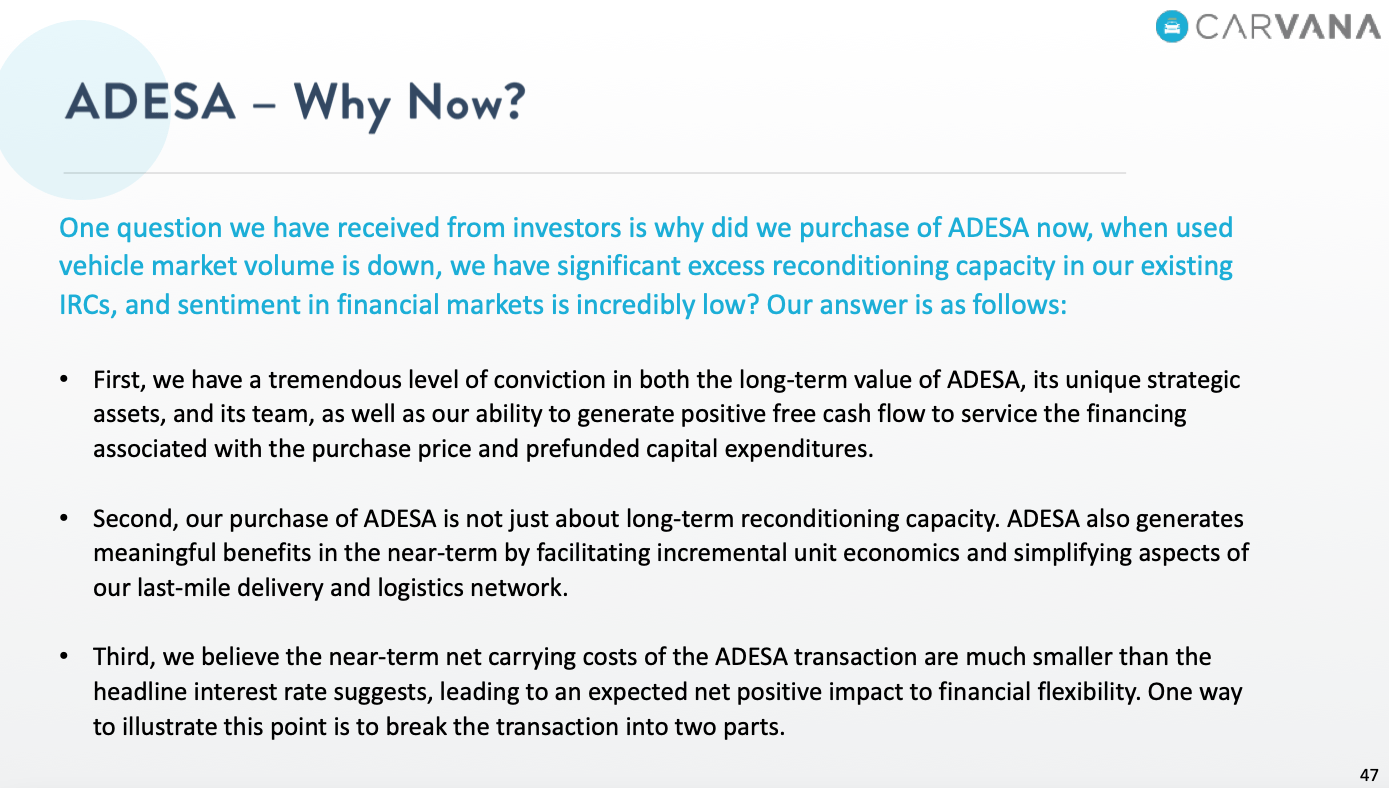
Management is well aware of the financing costs and understands the math and required benefits to make this deal intermediate to long term accretive.
Carvana May 2022 IR Deck 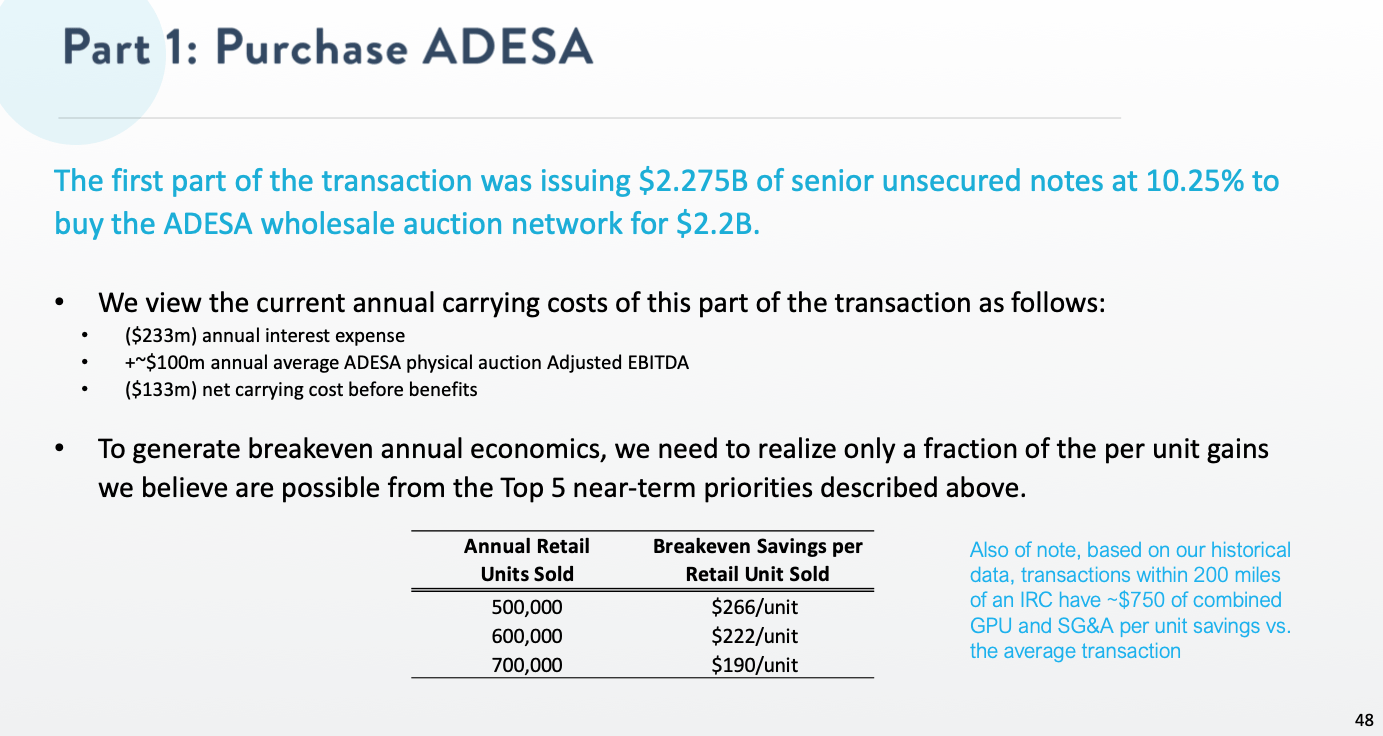
If you look closely at the above slide, proximity to IRCs and the customers drives $750 per unit in savings vs. longer haul deals. Moreover, to be within 100 miles of 78% of the U.S. population compared to 32% should be a major catalyst and tailwind when Carvana does a better job of matching its capacity to demand.
Carvana May 2022 IR Deck 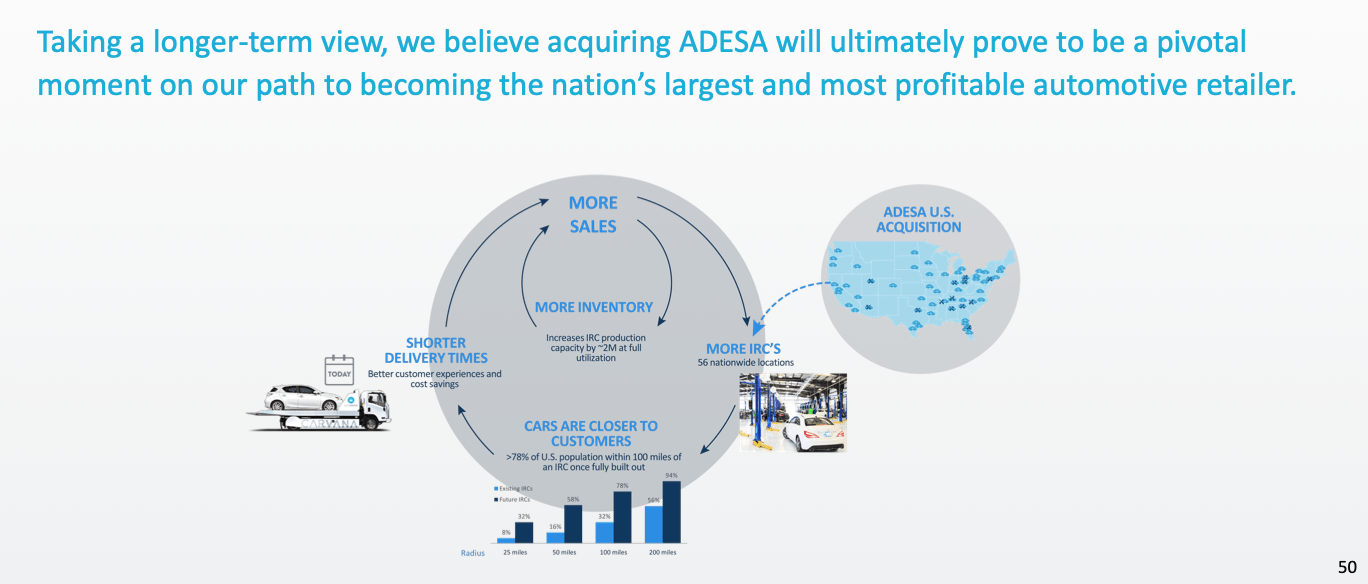
Also, if you review Carvana’s comprehensive May 2022 investor deck, they spend a lot of time explaining how they are attacking the SG&A side of the business. This is through cost cuts and targeted operating efficiency initiatives. All in their quest to get the SG&A cost per unit down.
See these two slides that highlight the laser focus on this side of the business.
SG&A per unit required last various GPU and Retail Units
Carvana May 2022 IR Deck 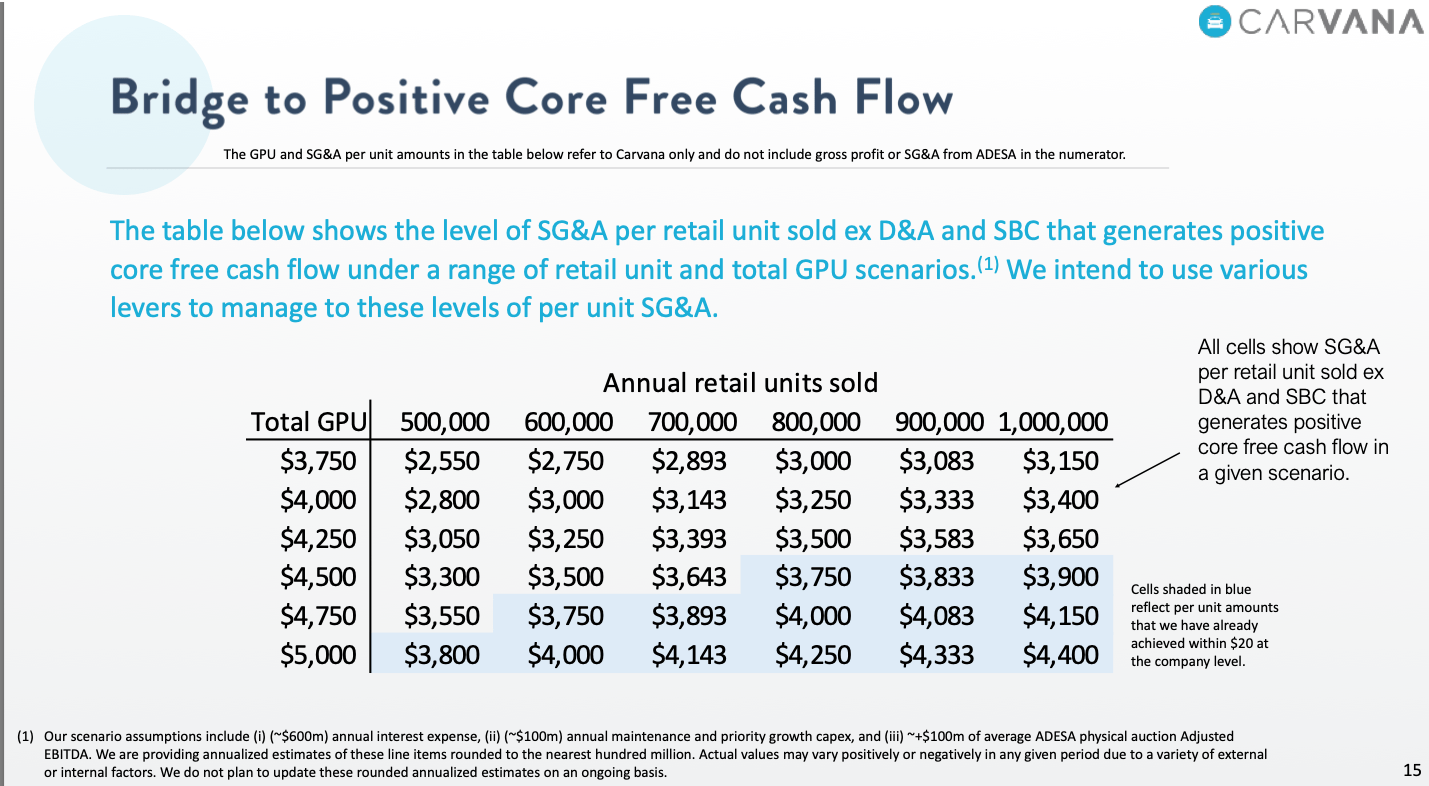
SG&A Per Retail Unit Targeting
Carvana May 2022 IR Deck 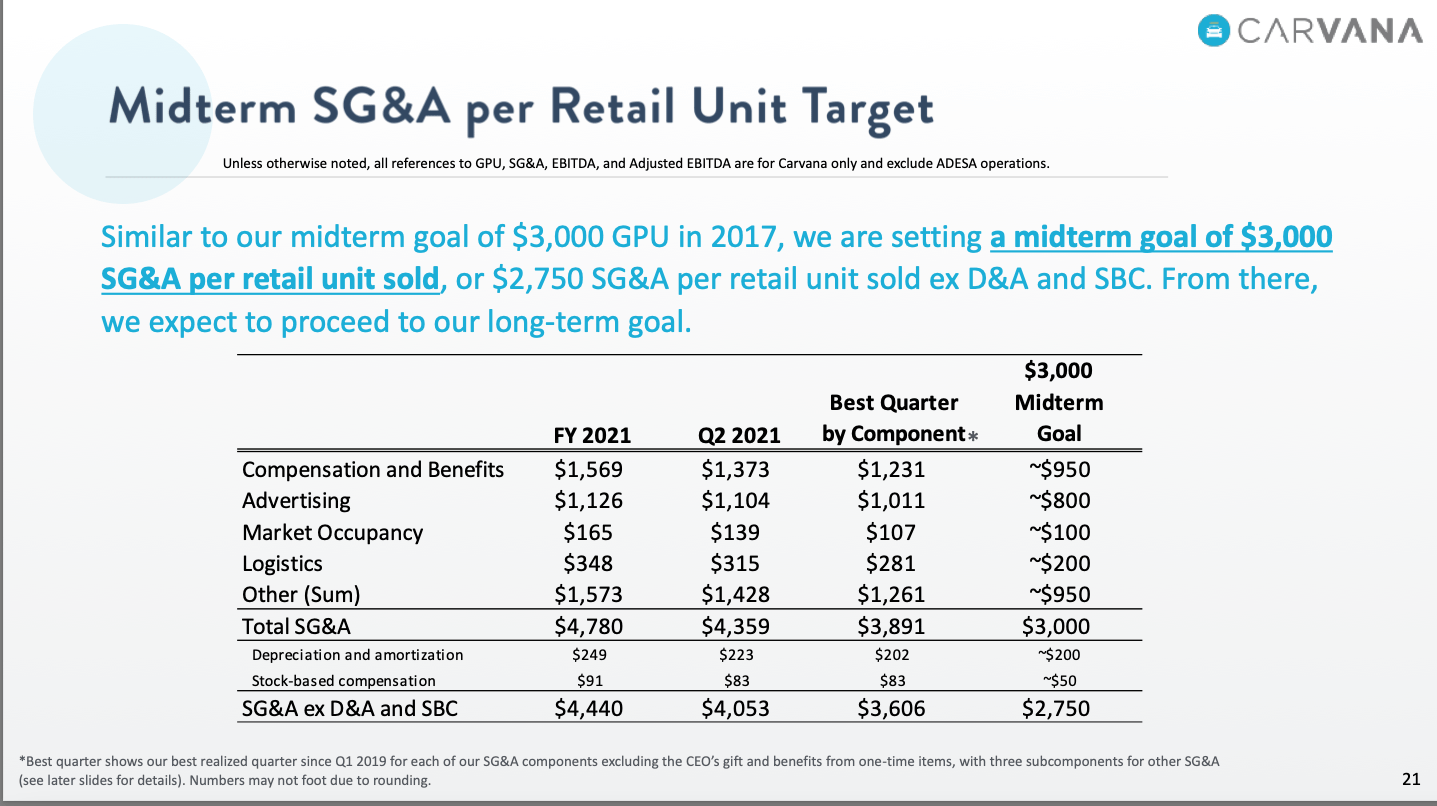
A Few Misperceptions
There is this perception that Carvana’s success was driven by rising used car prices. I frequently see this in the comments sections of many recent Carvana articles. I want to cringe when I read these comments.
The reality is that Carvana isn’t in the business of speculating on used car prices. They want to buy the right inventory (that consumers want), at decent prices (inclusive of transport and reconditioning costs) and then turn that inventory quickly.
On its Q4 FY 2021 conference call, Ernie Garcia III explains that margin is driven largely by the gap between wholesale and retail prices and not rising or falling prices in isolation.
The reverse is the opposite. And then from a margin active, I think it’s actually unclear how that cuts because, generally speaking, margins are driven by kind of the gap between wholesale and retail prices. And so it’s all about how those two markets move in relation to one another. So I think we have pretty solid visibility into the next several quarters from where we are because a lot of these impacts, you can already see starting to abate a bit.
Management actually prefers more supply and lower prices as that is a bigger driver of growth. High used car prices mean the acquisition costs are higher and there is a smaller pool of buyers that can afford the monthly payments to get qualified and into a new vehicle. The resolution of the chip shortage and ramping of OEM production should, eventually, lead to lower prices and be a driver of Carvana’s business.
If you think about it, similar to a bank, net interest margin is one of its key metrics. The wider the net interest margin, and not the absolute level of long term rates, the more money the bank makes, holding credit losses constant. Therefore, I would argue that people are incorrectly assuming that the only reason Carvana made money was due to rising used car prices. No, just like a bank, it is net interest margin, or in Carvana’s case, the difference between acquisition costs and retail sale prices (think wholesale vs. retail).
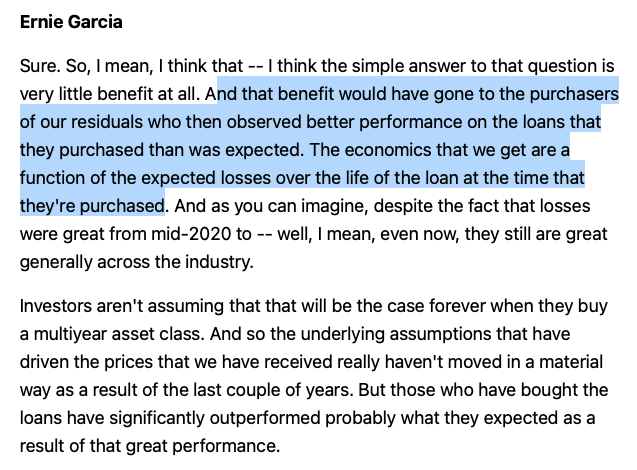
Lastly, I would argue that there is a misperception that Carvana benefits from the low consumer defaults. Carvana securitizes its loans and then sells them. They are not taking the balance sheet risk and don’t own the loan for the duration of the term. So yes, they get paid a margin for originating, bundling and selling the loans, but they aren’t speculating on interest margin and default rates.
See this Q&A exchange (Q4 FY 2021 Conference Call).
Carvana Q4 FY 2021 C.C. Carvana Q4 FY 2021 C.C.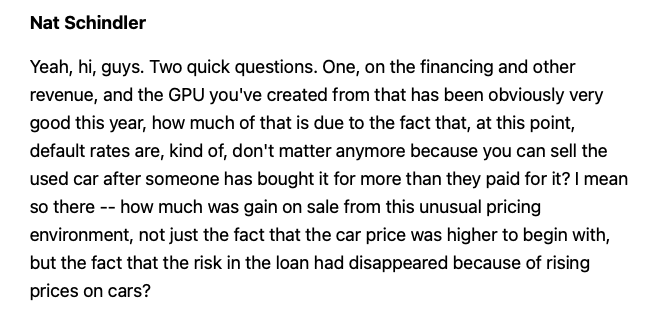
Putting It All Together
Carvana’s stock has gone from $377 (August 10, 2021) to $20 (June 13, 2021). No question its stock was overvalued back then. However, I would argue that the market has thrown the baby out with the bathwater. Carvana’s stock got swept up in the selling vortex that dinged so many technology high fliers. This is actually a very good business with massive operating leveraging and huge growth ahead. For example, Carvana has successfully scaled its growth and its earliest cohort (2013 vintage) market has grown from zero market share to 3.5%, as of today. When there a few shocks, like in airline industry, you can’t immediately adjust your capacity to lower demand, so there is negative operating leverage, in the short term. However, in the shorter to intermediate term, you can course correct and adjust your capacity and better align your costs to match demand. As Carvana has invested aggressively to build out its footprint, the business is now well suited to grow into this expansive network.
Although 10.25% interest for its $3.275 billion May 2030 unsecured Senior Notes is expensive, I would argue that its ADESA acquisition was really smart. Overnight, Carvana now has the infrastructure to supplement its 17 (to 20 depending 2022 Greenfield’s) IRCs with ADESA’s 56 well located locations. This will enable the business to save a lot on inbound and outbound transport and should greatly enhance the velocity of its network. This could be a tailwind for its longer term growth algorithm.
If you take a step back, and think out to say 2024 or 2025, selling 1 million units at a $3,500 GPU is $3.5 billion. If they effectively manage the SG&A piece, there is tremendous operating leverage and scale here. I get the super bearish negative sentiment, as people get swept up using stock prices as their barometers. However, I don’t think most people appreciate the operating leverage in this business, notably when it scales.
Be the first to comment