

JHVEPhoto/iStock Editorial via Getty Images
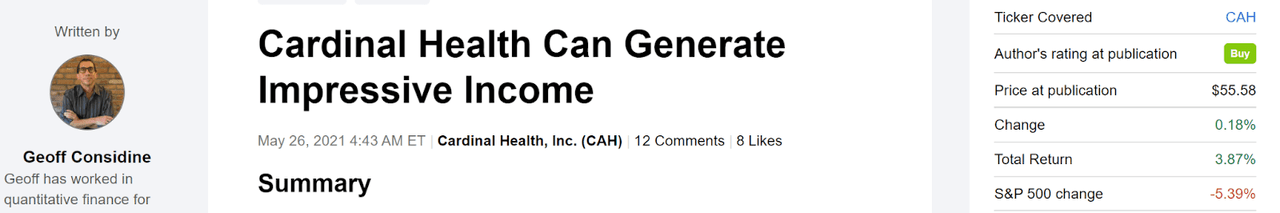
Cardinal Health (NYSE:CAH) is a major distributor of medical supplies and pharmaceuticals, serving 60,000 U.S. pharmacies, 10,000 physician clinics and offices, and 90% of U.S. hospitals. The company has operations in more than 30 countries. In the most recent quarterly earnings, Q3 of FY 2022 reported on May 5, 2022, the company missed the consensus on earnings per share, but beat the consensus on revenue (up more than 14% YoY). Management also trimmed the high range of expected earnings for FY 2022 (see slide 8).
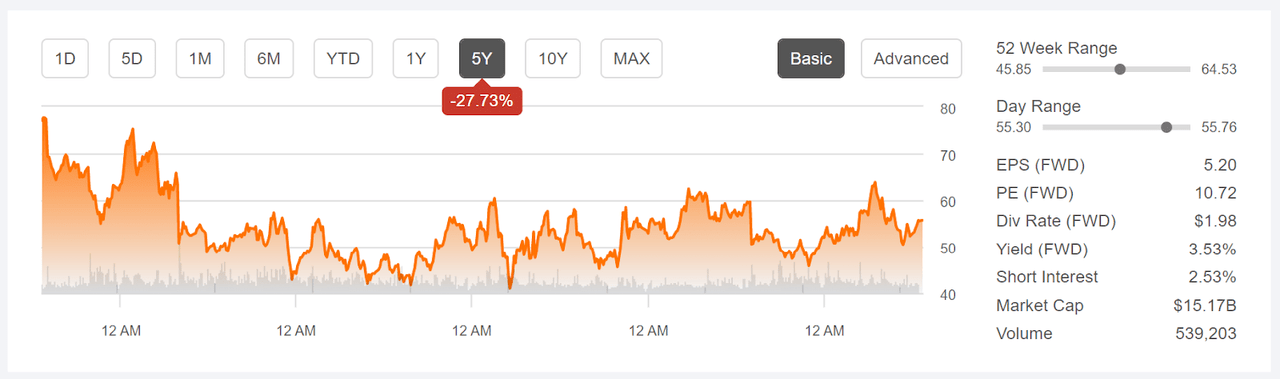
Seeking Alpha
12-Month price history and basic statistics for CAH (Source: Seeking Alpha)
While the company is one of the top 3 pharmaceutical wholesale and distribution companies in the U.S., the benefits to scale have not accrued to shareholders. The trailing total returns substantially lag the medical distribution industry. Over the past 15 years, in fact, the annualized total return lags inflation (1.5% per share for CAG vs. 1.7% for inflation). The shares have rallied in the last month, however, largely in response to a CAG being cleared of wrongdoing in a widely-followed opioid distribution lawsuit.
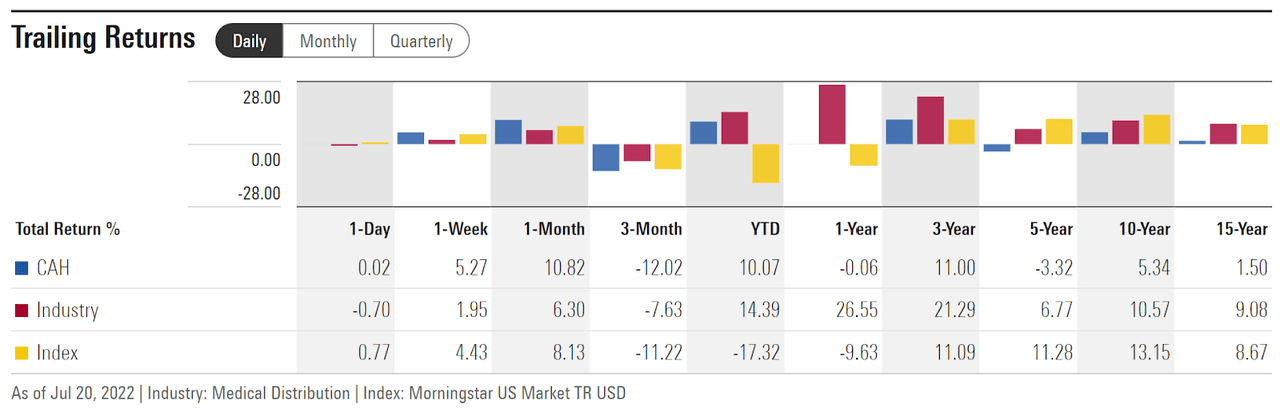
Morningstar
Historical total returns for CAH vs. the medical distribution industry and the U.S. total stock market (Source: Morningstar)
A major reason why the share price has been stagnant over the past 5 years is that the company has not managed to demonstrate a long-term earnings growth trajectory. The consensus outlook is that the company will continue to struggle in this regard. The consensus estimate for EPS growth over the next 3 to 5 years is only 1.1% per year.
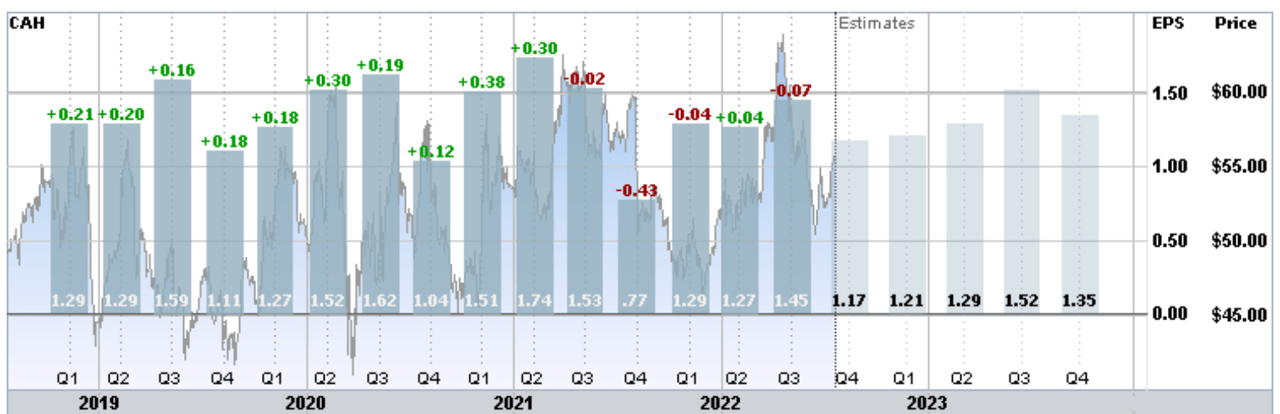
ETrade
Historical (4 years) and estimated future quarterly EPS for CAH. Green (red) values are amounts by which EPS beat (missed) the consensus expected value (Source: ETrade)
I last wrote about CAH on May 26, 2021, about 16 months ago, and I assigned a buy / bullish rating on the shares. At that time, the Wall Street consensus outlook for CAH was neutral to bullish and the consensus 12-month price target was 13.6% above the share price at that time. With the 3.47% dividend yield, the expected total return was almost 17%. With the modest P/E (9.45 at that time), and the strong consensus outlook, CAH looked quite attractive. In addition to looking at valuation and the Wall Street consensus outlook, I also rely on the consensus view implied by options prices, the market-implied outlook. The market-implied outlook for CAH was neutral, with a bearish tilt and expected volatility of 29%. As a rule of thumb, I consider an expected total return that is greater than ½ the expected volatility to be a good risk-return tradeoff, and CAH met this criterion. Considering all of the stock’s attributes, a buy rating made sense.
Seeking Alpha
Previous analysis of CAH and subsequent performance vs. the S&P 500 (Source: Seeking Alpha)
Since my last analysis, CAH has outperformed the S&P 500, largely because the company has performed reasonably well, not least because demand for medical supplies and drugs tends to be fairly inelastic. In my analysis, I also noted that selling covered calls against CAH looked quite attractive (hence the title of the post). Having the stock go essentially sideways since the post (total price gain of 0.18%) was to the benefit of this strategy.
For readers who are unfamiliar with the market-implied outlook, a brief explanation is needed. The price of an option on a stock is largely determined by the market’s consensus estimate of the probability that the stock price will rise above (call option) or fall below (put option) a specific level (the option strike price) between now and when the option expires. By analyzing the prices of call and put options at a range of strike prices, all with the same expiration date, it is possible to calculate a probabilistic price forecast that reconciles the options prices. This is the market-implied outlook. For a deeper explanation and background, I recommend this monograph published by the CFA Institute.
With more than a year since my last analysis of CAH, I have calculated an updated market-implied outlook and compared this with the current Wall Street consensus outlook in revisiting my rating.
Wall Street Consensus Outlook for CAH
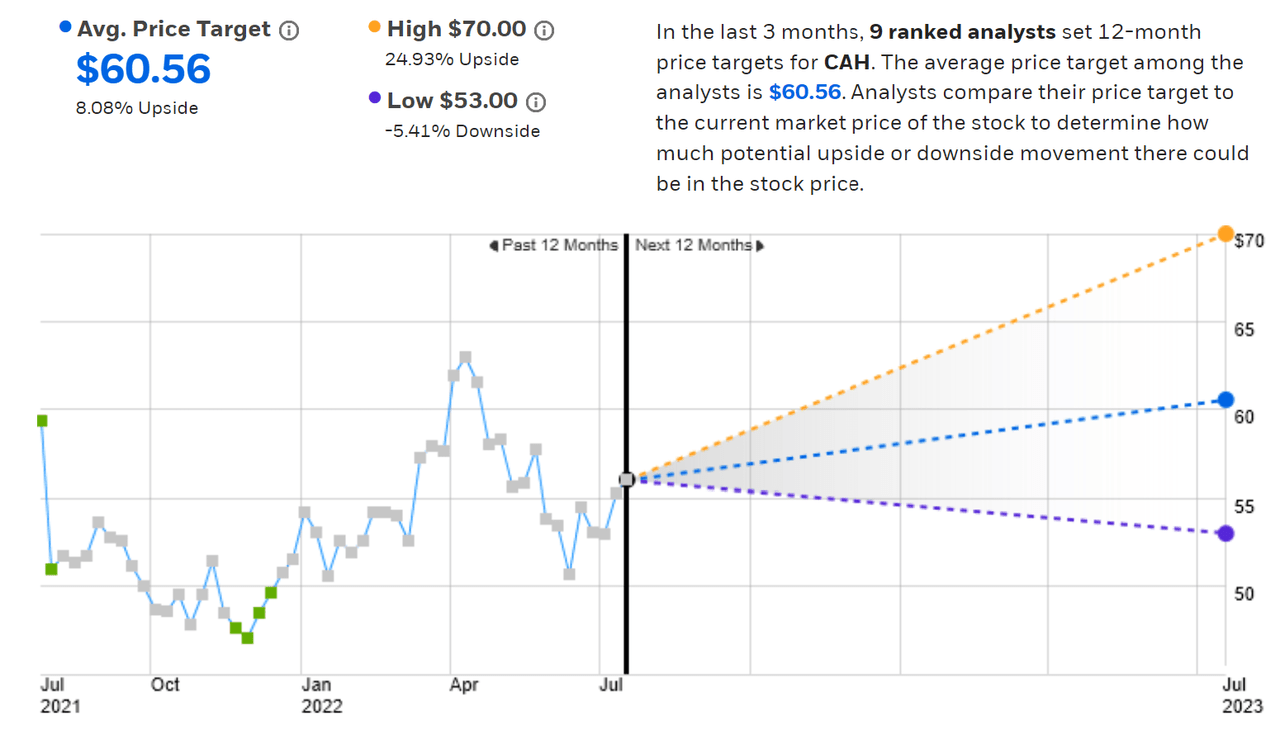
ETrade calculates the Wall Street consensus outlook for CAH using ratings and price targets from 9 ranked analysts who have published their views over the past 3 months. The consensus rating is neutral, as it has been for most of the past years. The consensus 12-month price target is 8.1% above the current share price. The range of individual price targets is relatively narrow, adding confidence in the meaningfulness of the consensus as a predictive measure.
ETrade
Wall Street analyst consensus rating and 12-month price target for CAH (Source: ETrade)
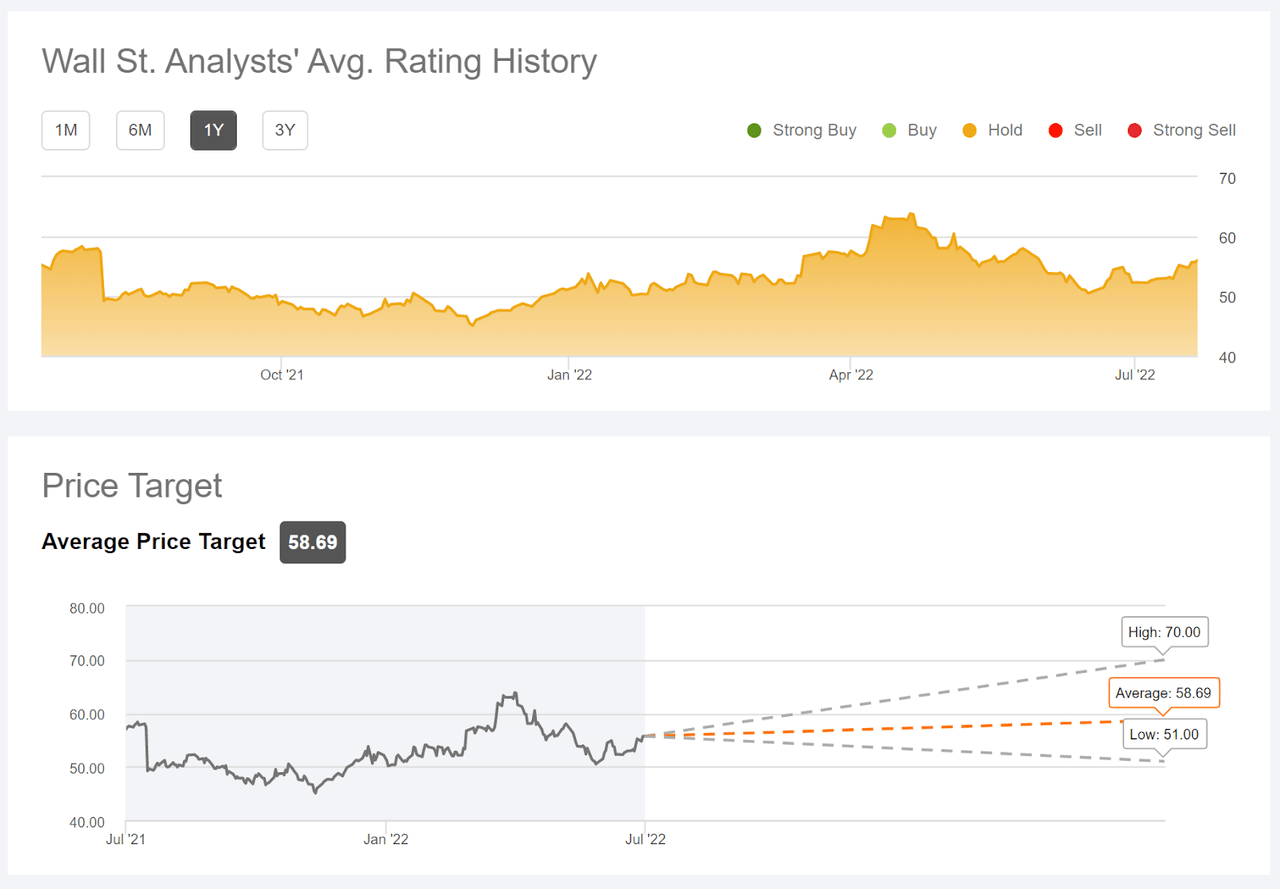
Seeking Alpha calculates the Wall Street consensus outlook by aggregating the views of 15 analysts who have published ratings and price targets over the past 90 days. The consensus rating is neutral and the consensus 12-month price target is 4.7% above the current share price.
Seeking Alpha
Wall Street analyst consensus rating and 12-month price target for CAH (Source: Seeking Alpha)
The average of these two consensus price targets indicates an expected 6.4% price return over the next year. Adding the 3.5% dividend yield, the total expected return is 9.9%. This is considerably lower than the Wall Street consensus for expected 12-month return in my previous analysis (17%).
Market-Implied Outlook for CAH
I have calculated the market-implied outlook for CAH for the 6-month period from now until January 20, 2023, using the prices of call and put options that expire on this date. I selected this specific expiration date to provide a view through the end of the year and because the options trading volume for longer-dated options drops off dramatically beyond the January expiration.
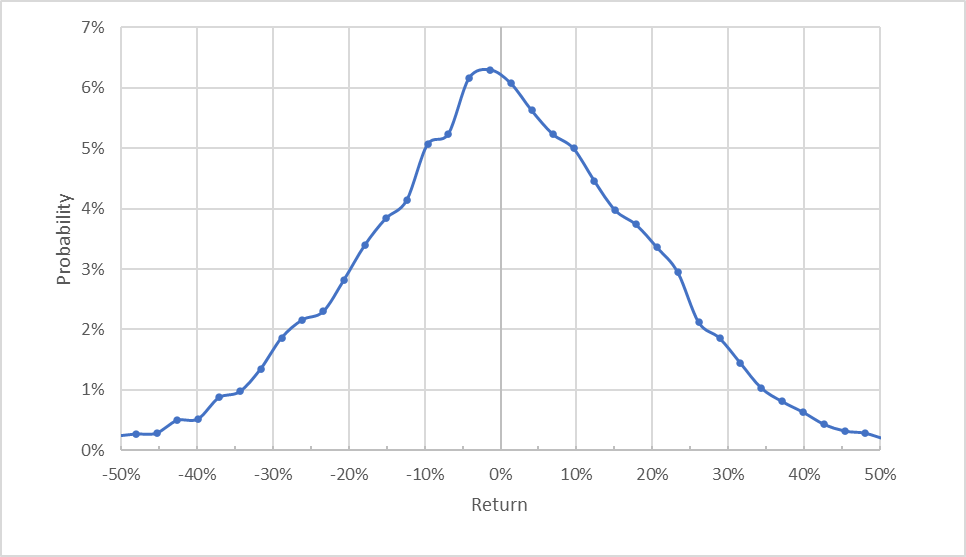
The standard presentation of the market-implied outlook is a probability distribution of price return, with probability on the vertical axis and return on the horizontal.
Geoff Considine
Market-implied price return probabilities for CAH for the 6-month period from now until January 20, 2023 (Source: Author’s calculations using options quotes from ETrade)
The market-implied outlook for CAH for the next 6 months is generally symmetric, with comparable probabilities of positive and negative returns, although the peak in probability is slightly tilted to favor negative returns. The expected volatility calculated from this distribution is 29.6% (annualized), almost identical to the expected volatility back in May of 2021.
To make it easier to compare the relative probabilities of positive and negative returns, I rotate the negative return side of the distribution about the vertical axis (see chart below).
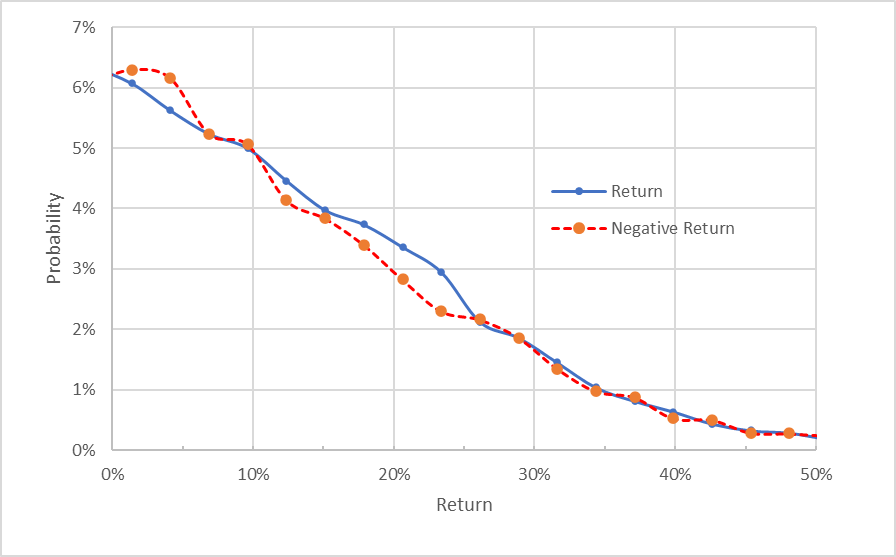
Geoff Considine
Market-implied price return probabilities for CAH for the 6-month period from now until January 20, 2023. The negative side of the distribution has been rotated about the vertical axis (Source: Author’s calculations using options quotes from ETrade)
This view shows that, aside from the slightly-elevated probabilities for small-magnitude negative returns (the dashed red line is above the solid blue line for returns from 0% to 5% on the chart above), the probabilities of positive and negative returns are either almost identical or slightly favoring positive returns (the region over which the blue line is above the dashed red line).
Theory indicates that the market-implied outlook is expected to have a negative bias because investors, in aggregate, are risk-averse and thus tend to pay more than fair value for downside protection. There is no way to measure the magnitude of this bias, or whether it is even present, however. Considering this potential bias, the market-implied outlook is interpreted as slightly bullish.
In the current trading day, I have purchased shares of CAG for $56.21 and sold call options with a $57.5 strike price, expiring on January 20, 2023, for $3.79. This net position provides 6.74% in income ($3.79/56.21) over the next 6 months. Adding the two expected dividend payments over this period adds another 1.76% in income, for a total of 8.5% of income. Given the very modest expectations for upside in CAH, selling covered calls looks quite attractive.
Summary
CAH is delivering consistent, if unimpressive, results. The company has not managed to demonstrate consistent earnings growth over an extended run of years. There are potentially benefits to massive scale for a wholesaler, but size also makes it harder to change direction. The Wall Street consensus outlook supports a low- / no-growth view, with expected EPS growth of only 1.1% per year over the next 3 to 5 years. The consensus rating is neutral and the consensus 12-month price target implies an expected total return of 9.9% over the next year. This level of return is not terribly attractive, given the expected volatility of 29.6%. As noted earlier, I look for an expected return that is at least ½ the expected volatility for a stock to be considered an attractive buy. The market-implied outlook to early 2022 is slightly bullish. I am changing my overall rating on CAH to neutral / hold, although selling covered calls provides an attractive level of income.
Be the first to comment