

DOUGBERRY/E+ via Getty Images
Bear Market? Look Deeper
It always amazes me to think that you and I wield the power to trigger a two-trillion-dollar destruction of market capitalization in a puff of thin white smoke, simply by agreeing for me to sell you one share of my Apple (AAPL) stock for one penny. The instant we close that sale, the last quoted price for AAPL will crash (albeit on very thin volume) and for just one fleeting moment, the entire market cap for AAPL will nearly evaporate… as I laugh with ominous satisfaction for having finally, truly earned my nickname: Doctor Fear. Mwah ha ha ha ha ha.
Stock prices, you see, can be rather deceptive and don’t necessarily capture the subsurface realities of corporate value. And I suppose you could say the exact same thing about the broader stock market indexes, too. Take the S&P 500, for example. If you look at this chart for the Vanguard 500 Index ETF (VOO) from Google Finance, what do you see? What I see is a market that’s down 15% this year and describing a straightforward bearish pattern of lower highs and lower lows. I mean, what defines a bear market if not that?
S&P 500 (Google Finance)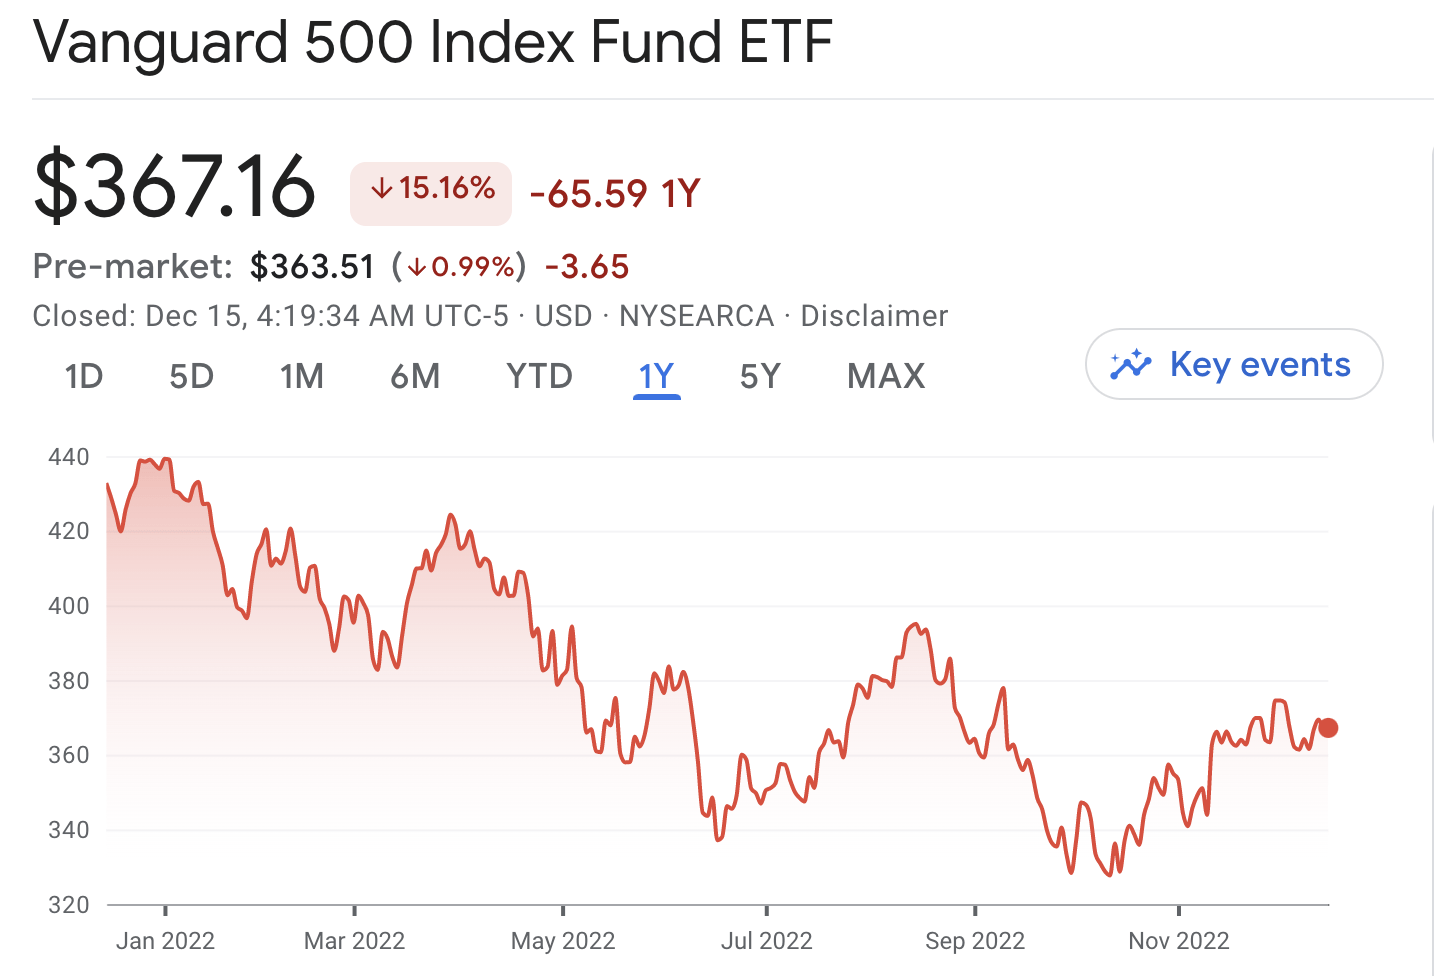
But peel the onion back a bit and the story changes for what we see then is not so much a bear market but rather a market rotation.
For many years now, growth stocks have violently outperformed value stocks on a medium-term basis. According to Google Finance, the iShares S&P 500 Growth ETF (IVW) is up over 60% in the past five years, roughly twice the returns on the iShares S&P 500 Value ETF (IVE).
Value vs. Growth (Google Finance)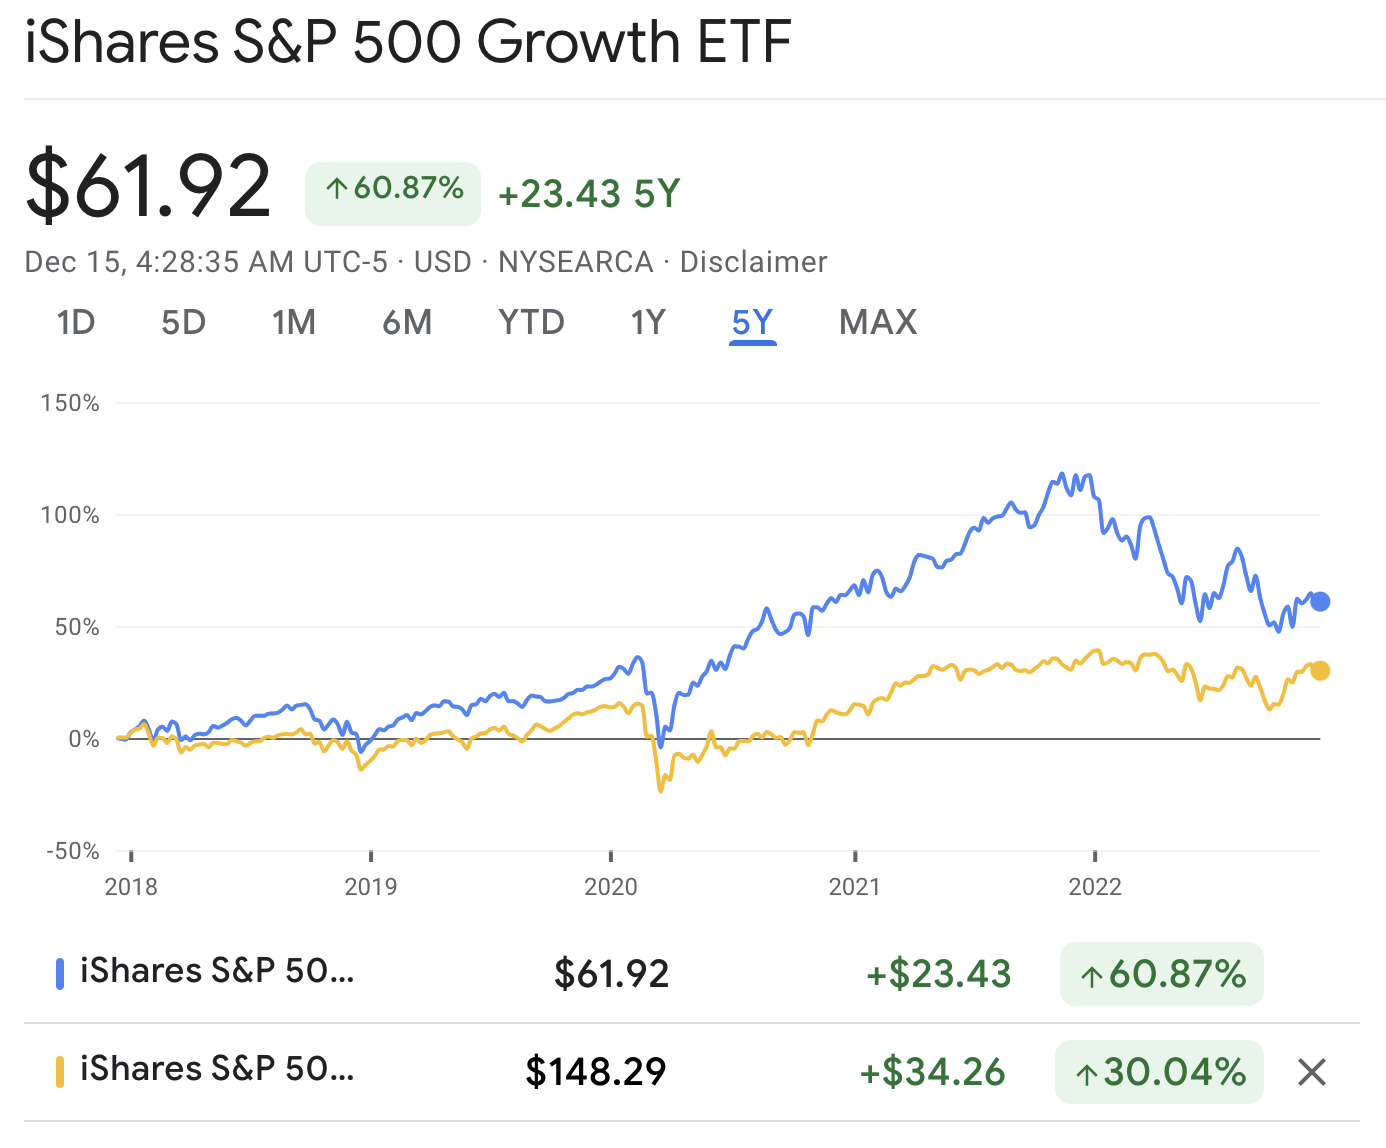
And oh, but how that story has changed over the past year. According to Google Finance, IVE is now down only -3% for the year (or down -1% once you add back the 2% dividend yield) compared to a dividend-adjusted loss of roughly 25% for IVW.
Value vs. Growth (Google Finance)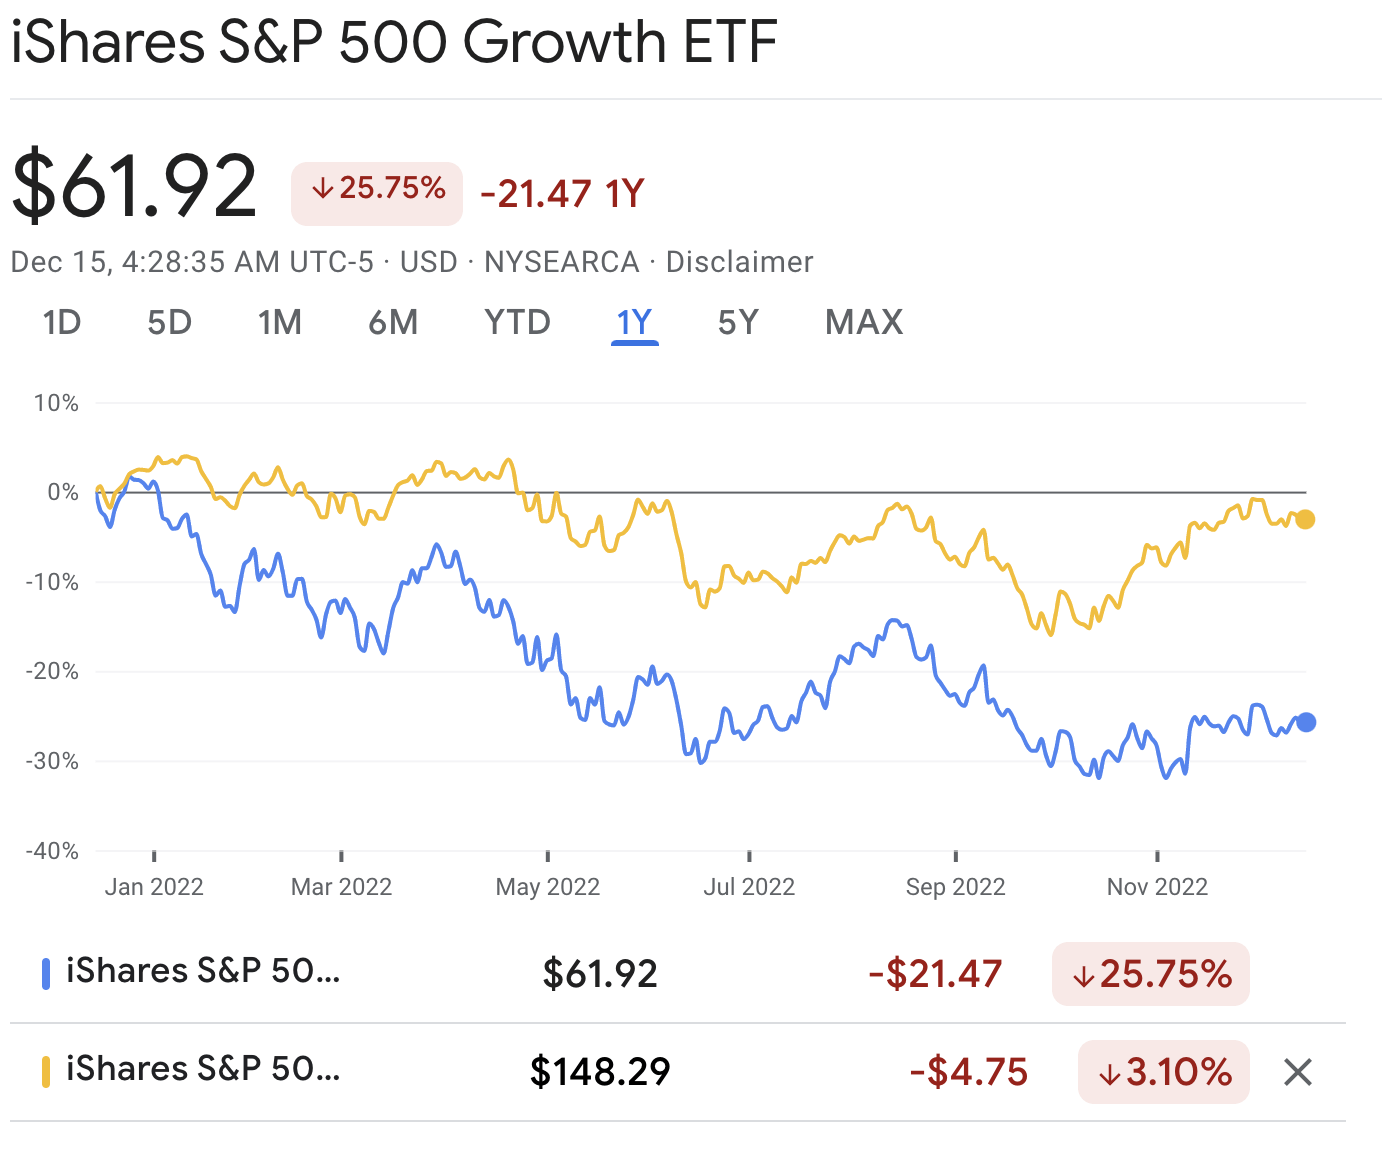
As They Say, The Trend is Your Friend
From a stock trader’s perspective, there is rarely any sense arguing with the market. On the contrary, you want to identify a price trend, trade with it and keep trading with it until the trade stops working. The winning trade this year? The chart (above) says it all. Sell growth, buy value.
Personally, I don’t think the right question to ask is whether the broader market will be higher, lower or flat next year. Maybe the more profitable question to ask is whether value stocks are likely to continue outperforming growth stocks. You could argue that from a technical perspective, value stocks have already entered a bullish trend, with ETFs like IVE trading above their upward-sloping short-term and long-term moving price averages. The short-term price average is already higher than the long-term price average according to StockCharts.com, which some traders take as an indicator of bullish momentum.
Moving Average for Value (StockCharts.com)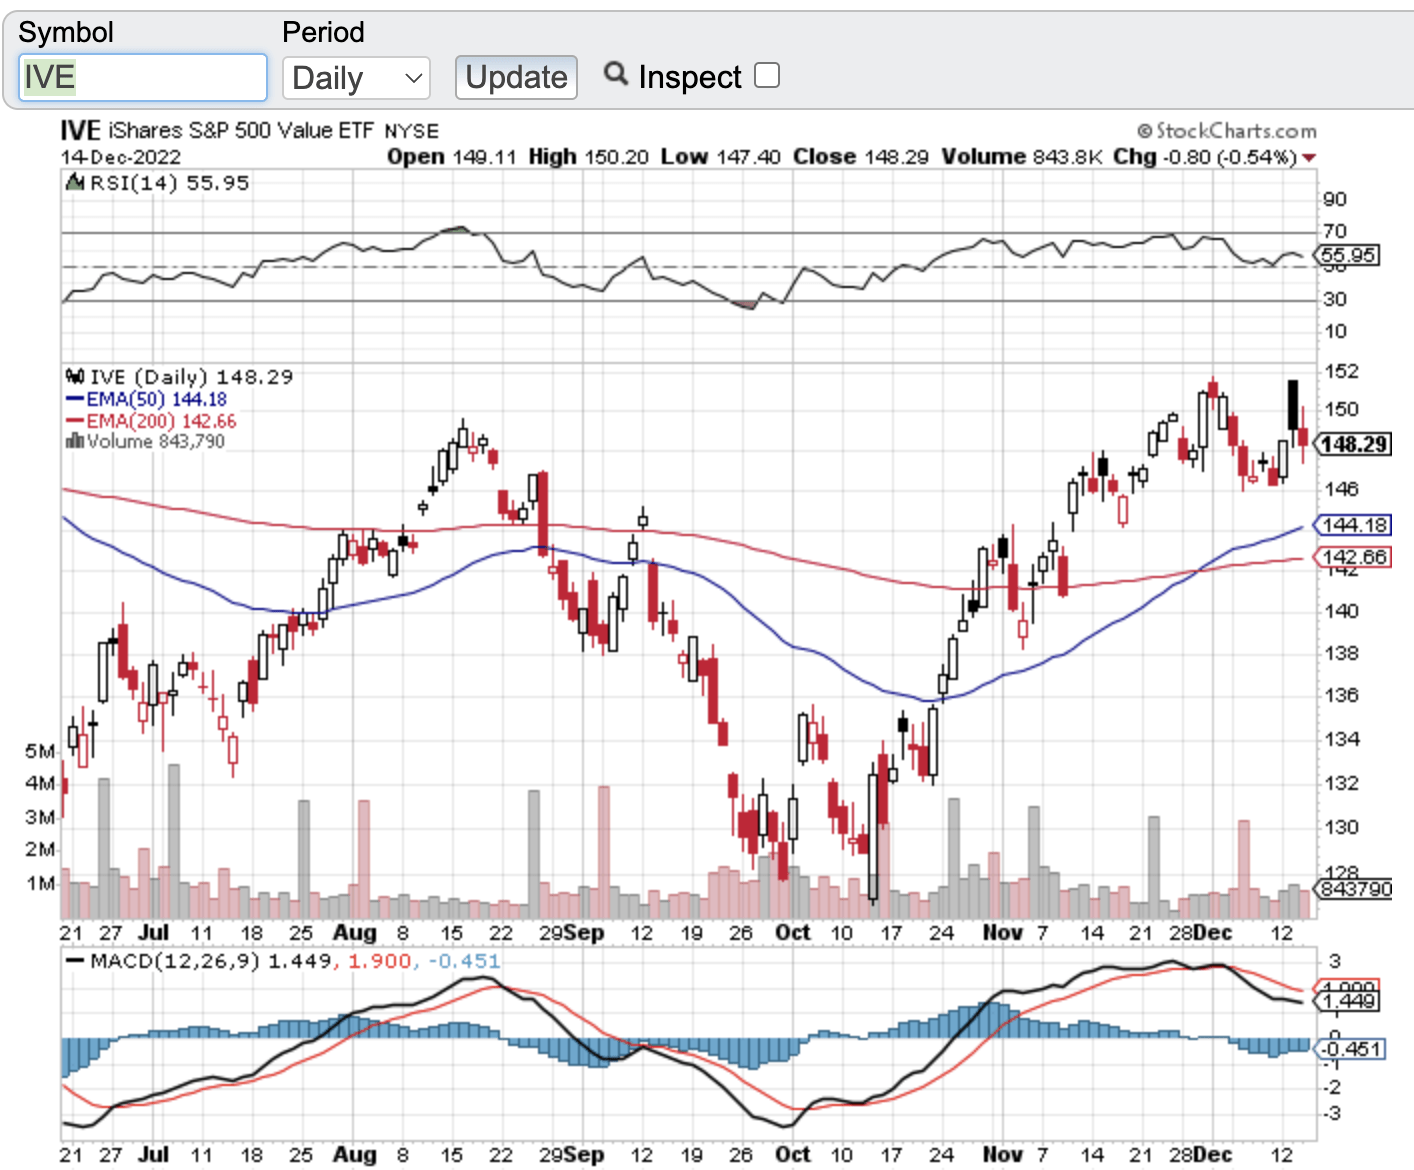
But growth stocks? According to StockCharts.com, not so much. ETFs like IVW remain trapped under their downward-sloping long-term moving price averages, repetitiously testing trading support at their short-term moving price averages as traders seemingly probe for a decisive break lower.
Growth Stock Trading Momentum (StockCharts.com)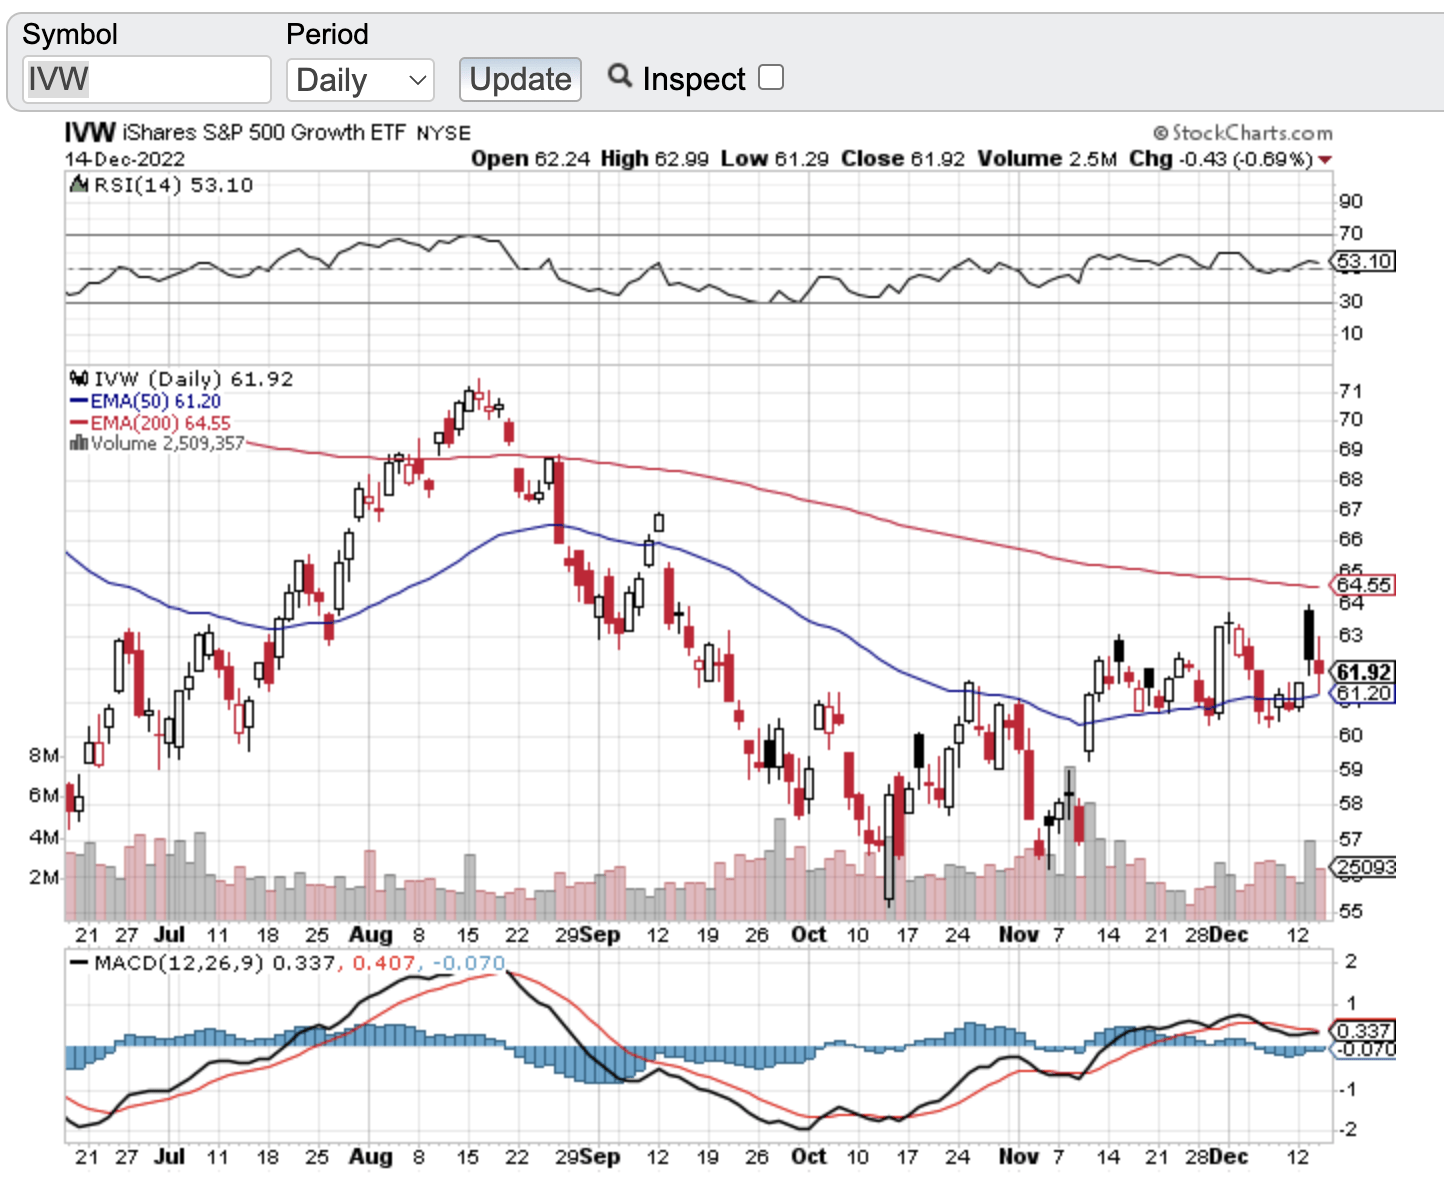
In a nutshell, some traders could conclude that value stocks look to be a far safer bet than growth stocks for the moment. The next question? How long can that moment last?
My personal guess (and it is just that – a guess) is that growth stocks were probably in a significant bubble this time last year. Companies like Tesla (TSLA) and Nvidia (NVDA) traded at astounding multiples, companies like Riot Blockchain (RIOT) had soared from just over $1 per share to over $70 per share from February 2020 to February 2021, and fund investors followed heretofore unknown fund managers with a nearly religious devotion. In a lot of ways, I always felt like the post-Covid bubble reminded me of the tech bubble of 2000. The denouement of that particular “moment” lasted for over a decade. Back then, after the overall stock market bottomed in 2003, some value stocks and value stock ETFs recovered and reached new highs by mid-to-late 2004. By contrast, according to CNBC.com, growth stock funds such as the Invesco QQQ ETF (QQQ) continued to underperform value stocks and didn’t reach previous highs until 2014 – and then didn’t match the performance of value stocks until four years after that. Whereas stock prices skitter and flit like a hummingbird’s cardiovascular system, the value versus growth pendulum swings very S…L…O…W…L…Y.
Value Outperformed Growth For Over One Decade (CNBC.Com)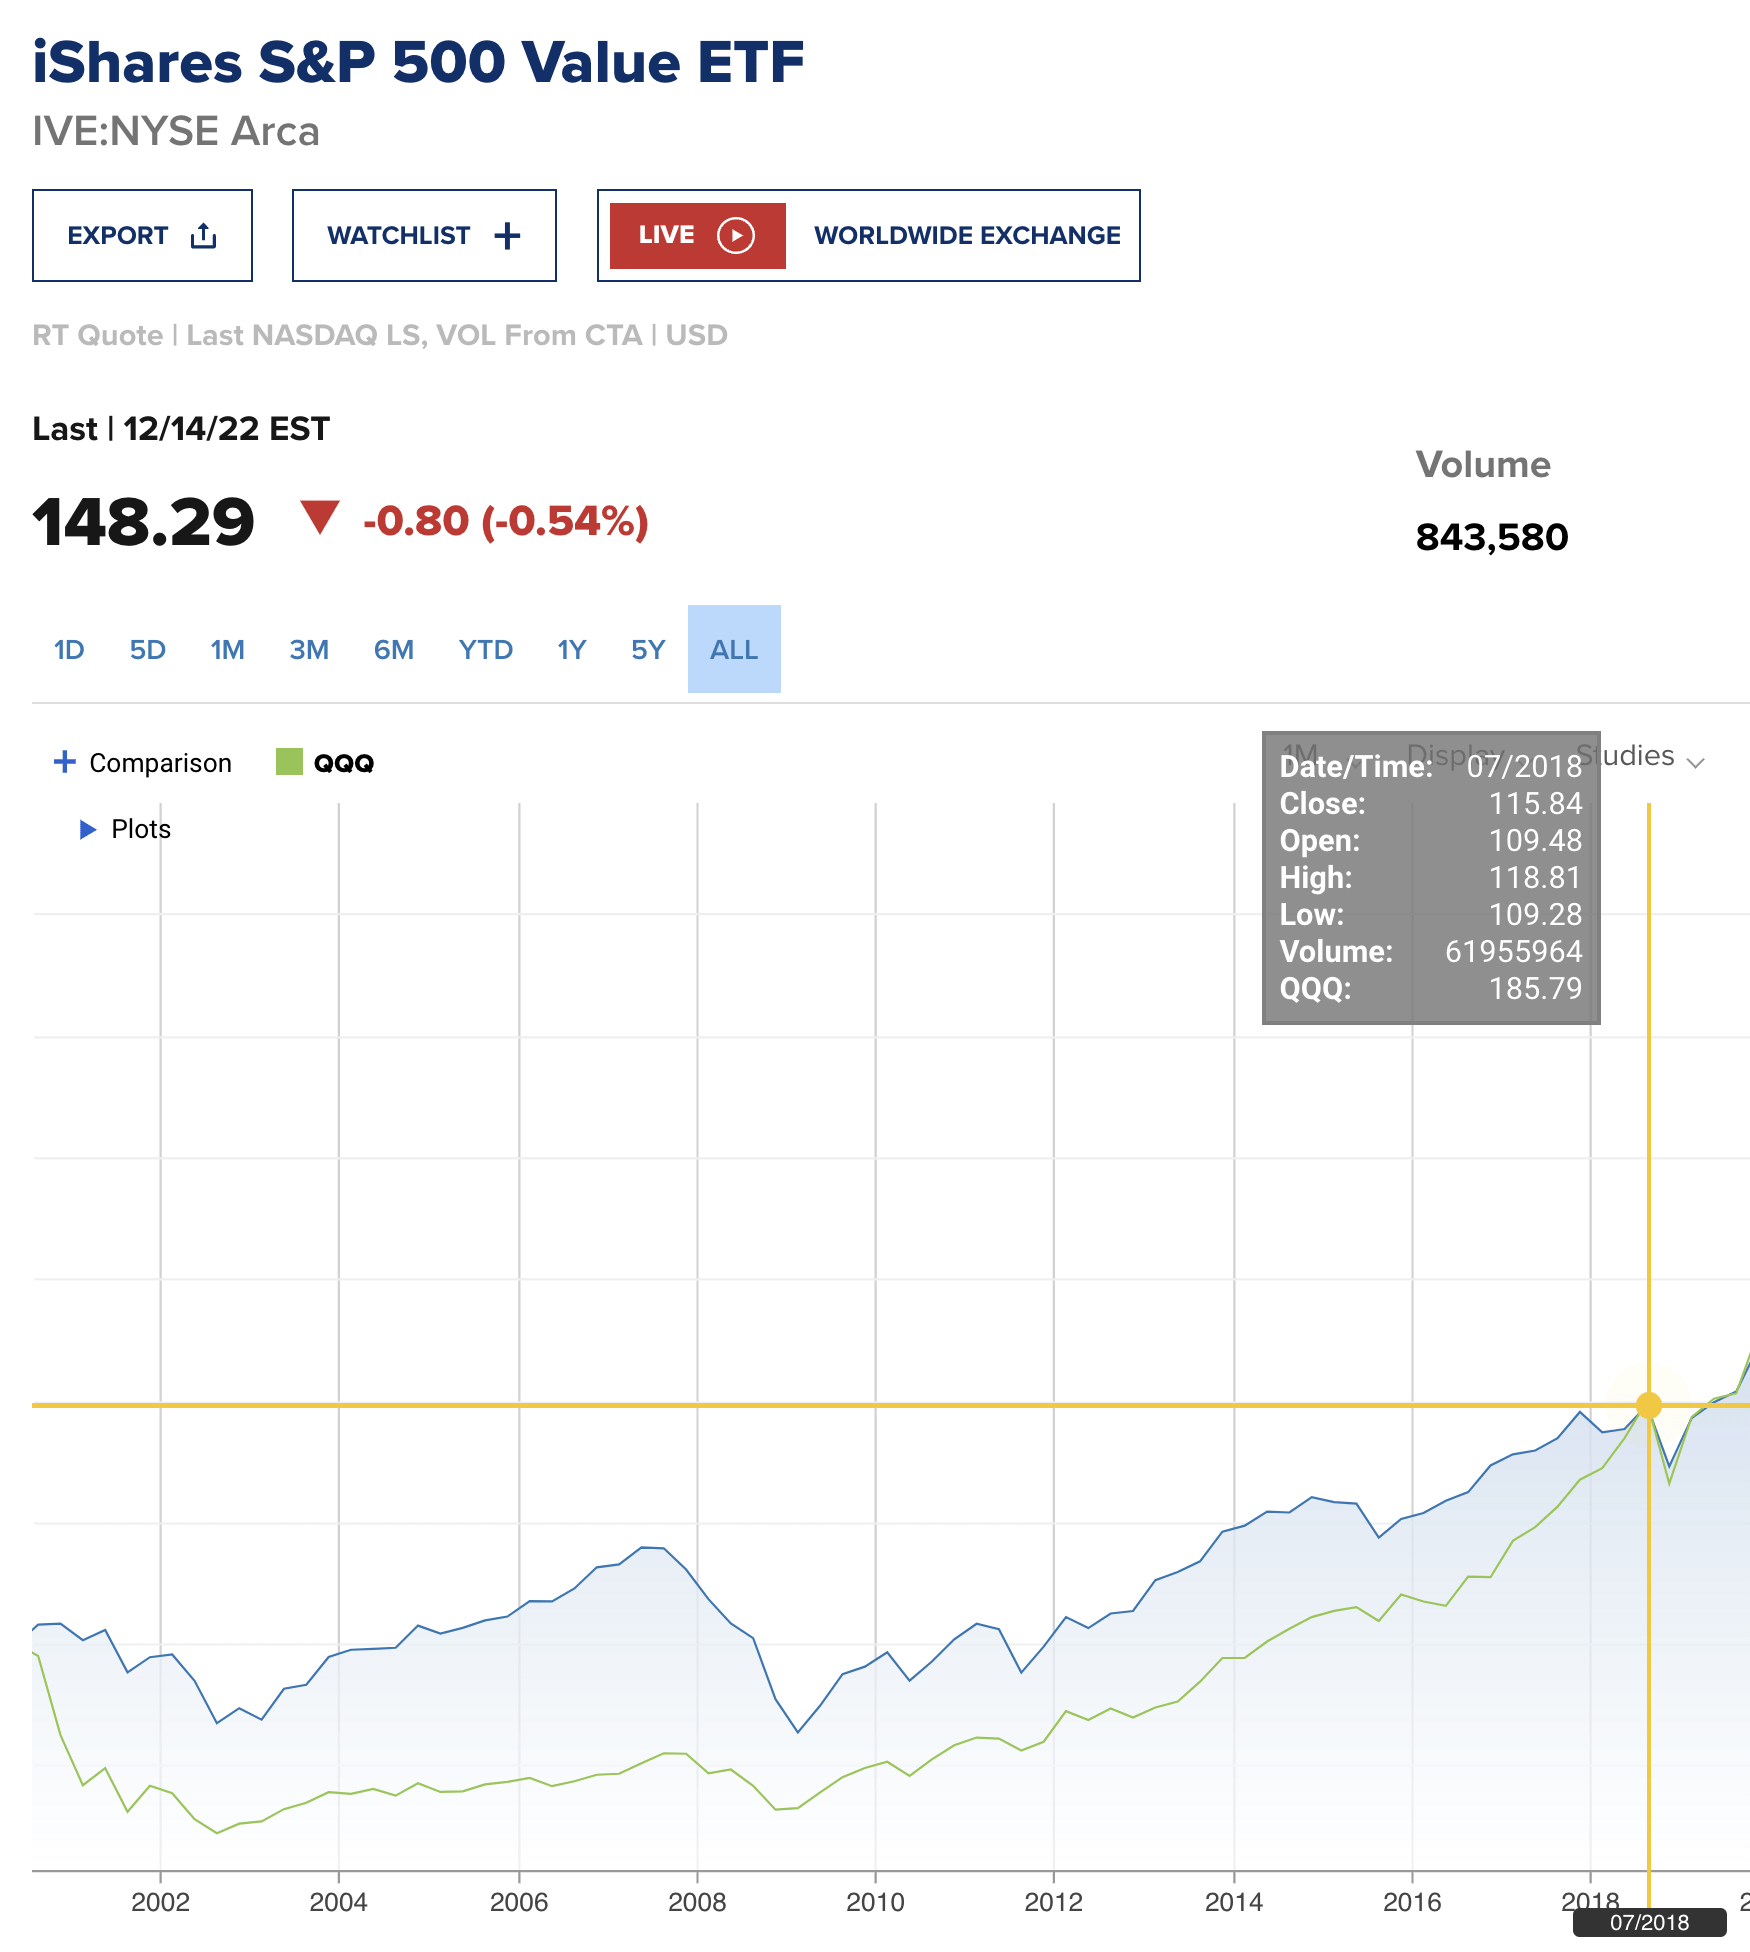
Obviously, I have no clue whether the same thing will happen this time around, but what market history highlights (in my mind, at least) is that the same sort of thing COULD happen this time around, too. I certainly can’t see any overwhelming reason why it SHOULDN’T. Value stocks could reach (and in certain cases already have reached) new highs. And with history as a guide, that may occur long, long, long before growth stocks come close to obtaining their previous glory.
Curb Your Enthusiasm
But when it comes to stodgy valuation stocks, it’s never an “off to the races” moment. The water utilities such as Essential Utilities (WTRG) keep supplying water to their customers, Kimberly-Clark (KMB) keeps selling Kleenex, and share prices creep forward in pace to the somber drumbeat of steady yet boring corporate profits. It can be a very dull time for investors accustomed to fast and heady returns on “next big new thing” stocks… but a sublime time for investors who repetitiously reinvest dividends into more and more shares of reasonably-priced dividend paying stocks, watching with a bleary-eyed yawn as their portfolio income compounds higher and higher year in and year out.
Which is, of course, precisely what I plan to do with myself over the coming decade (and I might add, as I have done over the previous two decades). Our value-oriented family portfolio is now down 5.52% from its all-time peak last year (or about 2.9% once you add back our dividend yield), compared to a 14% loss for the Vanguard Total Stock Market ETF (VTI) according to Google Finance.
Family Portfolio Performance (Google Finance)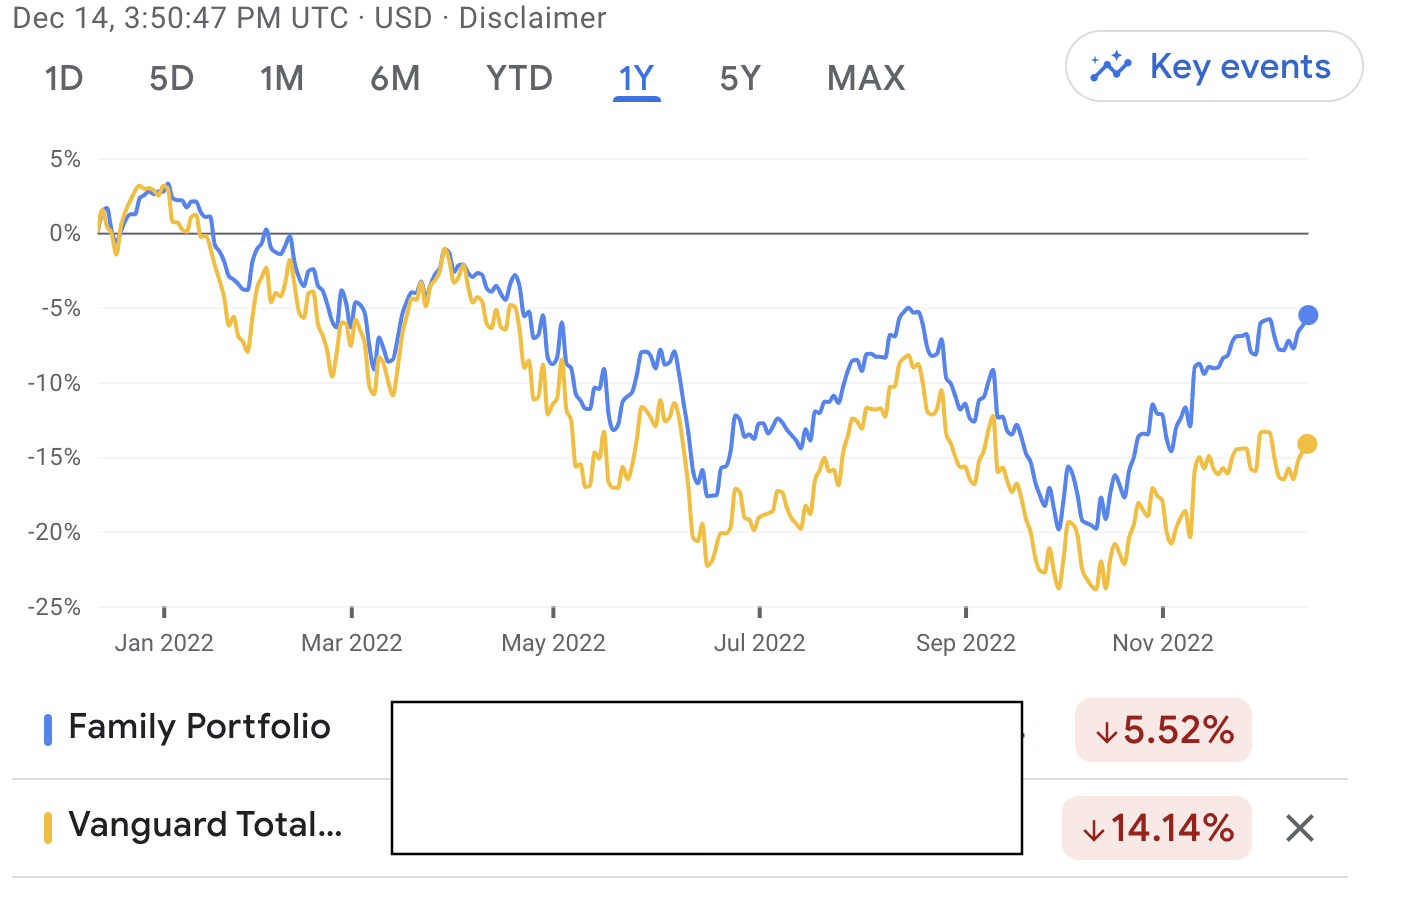
Over the past 5 years, our family’s portfolio has appreciated about 1.5% more than VTI according to Google Finance, or roughly 7% in total once you factor in our 2.6% dividend yield advantage over VTI’s 1.56% dividend yield.
Long-term Family Portfolio Performance (Google Finance)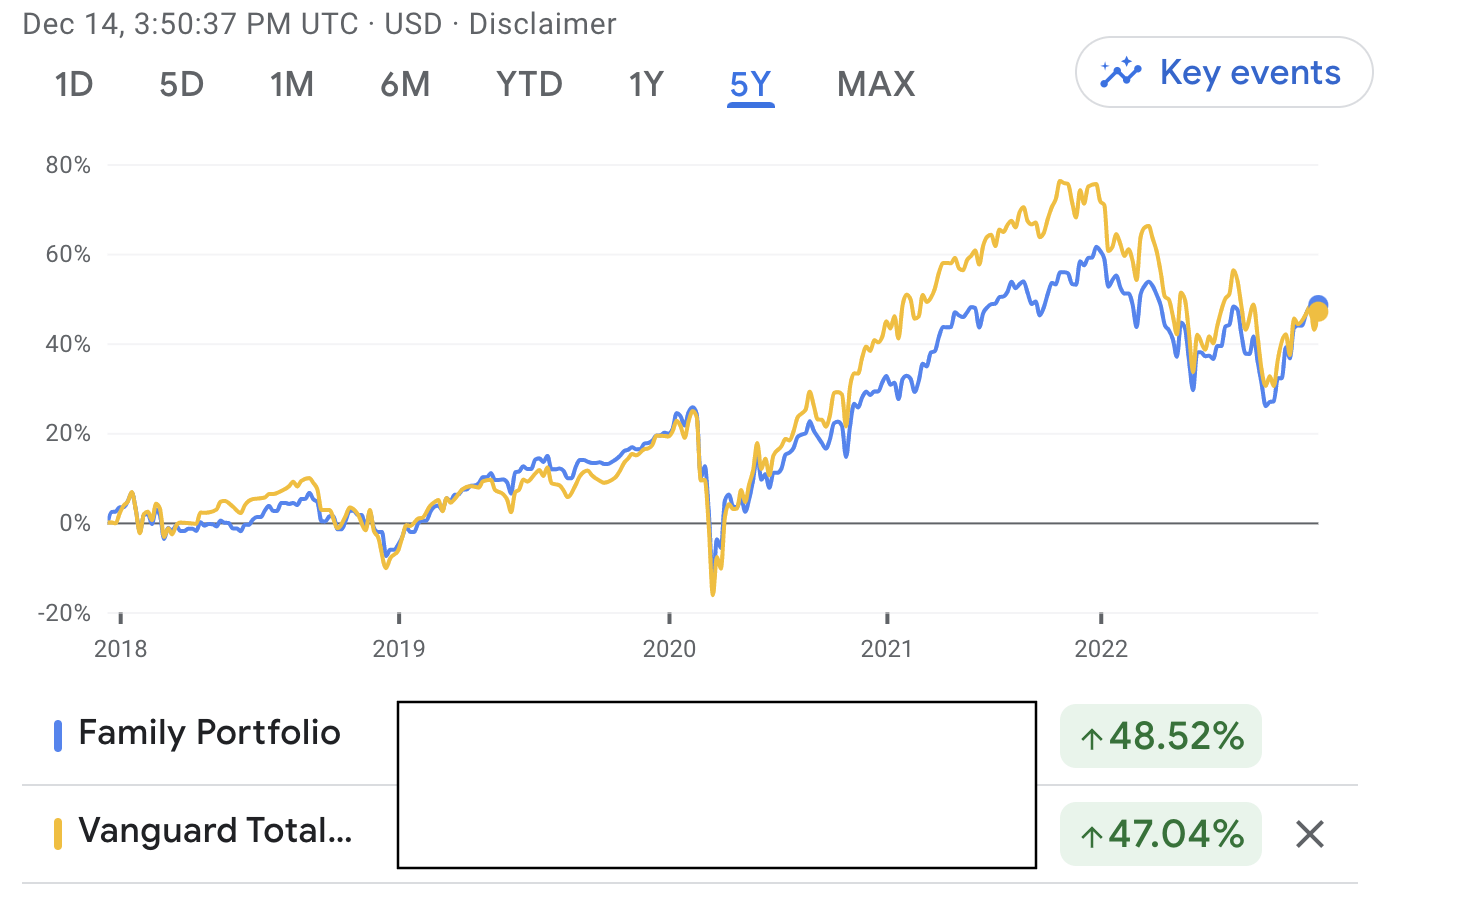
Here is a complete list of all the companies and funds we own. The overwhelming bulk of our investments are in value-oriented, dividend-paying stocks of companies with steady profits, durable profit margins and at least A-rated balance sheets. And I’ve set out my investment goal for next year, which is to do literally NOTHING besides (1) keep personal spending at a reasonable level (2) reinvest dividends into sensibly-priced companies with exceptional products and services, (3) focus on being content, (4) exercise and eat healthy food to increase the number of years our portfolio income can compound.
Family Portfolio (Author’s Personal Spreadsheet)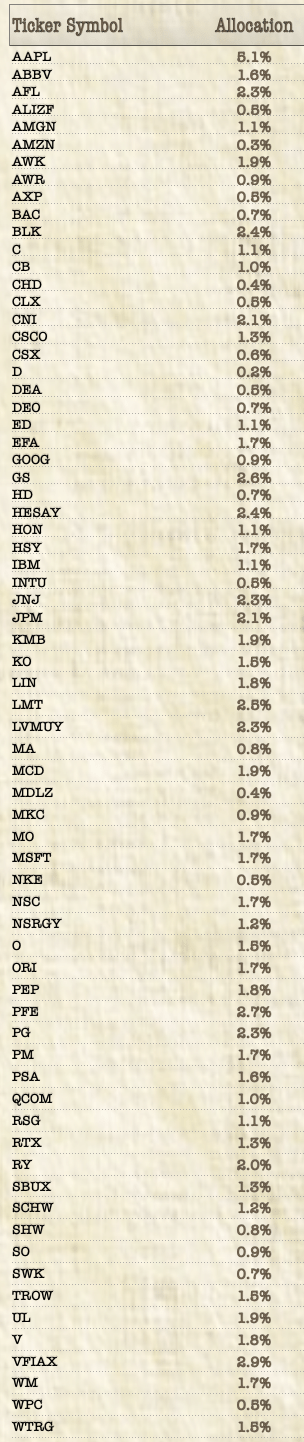
Be the first to comment