

ljubaphoto
A number of readers from my last article on Canadian utilities were interested in renewable utilities. And the article format of comparing with peers seemed to be well-received.
So, I’m doing a similar comparison of Canadian renewable utilities here for TransAlta Renewables (OTCPK:TRSWF) (TSX:RNW:CA) and Brookfield Renewable Partners L.P. (BEP) (BEP.UN:CA)/Brookfield Renewable Corp. (BEPC) (BEPC:CA).
[Unless otherwise noted, the figures for TransAlta are in Canadian dollars because the utility reports in C$, while the figures for Brookfield Renewable are in U.S. dollars.]
TransAlta Renewables
TransAlta Renewables identifies itself as one of the largest generators of wind power in Canada. However, it’s more than just wind. Its roughly 3,000 MW portfolio is diversified across about 50 facilities, including 26 wind facilities, 13 hydroelectric facilities, 8 natural gas generation facilities, and 2 solar facilities.
Its assets are primarily in North America, including in Canada (British Columbia, Alberta, Ontario, Québec, and New Brunswick) and the U.S. (states of Pennsylvania, New Hampshire, Wyoming, Massachusetts, Michigan, Minnesota, Washington, and North Carolina). Finally, it also has assets in the state of Western Australia.
So far this year, the renewable utility has reported results for the first half of the year (“H1”). It’s positive to see growth year over year. Here are some highlights:
- Renewable energy production growth of 18% to 2,541 GWh
- Revenue growth of 29% to C$282 million
- Adjusted EBITDA growth of 20% to C$265 million
- Free cash flow (“FCF”) growth of 15% to C$195 million
- FCF per share growth of 14% to $0.73
- Cash available for distribution growth of 7% to C$139 million
- Cash available for distribution per share growth of 6% to C$0.52
The cash available for distribution per share resulted in a payout ratio of 90% in H1, an improvement of 96% from H1 2021.
Quick figure comparisons to the base year of 2019 (before the pandemic) may be telling (especially when we do a similar comparison with peer company BEP.) Here are some highlights for the trailing-12-month (“TTM”) figures:
- Revenue growth of 20% to C$534 million
- Operating cash flow down 14% to C$285 million
TransAlta Renewables doesn’t have an S&P credit rating. Perhaps that’s one reason why it stands out with a high yield of almost 5.5% at C$17.24 per share at writing.
It has kept the same dividend since 2019. It already pays a high yield, so it’s the right move to save cash for other purposes such as growth. In the TTM, it paid out C$251 million in dividends and put C$79 million in capital investments for long-term growth.
Its end-of-Q2 current ratio was 0.96 versus 2019’s 1.93. This is concerning as the low ratio may lead to liquidity issues. But at least its cash to current asset ratio has improved to 57% versus 2019’s 22%.
Its debt to asset ratio is 46% vs 2019’s 38%. So, the company is now using more debt to finance its assets than in 2019, which makes it a tad riskier since at some point, it’ll need to pay back that debt. That said, its interest expense actually dropped marginally as a percentage of revenue to 9% from 9.2% in 2019.
TransAlta Renewables is known to make acquisitions to drive growth. Since its initial public offering in 2013, it has made approximately C$3.4 billion of acquisitions. The stock’s recent market cap and enterprise value are C$4.6 billion and C$4.3 billion, respectively.
At the end of 2021, it also had three facilities that were joint operations for which the utility operated and had a 50% stake in. The benefit of joint operations includes lower investment risk.
Brookfield Renewable
Brookfield Renewable is a pure-play renewable utility. You can invest in the limited partnership. Else, you can invest in the corporation version of the stock for a small premium. (At writing, it trades at a 4% premium.)
BEP enjoys an investment-grade S&P credit rating of BBB+. Its portfolio totals operating capacity of approximately 21 GW across North & South America, Europe, and Asia. Its portfolio is also diversified by technology – 50% is hydroelectric generation, 22% is wind, 15% is solar, and 13% distributed generation, storage, and others.
Here are some highlights of BEP’s H1 results:
- Renewable energy production growth of 7% to 15,403 GWh
- Revenue growth of 18% to US$2,410 million
- Adjusted EBITDA growth of 5% to US$1,046 million
- Funds from operations (“FFO”) growth of 5% to US$537 million
- FFO per unit growth of 5% to $0.83
This also suggests a sustainable FFO payout ratio of about 77% in H1
TTM quick figure comparisons to the base year of 2019:
- Revenue growth of 50% to US$4,467 million
- Operating cash flow down 7% to US$1,124 million
In the TTM, BEP paid out US$883 million in dividends and had capital investments of US$2,335 million for long-term growth.
About 90% of BEP’s revenues are contracted with a long-term power purchase agreement of about 14 years. This makes its cash flow highly predictable.
The utility targets total returns of 12-15% and cash distribution growth of 5-9% annually. The drivers include management’s ability to invest via a value investing approach and the utility’s operational expertise to optimize assets.
Is It Better to Invest in TransAlta Renewables or Brookfield Renewable?
The renewable power pie is growing quickly. This slide from BEP shows essentially an explosion of commitments to net zero.
BEP Corporate Presentation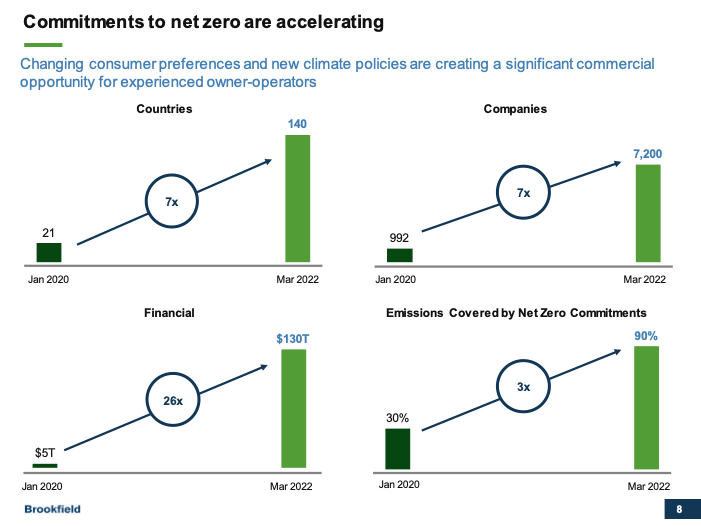
Although both are global companies, Brookfield Renewable has a larger scale and is more diversified. In its pipeline, it already has development projects of about 48 GW that will 3.3 times its current generating capacity to almost 69 GW, including 9 GW of development that are secured over the next three years.
BEP also provides investors better sleep at night from its commitment to an increasing cash distribution – a streak of about 12 years. For reference, its 5- and 10-year cash distribution growth rates are 5.1% and 5.7%, respectively.
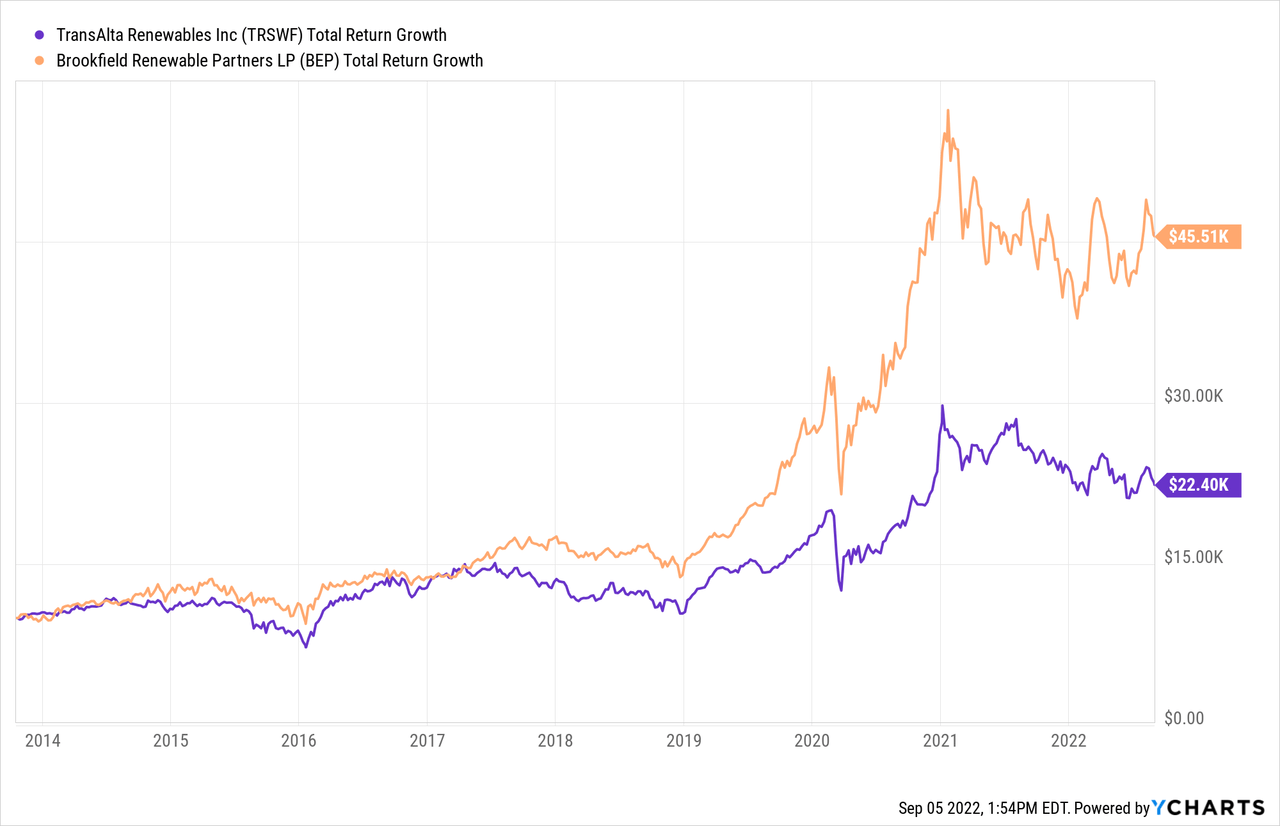
The final test is total returns to shareholders. In the past one, three, five, and 10 years, BEP outperformed TransAlta Renewable on both the Canadian and U.S. exchanges. The charts below show the growth of an initial $10,000 investment over a decade.
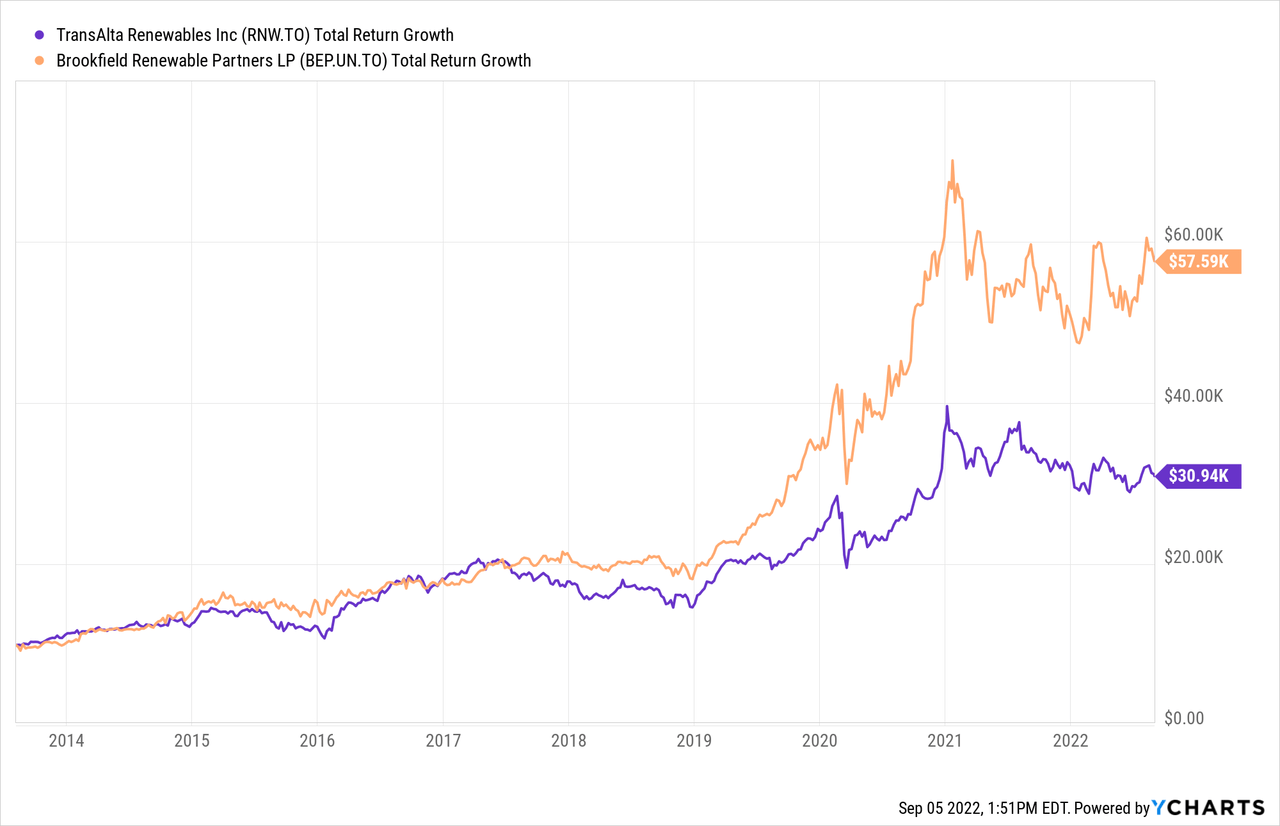
TransAlta Renewables was a decent investment, returning almost 12% per year over the last 10 years on the TSX and returning about 8.4% on the U.S. exchange in the period. It’s just that BEP was an even better investment, returning over 19% per year on the TSX and more than 16% annually on the U.S. exchange in the period.
Past results are not indicative of future results. Consequently, we would, at best rate TransAlta Renewables as a “hold”.
Be the first to comment