

skynesher
Thesis
Lithia & Driveway (NYSE:LAD) has been a machine over the last decade. It has consistently earned a 20% return on its equity. While continually being able to grow the equity it can employ in its business.
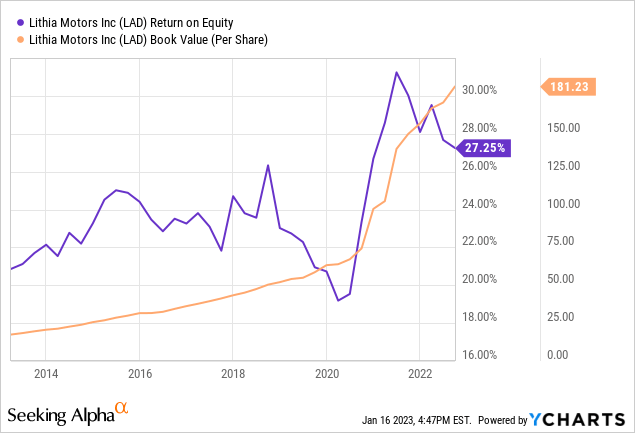
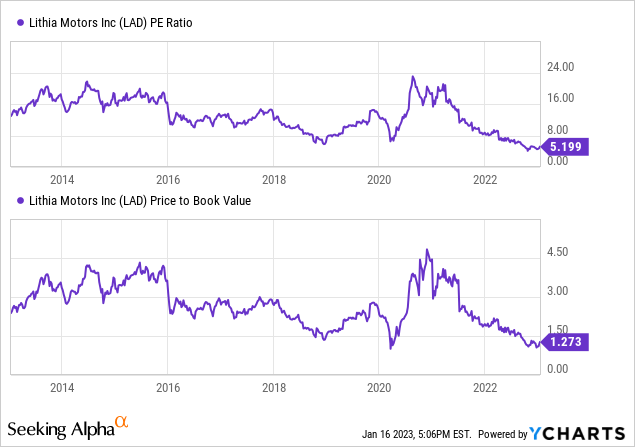
Despite this, the market has never been willing to assign it a premium multiple. Today LAD trades near its lowest valuation by both a price to earnings and price to book of the last decade.
I believe they have a long runway to continue growing and the potential for a narrative transformation that could cause the market to be willing to pay a higher multiple for this business.
However, we need to worry about if LAD may have been over-earning during the pandemic and what an end of supply chain challenges and a tighter financial environment might mean for them.
Continued pathway for deploying capital
LAD has run a variation of the same playbook since it went public in 1996. They buy up franchised auto dealerships, at an attractive multiple and then look to improve the operations. LAD claims to target a 15% return on the price they buy a dealership for. Traditionally LAD has targeted dealers that are underperforming and that LAD has the expertise to improve.
This combination has led to a continually expanding number of dealers and an increasing level of gross profit per dealership.
LAD’s SEC fillings/Author’s work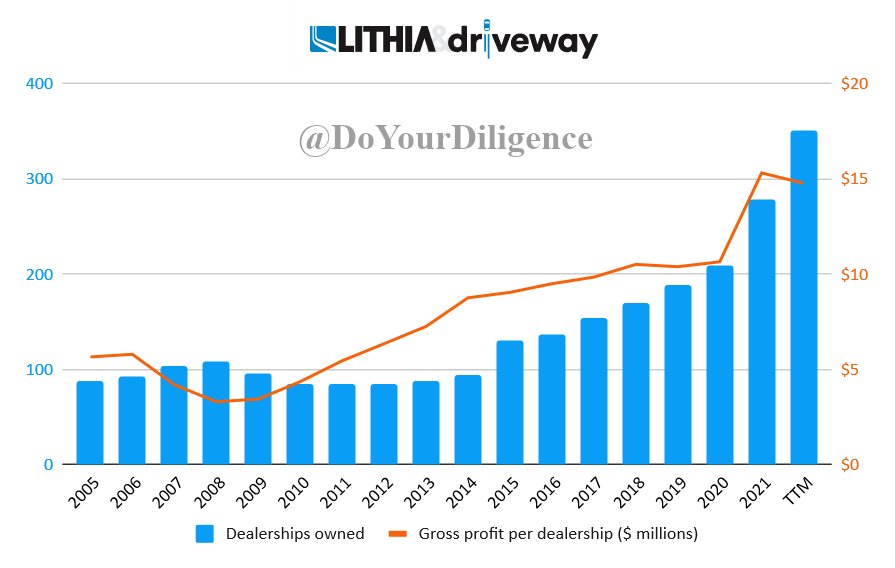
These franchised dealership transactions require approval from the OEMs. LAD has proven to be successful in closing deals where others have not. In addition, this limits the competition that can enter a market since franchise laws protect markets from having additional dealerships opened.
Even after buying up dealerships for the last 25 years, LAD represents less than 2.5% of car sales in the US. The proven track record and remaining market shares lead me to believe they have additional room to roll up dealers.
How Driveway could offer long-term upside.
The idea of delivering cars over the internet is not new. LAD’s CEO had an idea to push toward online sales as early as 2006. However, they began to pursue the idea in more earnest in 2020 when they launched driveway.com. As a competitor to Carvana (CVNA), CarMax (KMX), and others.
Although it is still early days, Driveway offers a fairly unique customer proposition that will be hard for competitors to copy. It is the only major website that allows buying both new and used vehicles in a fully online manner without needing to interact with a local dealer. While other websites such as truecar.com (TRUE) and autonation.com (AN) claim to sell new cars the experience isn’t fully online. These websites allow you to search online and then put you in contact with a local dealership. They are more akin to lead generation for local dealerships. Driveway.com allows you to purchase a car fully online and have the car delivered to either your home address or a nearby dealership. This is a big difference. KMX and CVNA have already proven the popularity of this model for used cars. No one has yet offered these same experiences for new cars. It seems logical that a marketplace containing both used and new cars copying the successful model should thrive.
It will be hard for others to replicate LAD’s approach because state laws limit who can sell new cars to franchised dealers. Since LAD already owns franchised car dealers in many states and for virtually every car brand they can provide ubiquity that competitors cannot. When competing with other legacy dealer networks such as AN, Sonic Automotive (SAH), and Group 1 Automotive (GPI) LAD also has an advantage. Competitors need to update their existing websites to follow the new paradigm. This requires not only a large commitment from the parent company but to get buy-in from all the owned dealerships in their network. Generally, these dealerships operate quasi-independently. Car sales is a heavily incentive-based business. Selling the cars online without the need for salesmen and show floors can be seen as taking commissions away.
It’s too early to tell if this is successful or not. Although I would say the early trends look promising. Per similar web, driveway.com had 1.7M views in the last month. That puts it on the same scale as smaller competitors such as vroom.com, and autonation.com. It’s about a tenth of the size of category leaders like carmax.com and carvana.com. If they are successful in creating a popular website it seems reasonable that they would trade at a higher multiple similar to KMX which has usually traded around a P/E of 15-20. I believe the upside is not being priced in at all by the market currently.
What do normalized earnings look like for Lithia?
LAD has been over-earning due to the effects of COVID. The gross profit per dealership jumped 50% from $10.6M in 2020 to $15.3M in 2021. The question to answer is what LAD’s normalized earnings look like. The biggest reason for the increase in profitability is how profitable selling new cars has been in the past two years.
Company annual reports/Author’s work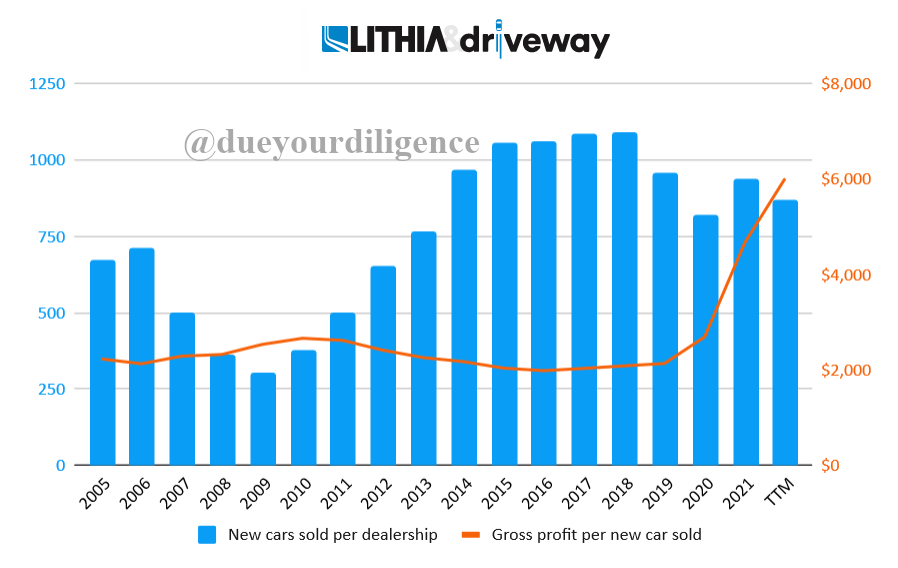
The gross profit per car sold has exploded. During normal times selling new cars has been the worst part of LAD’s business. Gross profit margins are tiny and a disproportionate amount of SG&A must go toward getting customers into the dealership and negotiating with them.
The real money is made on the relationship that is established with those customers. The ability to gather used car trade-ins at a low price, service cars, and sell new customers’ finance/insurance products is where LAD makes its money.
This changed during COVID. Customers were willing to pay well above MSRP for the first time. Attracting and negotiating with customers no longer required as much sales effort. LAD gained a lot of sales leverage.
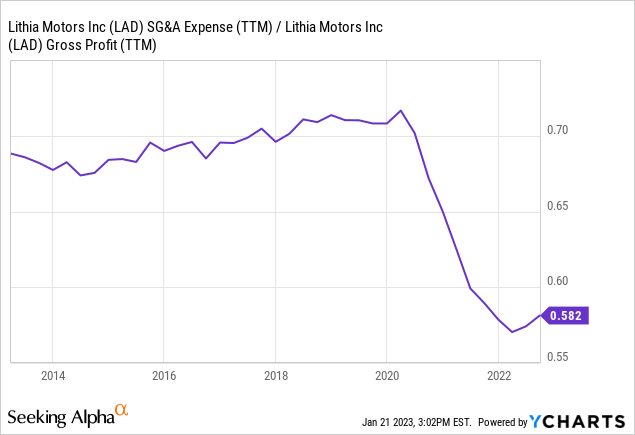
Management has claimed that this relationship between gross profit and SG&A has been structurally improved. They are guiding towards an SGA/GP of 60%. I’m a bit skeptical. Maybe more sales will move online and away from negotiations, but I’ll believe that when I see it. It is possible this sticks around longer at LAD than other dealerships as they have a larger exposure to Japanese OEMs some of whom are still running behind on inventory. My best guess is that SGA/GP normalizes at around 65% even though this would still be a large improvement.
Another key question is how much gross profit is generated per dealership. In 2020 LAD generated $10.6M in gross profit per dealership. On a trailing twelve-month basis they generated $16.8M per dealership. Management has reiterated that they expect to earn more per dealership in the future since they have been moving into buying larger dealerships. Once again I’m skeptical that they are not over earning. My best guess is they will earn about $13M in gross profit per dealership. This would be a large improvement from before 2021 but a step back from 2021 and 2022. Find historical data along with the assumptions I’m making in the table below.
| All in thousands except for units sold | 2018 | 2019 | 2020 | 2021 | TTM | Future (My guess) |
| Used units per dealership | 895 | 907 | 877 | 991 | 990 | 1000 |
| New units per dealership | 1092 | 960 | 819 | 938 | 868 | 1100 |
| F&I gross profit per dealership | $2,691 | $2,759 | $2,774 | $3,782 | $4,088 | $4,000 |
| Maintenance gross profit per dealership | $3,554 | $3,551 | $3,430 | $3,995 | $4,493 | $4,400 |
| Gross profit per used unit | $2.1 | $2.2 | $2.4 | $3.0 | $2.9 | $2.4 |
| Gross profit per new unit | $2.1 | $2.1 | $2.7 | $4.7 | $6.0 | $2.0 |
| Gross profit per dealership | $10,515 | $10,393 | $10,649 | $15,320 | $16,786 | $13,000 |
Using my above assumptions we can project normalized earnings per share.
| Dealerships owned | 311 |
| Gross Profit | $4,043,000 |
| SG&A | $2,627,950 |
| Depreciation & Amortization | $200,000 |
| Operating Income | $1,215,050 |
| Interest expense | $250,000 |
| EBT | $965,050 |
| Income tax | $260,564 |
| Net income | $704,487 |
| Shares outstanding | 27,338 |
| EPS | $25.77 |
(In thousands except for per-share data)
Of course, you may have different assumptions than me about the normalized profitability metrics. The following table shows EPS with profitability assumptions.
| 60% | 65% | 70% | |
| 9,000 | $17.88 | $14.14 | $10.41 |
| 10,000 | $21.20 | $17.05 | $12.90 |
| 11,000 | $24.52 | $19.96 | $15.39 |
| 12,000 | $27.85 | $22.86 | $17.88 |
| 13,000 | $31.17 | $25.77 | $20.37 |
| 14,000 | $34.49 | $28.68 | $22.86 |
| 15,000 | $37.81 | $31.85 | $25.35 |
| 16,000 | $41.13 | $34.49 | $27.85 |
As noted previously I’m expecting about $13M per dealership in gross profit and 65% SGA/GP. Management is guiding for 60% gross profit/SGA and maintaining the current profit per dealership. Management’s guidance would point towards over 40$ a share in earnings.
Short-term headwinds
2023 may end up being a tough year for auto dealerships. Used car prices rapidly decreased in the back half of the year. This is challenging for a dealer like LAD since they are holding a depreciating asset. This can force LAD to sell some of its cars at a loss. We have already begun to see this happen in Q3.
LAD investor relations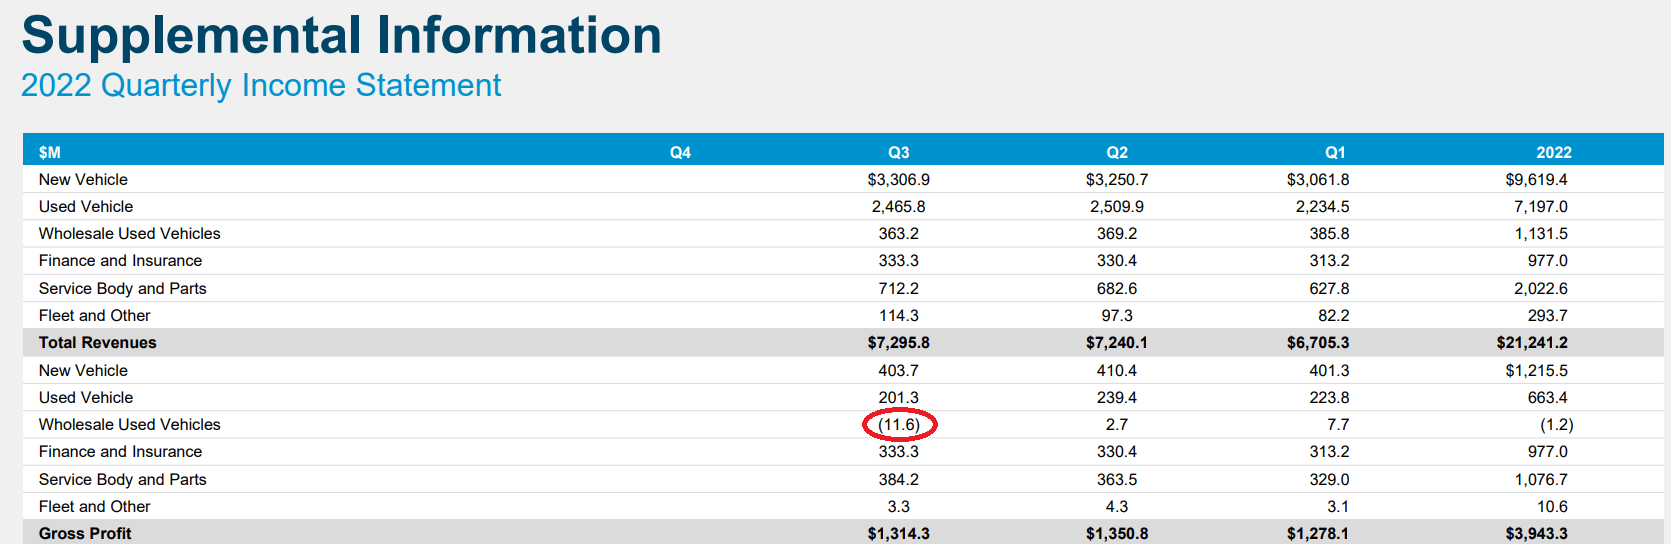
I’d expect 2022 to be the first year since 2008 that LAD loses money on the used cars they sell wholesale. This could continue into 2023.
With supply chains normalized and higher interest rates. It will become harder to maintain the supernatural profits LAD was making on new car sales. There is some expectation that it will be offset by selling more units, but this is far from an assurance if interest rates stay high and new cars don’t become more affordable.
Additionally, if we enter a recession things could get worse. We can take a look back at the GFC to understand how LAD might be affected. The GFC was probably the worst-case scenario for LAD with credit drying up and multiple auto manufacturers almost stopping production due to bankruptcy.
Of LAD’s four income streams all but the maintenance were significantly affected by the GFC. With used car sales being hit first and recovering soonest.
Author’s work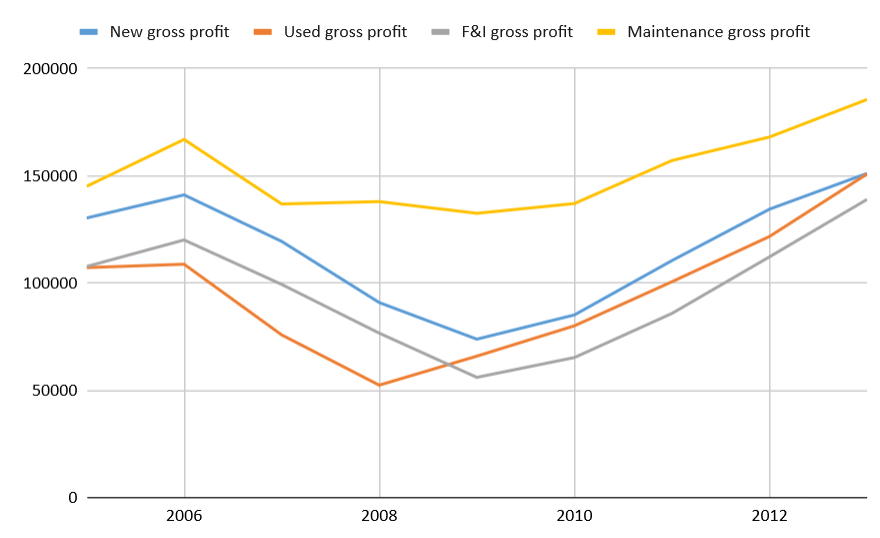
While something like this would be the worst-case scenario. It highlights the economic sensitivity of 3 of LAD’s segments.
Valuation
From 2016 until 2020. LAD was valued at around a P/E of 10. If we take my normalized EPS estimate of 25.77 that would value the business at about $250 per share. This is right about where the stock currently trades. I feel a stock that can consistently earn a 20% return on its equity should trade at a more premium valuation. This doesn’t account for any value for the optionality around the success of driveway.com. On the other hand, if profitability goes back to where it was before the pandemic they’d be earning closer to $15 per share. This would make the stock look overpriced.
If you believe management’s guidance of $55 to $60 per share in earnings by 2025. The current price looks like a steal.
Final thoughts
For now, LAD feels closer to fair value than underpriced to me. While the upside is tantalizing I don’t believe there is enough of a margin of safety. Without more visibility on what normalized earnings look like I don’t feel comfortable underwriting a price of $250 a share now.
Be the first to comment