

A_Carina
In preparing for my annual review of research published over the year and annual portfolio performance, it became clear that it was a very lean year in terms of published research on Seeking Alpha. That said, I feel like I’ve been researching more projects than I have in any year previous. There are several reasons for this, the main being that these ideas started out as good ideas, but could not play out to actionable ideas with any clear or robust edge. This was particularly true for this year, as finding an edge was very difficult, with most of the market in correction mode and many assets highly correlated on the downside. Or, perhaps I took on too many ideas and started new projects before bringing the previous ones to a conclusion – or maybe a combination of both!
This does not necessarily suggest that said ideas are no longer valid, but rather are put on hold for revisiting later when either market conditions change, or after I gain some other new insight that may connect some dots.
One subject I’ve had a mild obsession with is that of market timing, which can broadly be defined as positioning your portfolio to take advantage of market moves just before they happen. This could be simply buying at a market bottom or selling at market top. It could also mean adjusting the portfolio to suit the current (or predicted) market conditions, as certain industries and factors traditionally have done well during market recoveries, while a handful of types do well during recessions.
Market timing is notoriously difficult, and conventional wisdom states that you cannot time the markets. As a general rule of mine, if conventional wisdom says you can’t do something, I make it a point to test it, as chances are it’s an uncrowded trade that may provide some alpha. Plus, it’s in my nature to try something if someone says I can’t ;-).
In this piece, I’d like to highlight some of the work that I’ve done on market timing, even though I don’t yet have these strategies at a point where I would use them in a live portfolio. While these strategies show limited performance, and not enough to be considered robust for me, there are some key and interesting findings that may be used with other concepts.
There are two main strategies I’ve been looking at, both quantitative based. The first relies on fundamental signals, while the other is purely technical and relies only on price action.
Market Timing – Using Fundamental Signals
I started writing about market timing in 2021 with the series “How to Invest in Changing Markets”, where I wrote Part 1 about some common “all weather strategies” to suit all markets, and Part 2 with a potential recession strategy using the yield curve.
The intent was to publish Part 3 of the series; however, I have not published it to date. It was intended to present a dynamic asset rotation model using the high yield curve as a macro indicator. This model was presented by Verdad in their two pieces “Countercyclical Investing” and “The Best Macro Indicator”. The former looks at using both the yield curve and the high yield spread as a two-fold indicator, while the latter uses only the level and direction of the high yield spread to estimate what “quad” we are in of the business cycle:
- Quad 1 – Recovery
- Quad 2 – Growth
- Quad 3 – Overheating
- Quad 4 – Recession
Where the quad is defined as the level of both GDP growth and inflation (a concept popularized by the folks at Hedgeye). As GDP growth and inflation results are only released after the fact (GDP quarterly and CPI monthly), we only know after the fact. The high yield spread, on the other hand, is measured daily and in real time, and is publicly accessible from FRED here.
The table below illustrates the 4 quads, their characteristics, and how the high-yield spread can be used to potentially identify them in real-time.
Verdad.com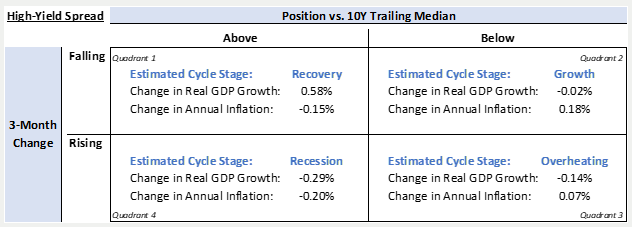
The pictogram below illustrates a typical business cycle and the 4 quads, the high yield spread and some historically outperforming asset classes per quad.
Verdad.com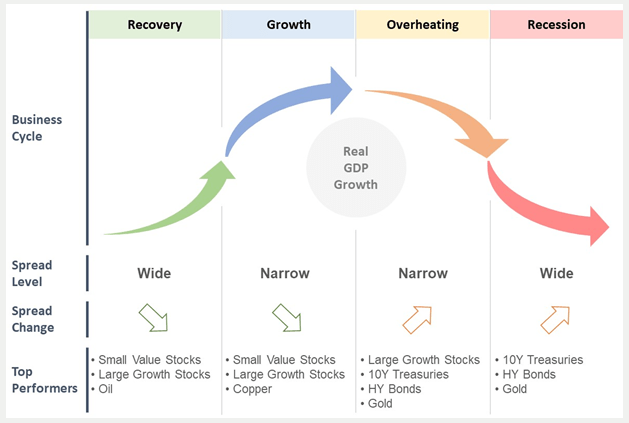
Verdad suggests the following asset split during each quad:
Verdad.com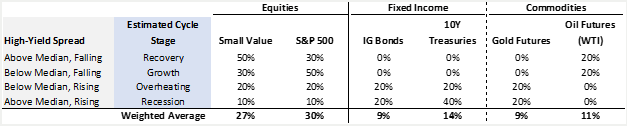
For these asset classes, I used the following ETFs:
I managed to design my own custom series in Portfolio123 that identifies each quad, in real-time, using the level and direction of the high yield spread, where the left y-axis indicates quad #, i.e. 1 = Quad 1 and 4 = Quad 4:
Portfolio123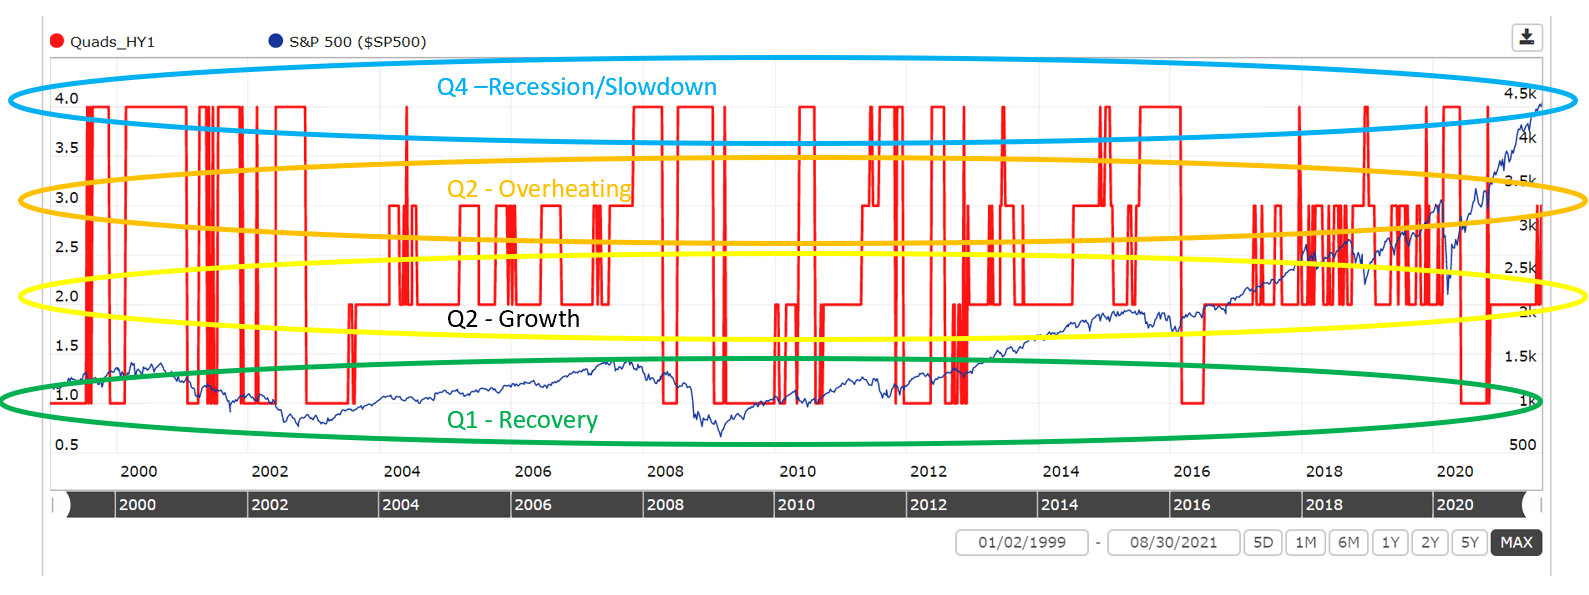
Using the ETFs and weights above, we can then rotate in and out of the groups as the current quad dictates, which results in the following equity curve since 1999:
Portfolio123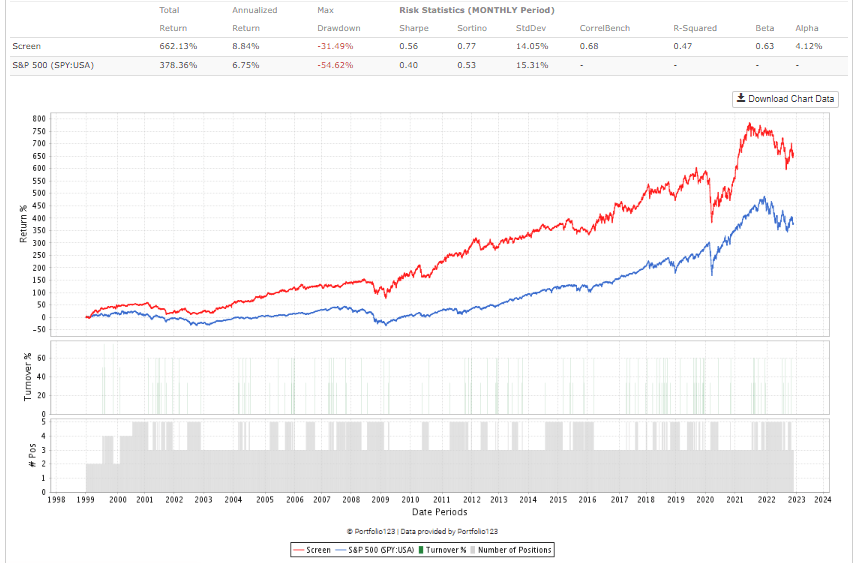
Where the red curve is our timed strategy, and the blue curve is SPY. Over the full period since 1999, the strategy has nearly doubled the SPY in total return, with much less drawdown and higher Sharpe ratio and alpha.
As with all performance of strategies measured over long periods, the actual performance over shorter periods (and arguably more relevant for recent periods) can get lost. To demonstrate, here is the performance of the strategy for the last 10 years:
Portfolio123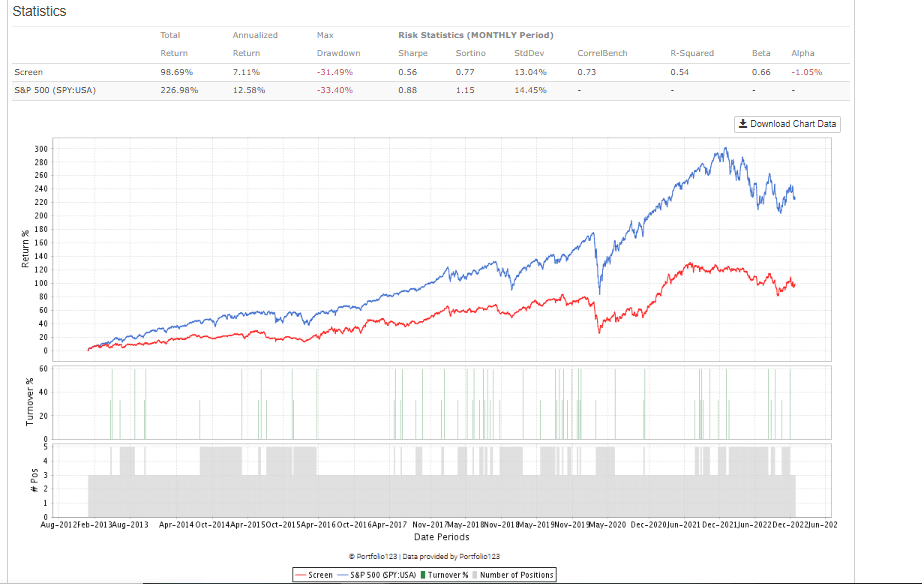
Over this recent period, the strategy has lagged the SPY in terms of return, with little to no advantage in terms of drawdown or volatility (and similar performance over the last 5 years).
It’s no secret that large caps have outperformed the last 10 years, while bonds and treasuries have also had very low returns; however, an extended period of 10-year underperformance is too long for me.
I’ve dabbled with different asset classes, different weights, but still can’t arrive at a robust timing model that beats simply holding the S&P 500.
One observation I’ve made, and perhaps it’s in my interpretation of the high yield spread changes, but the quad plot above is quite “noisy”. Instead of seeing smooth cycles from Q1 thru Q4 and back to Q1, there are many fluctuations, jumping from Q1 to Q4, or bouncing several times between Q2 & Q3. I’ve looked at ways to smooth out this curve, with limited improvements to the overall strategy.
This underperformance of the last 10 years is the reason that I did not initially publish the results of this strategy; however, I believe there are still some interesting nuggets here, and perhaps readers may have suggestions for improvement, or may wish to incorporate some of these ideas into their own strategies.
The high yield market timing model has potential; however, I’ve parked this for now. I may revisit if I gain further insight in the future.
Another market timing technique I discovered this year relies less on fundamental macro factors, but rather purely on technical signals.
Market Timing & Market Breadth
It is very common for investors and investing pundits to gauge the health of market moves based solely on the performance of a major index (usually SPY), or a handful of indices (say including the DJIA, QQQ, etc.).
As an investor or trader, if you’re looking to time the market (in theory), one way is to simply go long when the market is going up, and stay on the sidelines when it’s either going down or even sideways. As the major indices are market cap weighted, it can usually take only a few of the major names to move the entire index, which may not be representative of the market as a whole, and specifically to the types of names that you’re interested in.
This is where “market breadth” can provide a more detailed, or a “broader” picture of the movement of stocks in the market. There are many ways to measure market breadth, but the underlying concept is the count of how many stocks in the market are making moves. For example, if on a given trading day, more than 50% of the stocks in an index (say the Russell 3000) achieved positive returns, then you could say that this market move was of high breadth. If the overall index was still up, but only 25% of the stocks were responsible for the move, then this could be considered a market move of low breadth (for example, focused in one industry or sector).
One trader who I discovered this year through Twitter was Mr. Pradeep Bonde, Twitter handle Stockbee. On his website, he generously provides his “Market Monitor”, which includes many different breadth measurements of the US market the previous day. From what I’ve found, this is quite possibly the most detailed look at breadth publicly and freely available.
It should be noted that Bonde is a swing trader, and typically holds stocks for shorter periods than I do (which is anywhere from 3-12 months).
Stockbee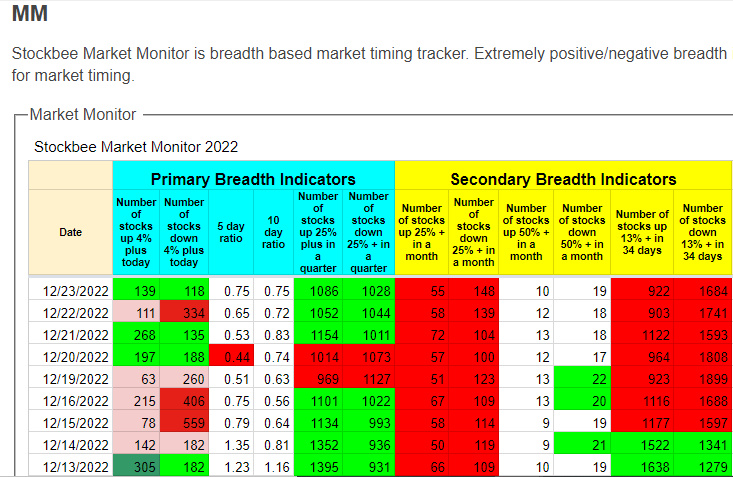
Generally green cells indicate positive breadth, measured over different time frames. Bonde provides a full description of each of these metrics on his website, so I will not elaborate in much detail here.
According to Bonde, a key “bullish” signal is the number of stocks up/down 25% in a quarter, i.e. if the number of stocks up 25% is greater than the number down 25% in a quarter. Some of the other measurements are intended to be taken as absolutes, i.e. if more than 200 stocks up 4% in a day, this can also be interpreted as a bullish sign.
Using Portfolio123, I devised several custom series to simulate these various breadth measurements since 1999, as I was curious if they could be used as a simple signal to go long SPY, and sell (or short) otherwise.
The plot below shows the spready between the number of stocks making 25% in the last quarter, compared to those losing 25% in the same quarter.
Portfolio123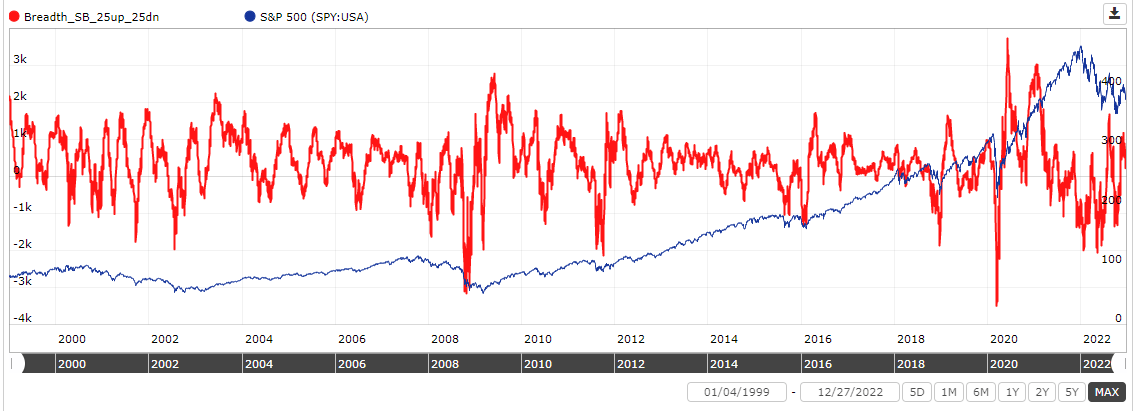
This plot is very cyclical; however, of all the trading days since 1999, just over 70% of these days there were more stocks making 25% in the last quarter compared to those losing 25% in the same quarter. With that, I was curious if this signal could be used to go long SPY:
Portfolio123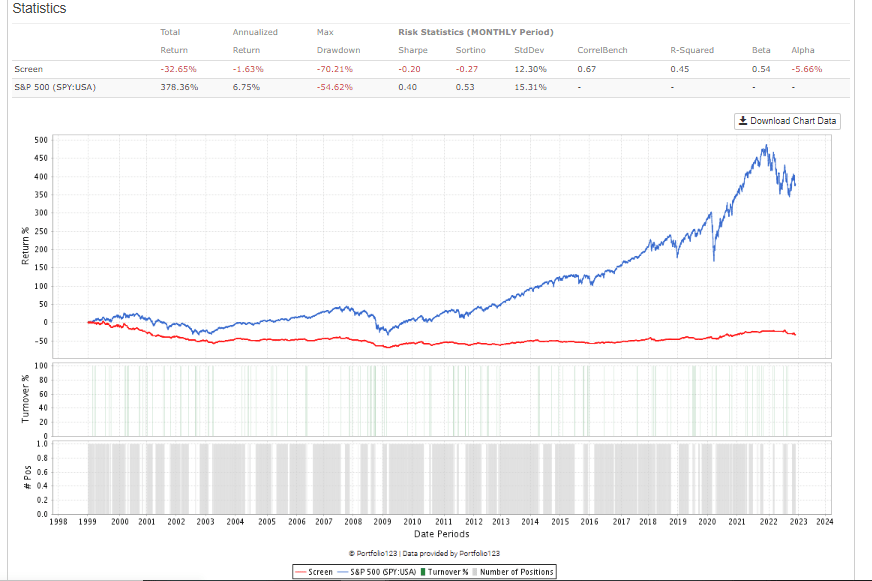
This performance is so poor, that either a) I’m misinterpreting/misusing breadth as it was intended, b) the idea of this breadth as a signal is flat out misguided, c) or is intended for day and swing trading. I can’t really say, but I was disappointed with these results, especially after spending the time to code the various custom series!
I’ve also repeated this exercise with some of the other breadth metrics included in the Market Monitor, but I unfortunately come to a similar result with each.
On 10 and 5 year tests, performance was at least positive, but still trailed simply holding SPY, by a wide margin.
For comparison, if you used a very simple trend following rule, i.e. long SPY when the simple 50 day moving average is greater than the 200 day moving average, you would have beaten SPY marginally, with less drawdown and lower volatility:
Portfolio123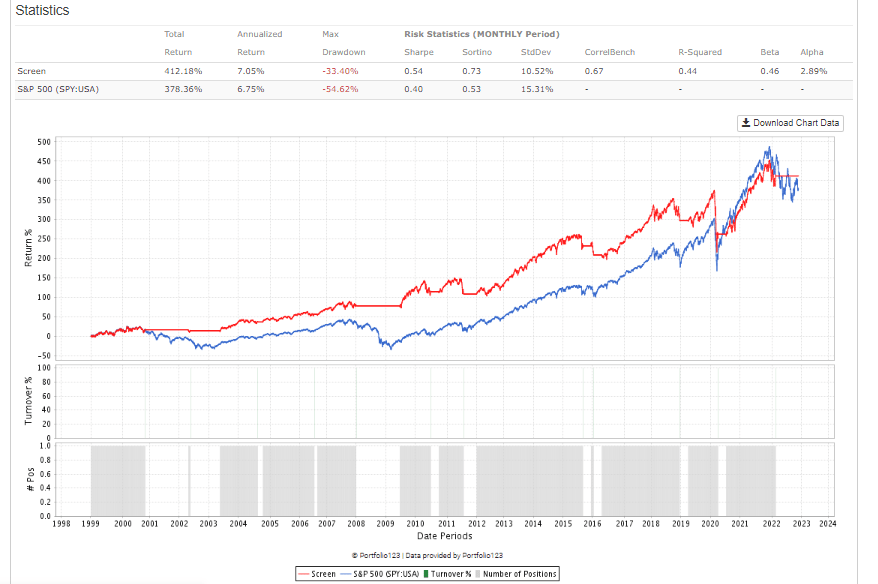
This simple trend following rule was not as effective in the most recent 10 and 5 years, but still beats the 25% breadth rule described above, by a wide margin.
Perhaps there is more nuance to using market breadth, or when combined with other strategies performance may improve. Again, as Bonde is a swing trader, these signals may be more helpful on shorter durations.
A very interesting exercise; however, I’ve put market breadth on the backburner for now.
Why is Market Timing so Elusive?
3 words – Complex Adaptive System. The market is just that; it adapts over time, its participants get smarter, they build better tools and technology constantly improves. What tools and strategies worked in yesteryear may no longer be appropriate for today’s market. Still, I believe there are fundamental factors and drivers in the market that do not change, most importantly the human nature of its participants.
From all of my work on market timing, what I have found is that market timing is most successful at major inflection points, or changes, in the market. For example, the Crisis Investing strategy was very effective during COVID, and at several other junctures since the 1970s. It may be that timing the market is best reserved for those situations.
And of course, we cannot forget the legendary “fat pitches” that many famous investors made, or timed, to earn phenomenal returns. More on this in a future piece.
For now, I’ve decided to park market timing, at least as it is described in this piece. As investing goes, one gains more experience and insight as they go, so if I am lucky enough to learn some new insight that will help me connect the dots with this elusive strategy, I’ll return to it.
To be clear, like Fox Mulder from the 1990s sci-fi series X-Files, “I Want to Believe” in market timing, I just haven’t been convinced yet.
Until then, there are many other research projects on my “drawing board” to get through before I think of new ones!
Happy Investing!
Be the first to comment