

USD/ZAR ANALYSIS
- South African GDP data
- U.S. inflation
- USD/ZAR trading at multi-year lows
RAND FUNDAMENTAL BACKDROP
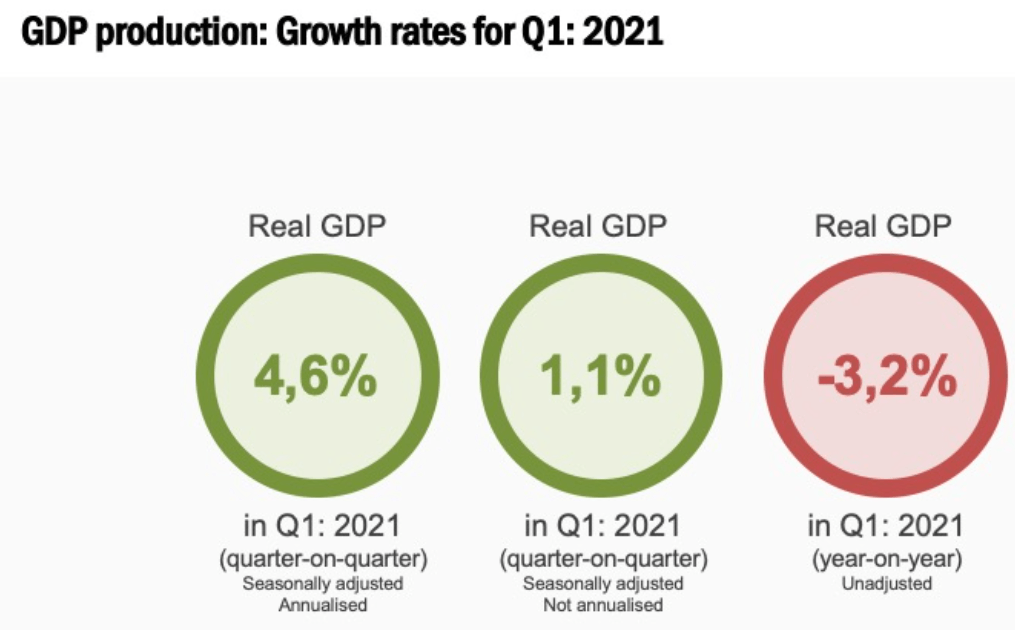
The South African Rand has given back some of its gains against the U.S. dollar ahead of key economic data this week. South African GDP for Q1 2021 was expected to be slightly positive for the Rand after an encouraging commodity environment as well as the gradual increase of global economies. However, Statistics SA revealed growth of 1.1% for Q1 2021 which converts to a figure of 4.6% for annualized growth. The year-on-year figure of -3.2% is on par with expectations which has not surprised markets or the local currency. More influential news may come from other economic announcements later this week (see below).
Source: StatsSA
USD/ZAR ECONOMIC CALENDAR
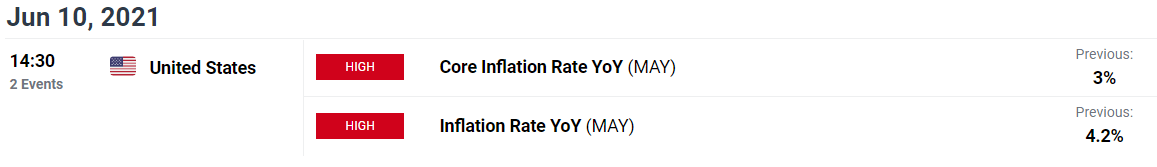
Source: DailyFX economic calendar
WILL ELEVATED INFLATION FIGURES STOKE THE FED?
The greenback is the star of the week with CPI data expected on Thursday with Reuters poll analysts predicting a 3.4% core inflation figure. This strips out more volatile price items such as food and energy. Although inflation may be rising, last weeks jobs data showed a weaker print which defends the supportive policy currently in place.
The labour market needs to exhibit stronger statistics which could then indicate a better economic recovery as opposed to focusing primarily on inflation and a possible ‘overheating’ economy. This is why I believe the Federal Reserve is holding true the transitory stance of current inflation pressures; even if this weeks data comes in unexpectedly high.
The U.S. dollar has increased it’s bearish narrative after the latest COT report was released showing an increase in net short positions. This could lead to an extension of ZAR strength in the short-term. This being said, going into the latter half of 2021 I expect to see a shift from ZAR strength to slight Rand weakness toward the 14.0000 handle.
TECHNICAL ANALYSIS
USD/ZAR DAILY CHART
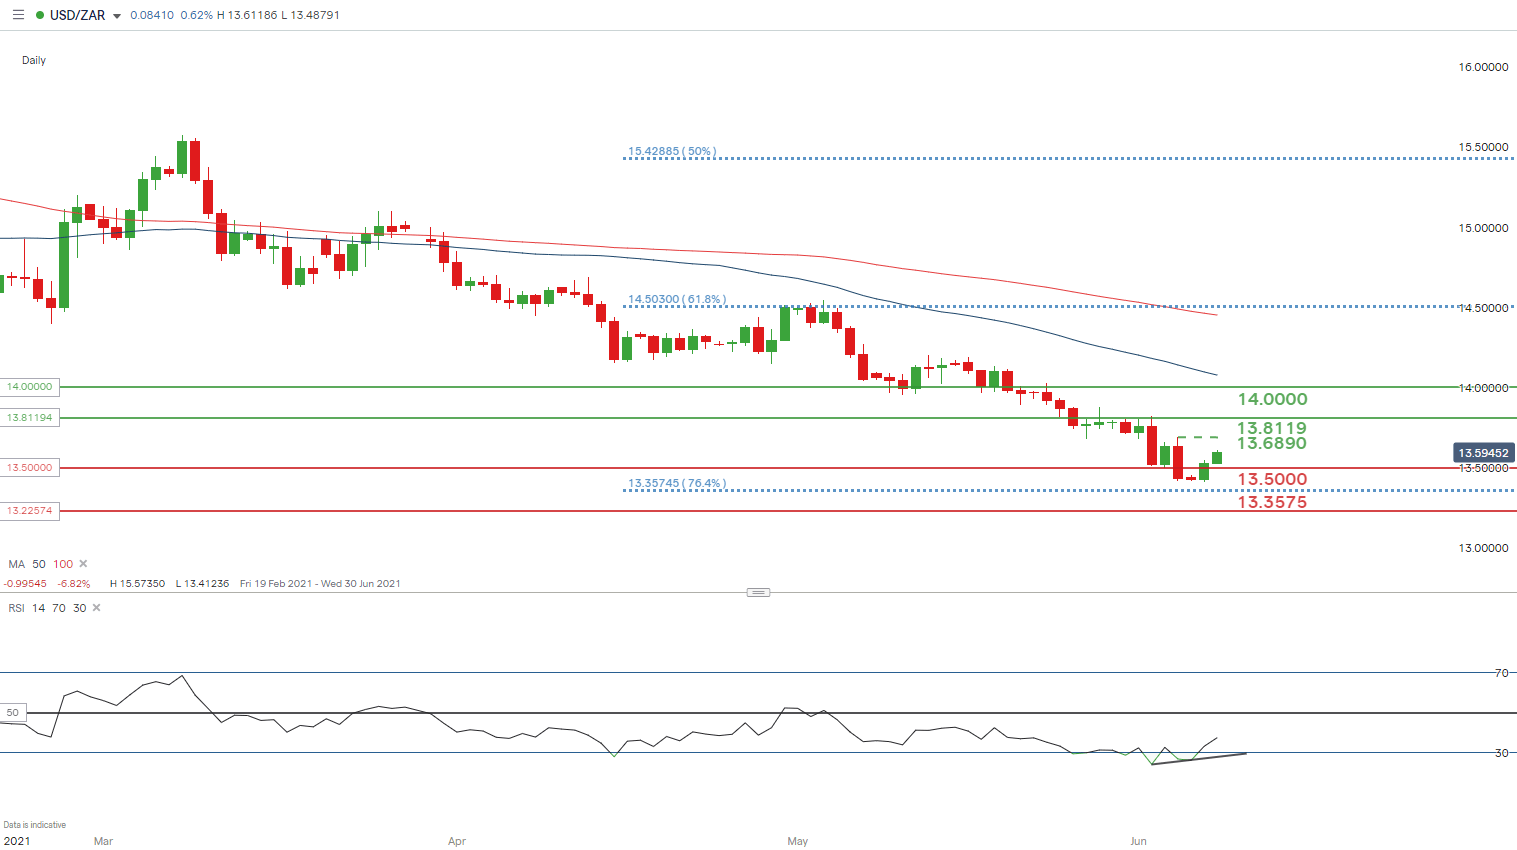
Chart prepared by Warren Venketas, IG
USD/ZAR has risen post announcement of SA GDP data which is predictable as markets halted todays Rand weakness ahead of the data release should any unexpected figures appear. The weeks trend is set to continue with focus on U.S. inflation.
The Moving Average’s (MA) on the chart illustrates the recent divergence between the MA’s and USD/ZAR. Using mean reversion technique it may be prudent to consider upcoming ZAR weakness as a possible directional bias. Mean reversion simply implies that price action reverts to the mean value over time – in this case, upside toward the 50 and 100 MA respectively.
Discover the basic building blocks of Fibonacci and how it can be applied in Financial markets!
The Relative Strength Index (RSI) remains in oversold territory with some bullish divergence (black) showing the difference in direction between the RSI and price action. This is generally suggestive of further upside to come, which falls in line with the aforementioned outlook.
Bulls will be looking toward the recent swing high at 13.6890 with the July 2019 13.8119 support level as subsequent resistance. From the bearish perspective (which has some scope to continue marginally), the 13.5000 psychological level and 13.3575 (76.4% Fibonacci level) support targets will serve as key levels – Fibonacci levels taken from February 2018 low to April 2020 high.
— Written by Warren Venketas for DailyFX.com
Contact and follow Warren on Twitter: @WVenketas
Be the first to comment