

ClarkandCompany/iStock via Getty Images
(This report was first issued to members of Yield Hunting on Aug 11th).
CEFs continue their recovery but have a long way to go. The good thing is that reinvested distributions are buying much higher yields. Given the historically weak start to this year- with multi-year highs occurring on the first business day of 2022- you would think the worst could be behind us. And it is certainly possible.
In fact, distributions have risen faster than they have in the last 9 years primarily due to lower prices. And higher-quality (i.e. funds that have debt instruments that have a higher credit rating) have been hit as hard or harder than lower-quality (“junk”).
This is why we remain steadfast in our thesis of playing ‘defense’ with higher quality funds. This way we are positioned in funds that have been hit hardest (or at least as hard as junkier stuff) but also in assets that are bendable and not breakable in case of a more protracted liquidity event.
CEF Market and Outlook
The average CEF is down -10.3% so far YTD. In terms of the greatest discounts and declines, convertibles (technically a bond category) are down the most in fixed income, with a decline of -19.6% on average. Obviously, areas of equities are down more with EM equity down by -23.6%.
Convertibles track the Nasdaq with a tight correlation and have been clobbered by higher rates. As interest rates rise, these technology firms, which have to borrow a lot of capital to invest in their fast-growing business, get revalued lower. Convertible bonds are primarily issued by technology companies looking to lower their borrowing costs by offering some equity on top.
Alpha Gen Capital
We see only a few sectors that are currently offering long-term value. I.e. they are trading at a discount to their long-term historical averages. Those include Investment Grade, Multisector, Mortgage, and Preferreds.
The common denominator on most of those sectors is something called, duration. That is just a fancy name for interest rate sensitivity. A good rule of thumb is that if duration is 5, then a 1% increase/decrease will likely result in a 5% increase/decrease in the value.
How the second half will play out is the most nebulous we have seen in quite some time. There is basically two scenario camps: hard landing or soft landing.
A hard landing means we are in a recession- more so than the technical we experienced in the first half of 2022. It would also mean spreads will widen to at least 6.0%, which would also mean most taxable CEF NAVs will be falling.
The chart below shows three high yield CEF NAVs (ISD, EAD, and HYT) overlaid with the BofA High Yield Master Spread (this is the additional yield the market is requiring above the US treasury rate at a similar maturity. I.e. a 5-year high yield bond vs a 5-year US treasury note).
You can see as the green line (spreads) rise as investors sold off high yield bonds, the NAVs of the three funds fell (with a VERY tight correlation).
ycharts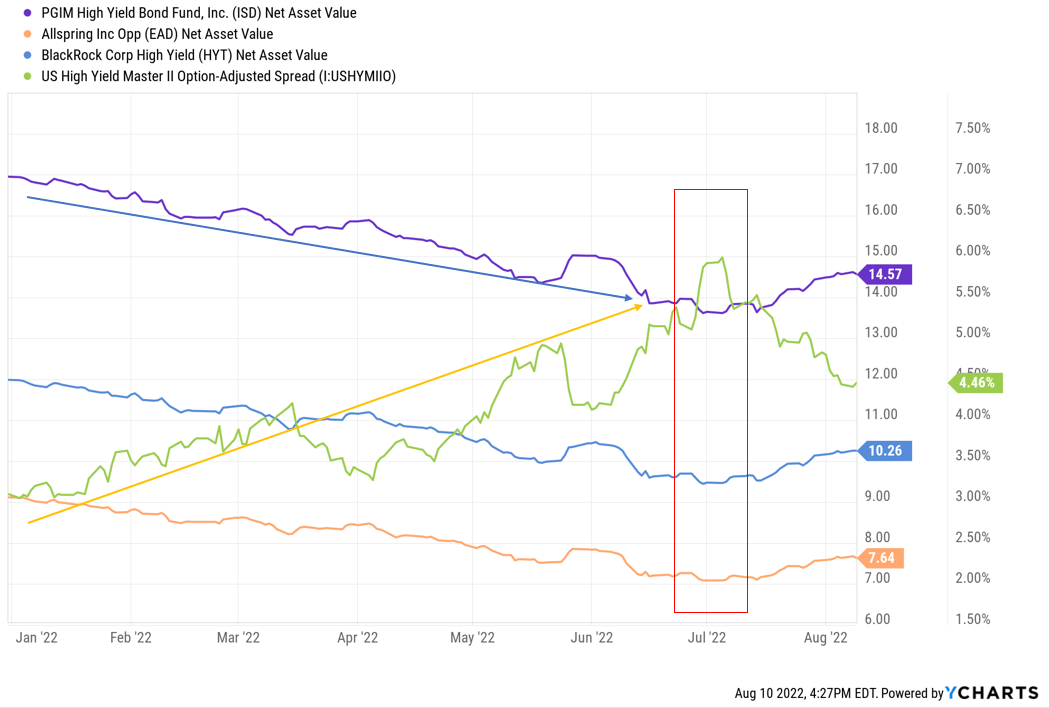
In fact, all three NAVs fell together and have since recovered together. So, while investors like to think that the portfolio manager making decisions to buy X and sell Y, are the largest drivers of their performance, that is not true. The largest driver is capital flows into and out of the sector (fund flows) and then spreads. As spreads compress, NAVs rise, and as spreads widen out, they fall.
ycharts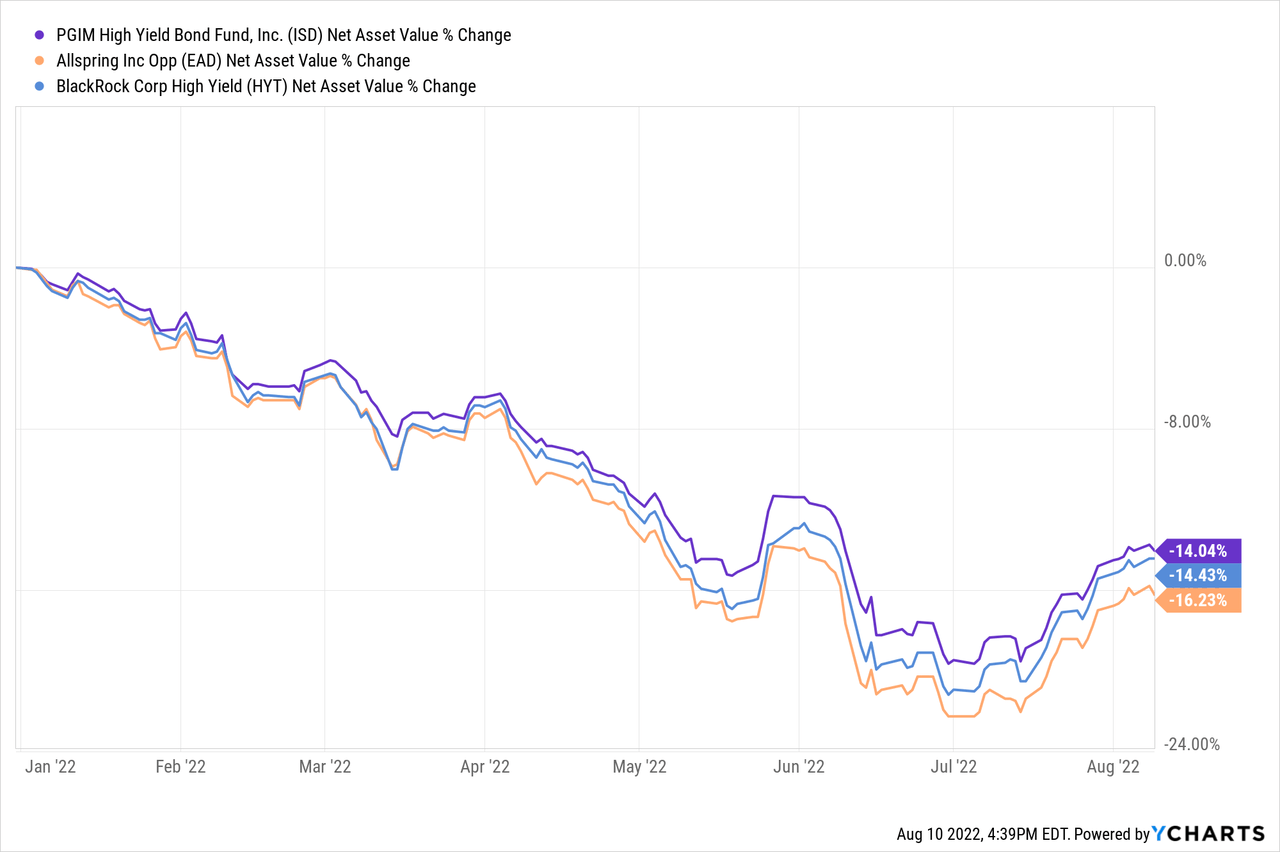
Right now, spreads have come way in because the market is now banking on a Fed pivot in the next 6-9 months because inflation is coming down. The latest CPI report for July showed some moderation in that number but it is only one report. If inflation fails to continue to fall, that pivot will not materialize and spreads are likely to widen further.
There are a few benefits of wider spreads. For one, you are buying in at higher yields. Any maturing bonds in the CEF’s portfolio get to be reinvested at higher yields bolstering the distribution stability of the fund. Since April, distribution yields are up 0.8% while funding costs are up approximately 0.5%, depending on the funding source.
Another key is a higher margin of safety. If spreads widen back out, discounts are likely to increase, on average, as well. That means you are buying at better entry points than today.
Lastly, as the Fed approaches the terminal rate, the distribution cuts from higher borrowing costs to provide the leverage are likely to have flowed through most funds by then.
We continue to be defensive in our approach but also still invested. We think the second half could have substantial volatility, especially as we get into later September and October and approach the midterm elections. Liquidity is something to watch closely as we get to the fourth quarter.
Tax-Free Munis Have Rallied Hard
About two-plus months ago, we started getting excited about munis preferring to rotate from mutual funds and other OEFs (open-end funds) to closed-end funds. The thesis rested on the fact that the narrative had changed and we went from an inflationary boom paradigm to a stagflationary and even recessionary regime.
That means investors were positioning for higher rates and continued growth but by March, had shifted to expecting a recession. That positioning shifted money out of commodities and other rate-rising hedge sectors to recessionary/defensive areas (like munis).
At the time, muni discounts were averaging about -7% and in the 80-85th- percentile. That means that 80% of the time, muni discounts were tighter than they were then.
In hindsight, we were only partially correct. While it was a good time to get into munis, we didn’t get into them wholesale, meaning with new capital. Instead, we made an internal asset sector switch. While that turned out well, we should have backed up the truck.
In the months since the average discount has closed to just -3.4% and is essentially at fair value. NAVs at the same time, have rallied by about 4% giving investors a 7%+ total return that is mostly tax-free.
ycharts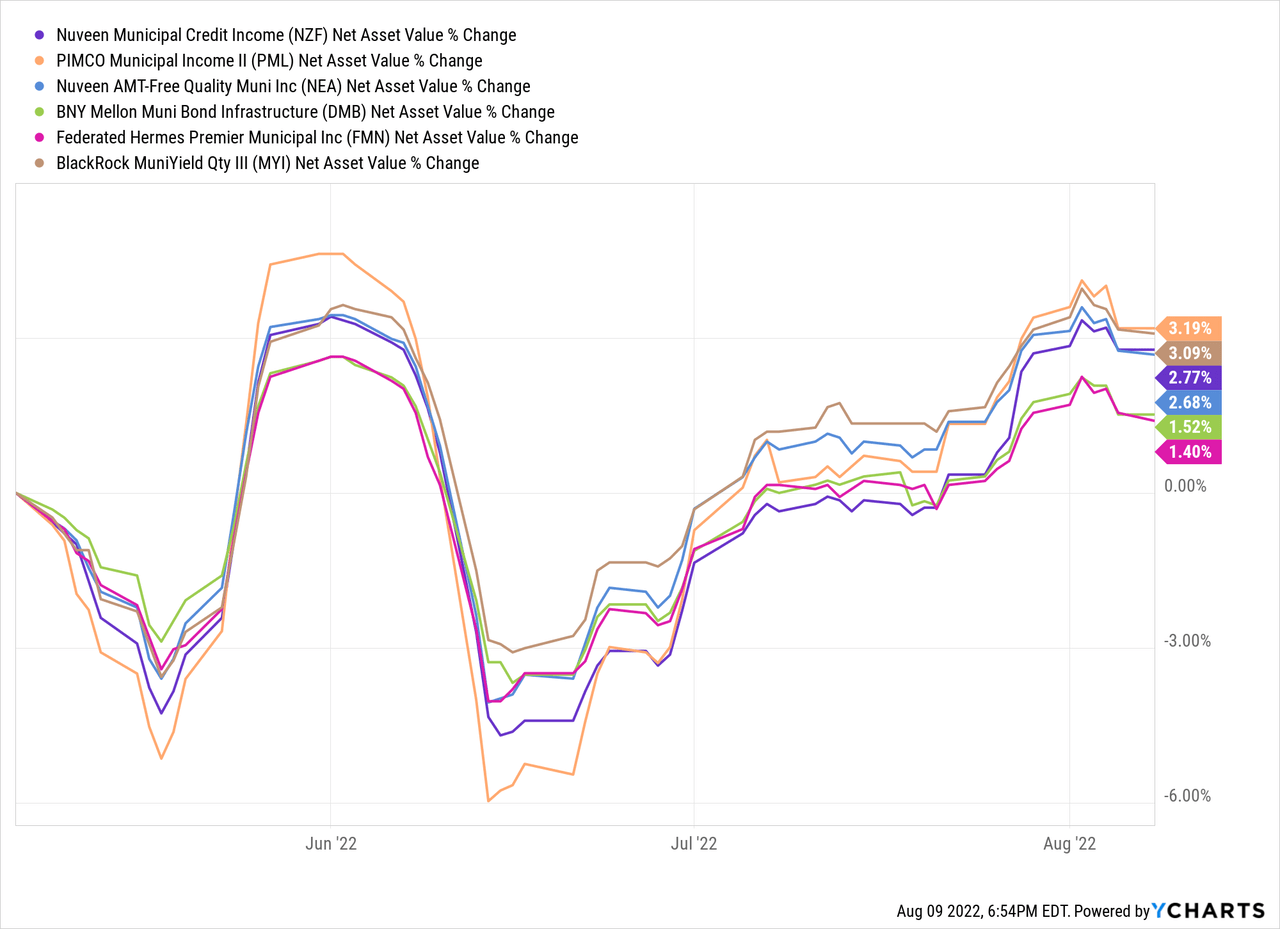
We still like munis here as one of the sectors that will fulfill our narrative of focusing on high-quality and beaten down duration. This will be centered on municipal bonds and investment grade corporate debt.
In munis, a few funds we like here are:
- BlackRock MuniVest (MVF), yield 5.17%, discount -7.1%
- Federated Premier Municipal Income (FMN), yield 4.22%, discount -10.7%
- Invesco Municipal Income Opportunities (OIA), yield 5.11%, discount -1.2%
Some clear sells here would be:
- BNY Mellon Muni Bond Infra (DMB), yield 4.51%, premium 10.9%
- BlackRock Long-term Muni Adv (BTA), yield 5.43%, premium 7.8%
- PIMCO Municipal Income (PMF), yield 5.29%, premium 13%
- PIMCO Municipal Income (PMX), yield 5.4%, premium 10.3%
Two other options that are a bit more work because of their special situation aspects are Nuveen Interm Duration Muni Term 2023 (NID) and Nuveen Interm Quality Duration Muni Term (NIQ). Both of these funds are term funds meaning that they liquidate at a specific date in the future but not at a specific price.
Best Opportunities In Taxables We See Today
Right now, the taxable space as a whole is not cheap. There are a few pockets of opportunity for those willing to keep or add their CEF allocations. The loan space looks fairly compelling again even if prices are off their lows. The sector is trading around the 45% percentile (been cheaper just 45% of the time over the last 6 years). There are only a few sectors that are currently that cheap.
The average loan CEF trades at a -7.2% discount, which sounds wide (at least compared to the taxable space) but is a bit within their average range. If we adjust for current yields vs. long-term average yields, the loan space looks even more compelling. Yields are now over 8%, which is higher relative to most other sectors.
Elsewhere, we like the investment grade and preferreds sectors. For one, they are relatively cheap. Two, they fit into our narrative shift of moving into a deflationary bust environment, i.e. falling inflation and slowing growth. Lastly, they fit into our requirement for higher quality.
Relatively speaking, loans have a yield around 8% but that sector doesn’t fit our requirement of high quality is that the vast majority are non-investment grade. Instead, investment grade and preferreds offer up yields of 6.9% and 7.3%, respectively. While those are clearly lower than the loan space, they also offer up a degree of safety against the deflationary bust economic regime we expect.
Conversely, if we see stickier, more entrenched inflation, the terminal rate will be higher than the market currently forecasts. That would mean a more hawkish Fed and higher short-term rates. Loan distributions (yields) would benefit from that outcome.
We never want to make a binary bet – i.e. all to cash or all in the most riskiest assets. In this case, it means not putting all of our chips on duration and high-quality but keeping a small amount of exposure to junkier credits.
The loan space gives us that exposure with a thesis of why we own it.
In the loan space, we currently like:
- Western Asset Diversified Income (WDI), yield 9.79%, discount -8.6%.
- Ares Dynamic Credit Allocation (ARDC), yield 8.89%, discount -9.12%
- XAI Octagon Fr & Alt Income (XFLT), yield 12.43%, premium 1.4%
Preferreds:
- Cohen & Steers Tax-Adv Pref & Inc (PTA), yield 7.65% (tax qualified), discount -8.12%.
Investment Grade:
- Western Asset Premier Bond (WEA), yield 7.0%, discount -6.1%
- Angel Oak Financial Strat Inc (FINS), yield 8.92%, discount -9.8%
Concluding Thoughts
Investors today face a conundrum that they likely haven’t faced in quite some time- likely since the Financial Crisis. But we continue to believe that being diversified and tactical about where you place your chips by focusing on the macro picture and likely economic regimes can give you a distinct advantage.
Lastly, tax loss harvesting should be done now, before everyone does it in October, November, and early December. Now is a great time to take the losses and rotate into better-positioned funds like those we’ve listed in the report.
Be the first to comment