

Justin Sullivan/Getty Images News
Ford Motor (NYSE:F) reported on April 4, 2022 that U.S. sales declined 25.6% YoY to 159,328 vehicles in March 2022. Sales were dismal across the board.
- Truck sales fell 34.4% Y/Y to 74,420 units
- Cars sales down 67% Y/Y to 3,628 units
- SUVs -9.4% Y/Y to 81,280 units
- To make matters worse, Ford said it will recall 737,000 vehicles, including versions of the Ford Escape SUV and Bronco Sports SUV, to fix oil leaks.
- On the positive side, electrified vehicles sales +16.9% Y/Y to 13,772 units.
Barclays lowered its price target on Ford to $17 from $23. Since reaching a 52-week high stock price of $25.87 on January 14, 2022, Ford’s share price had dropped to close at $15.05 on April 8., as shown in Chart 1. So to reach $30, the title of this article, the stock would need to double, and this following a recent downgrade from Barclays.
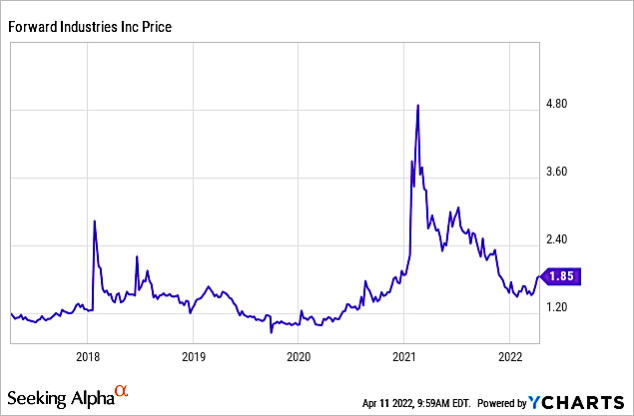
Chart 1 (YCharts)
Ford’s 2022 is turning out to be worse than 2021
Through March 2022, Ford’s unit sales decreased 17.1%, which is in addition to a decrease of 7% for all of 2021 compared to 2020.
Ford shipped 1,891,753 vehicles in the U.S. in 2021, down from 2,034,708 in 2020, as shown in Table 1. The company’s shipment performance was among the worst of the manufacturers.
In 2021, total U.S. shipments increased just 3.4% YoY to 15.1 million units from 14.6 million in 2020. Sales in 2020 were also lower than 2019 as YoY shipments dropped 14.4% from 17.0 million in 2019.
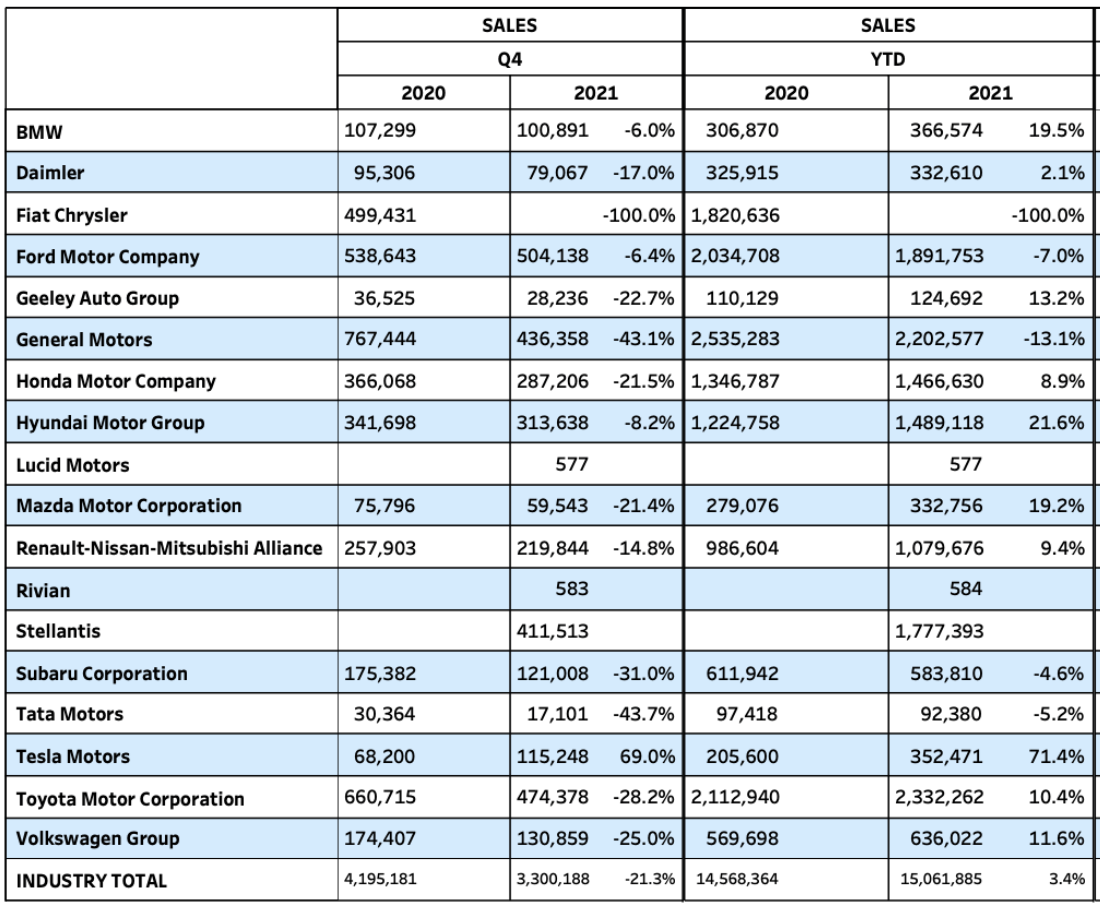
Table 1 – (Cox Automotive)
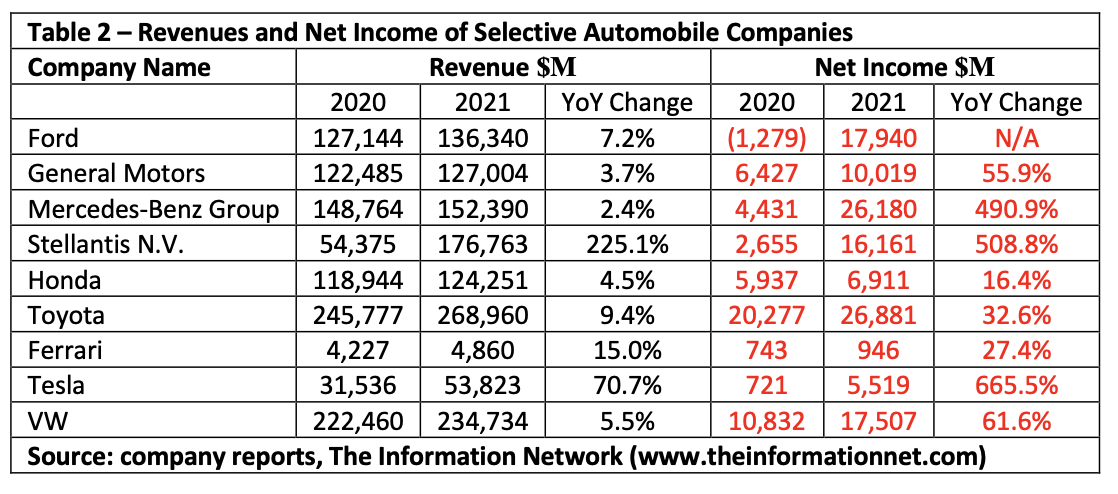
While shipments dropped 7% YoY for Ford, revenue increased 7%. Table 2 lists Revenues and Net Income for select automobile manufacturers for 2020 and 2021. Ford’s revenues increased 7.2% YoY, which is higher than most competitors, except for Tesla (TSLA) increasing revenues by 70.7%. Stellantis N.V. (STLA) is a multinational automotive manufacturing corporation formed in 2021 on the basis of a 50-50 cross-border merger between the Italian-American conglomerate Fiat Chrysler Automobiles and the French PSA Group. Financial data for the company for 2020 and 2021 were compiled by the company using accounting adjustments.
The Information Network
The second half of Table 2 in red is the critical issue, showing that Net Income skyrocketed in 2021 as car companies generated income by eliminating incentives, selling cars above MSRP, shuttering production of ICE vehicles, and reducing dealerships (9,955 in 2021 compared to 10,717 in 2020 at Ford). Ford’s net income increased from -$1,279 million in 2020 to +17,940 million in 2021.
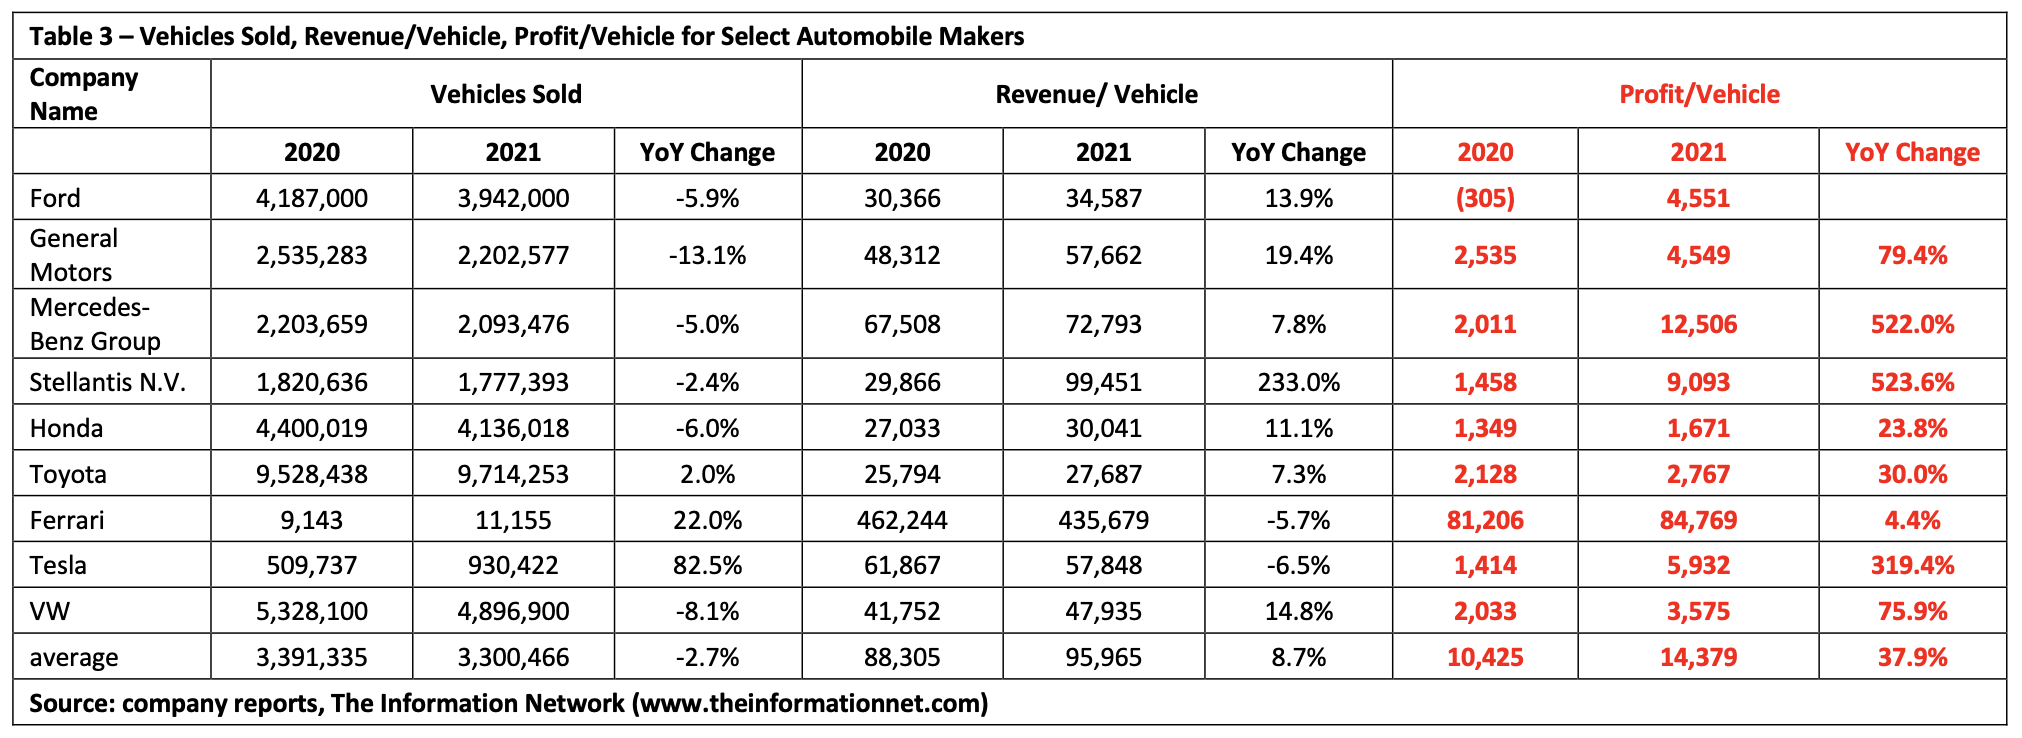
Table 3 shows Vehicles Sold, Revenue/Vehicle, and Profit/Vehicle for the automobile manufacturers. As the bottom row of the curve shows, the average growth of vehicles sold for these manufacturers was -2.7% YoY, and revenue/vehicle increased 8.7%. Most important, during the recovery of the Covid pandemic, when automakers were closing plants and complaining of “semiconductor shortages,” profit per vehicle increased an average of 37.9% YoY.
Ford made a profit of $4,551 per vehicle in 2021 versus a loss of $305 in 2020, as its revenues per vehicle rose 13.9%. Profit per vehicle for Mercedes Benz Group (OTCPK:DDAIF) and Tesla increased triple digits YoY.
The Information Network
Investor Takeaway
Ford’s shipments decreased in YoY in 2021 as revenues increased 7.2%. Revenue per vehicle for Ford increased 13.9% YoY in 2021 as net income grew from -$1,279 million in 2020 to +17,940 million in 2021.
Ford’s recovery in vehicle revenues has been a positive for the company. Net income and revenues are increasing, and Seeking Alpha’s Factor Grades illustrate this financial improvement, as shown in Chart 2.

Chart 2 (Seeking Alpha)
Chart 3 also shows Ford as a strong buy, ahead of General Motors (GM), Toyota (TM), and Honda (HMC).
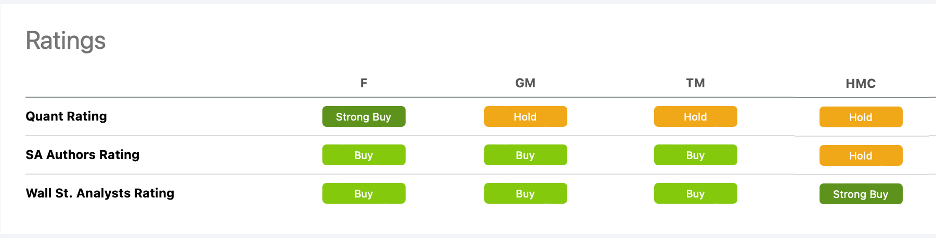
Chart 3 (Seeking Alpha)
Chart 4 shows that Ford also has higher Seeking Alpha Quant Factor Grades than General Motors, Toyota, and Honda.
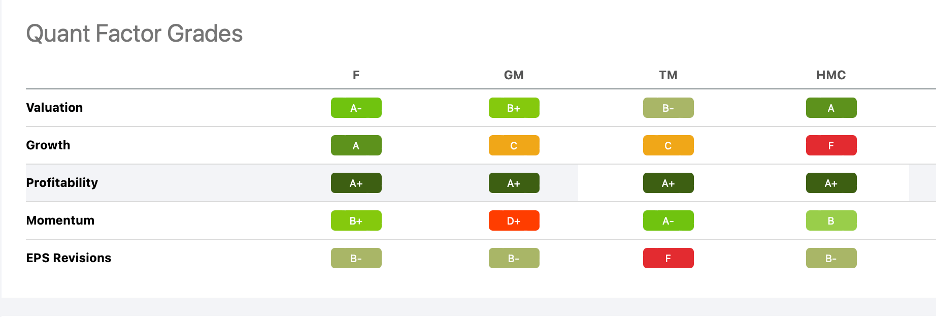
Chart 4 (Seeking Alpha)
Chart 5 is another example of the growth since the pandemic. Ford moved above competitors (orange line) in Profit Margin in 2021 as a result.

Chart 5 (YCharts)
But can Ford’s stock increase to $30?
A headwind for Ford is that the stock price has dropped as the 10-year Treasury has risen, tied intimately to inflation, as shown in Chart 6. The concern is that inflation will erode a prospective car buyer’s discretionary funding and either not purchase a vehicle or purchase one of a lower price, thereby reducing car company revenues.
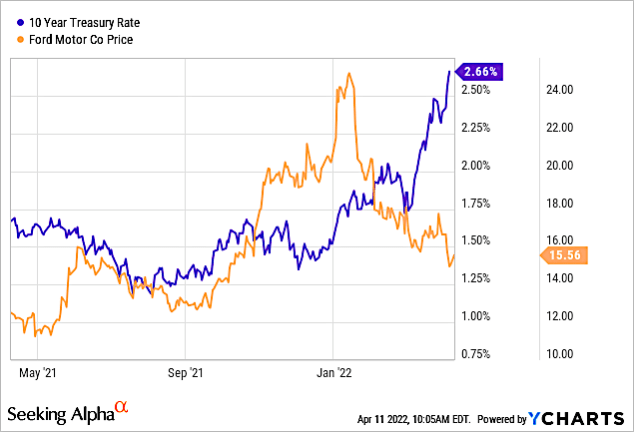
Chart 6 (YCharts)
Indeed, Chart 7 shows the direct correlation between Consumer Sentiment, which dropped to 59.4 in March 2022, the lowest reading since August of 2011, and U.S. auto sales. In other words, when people feel poor, they stop buying.
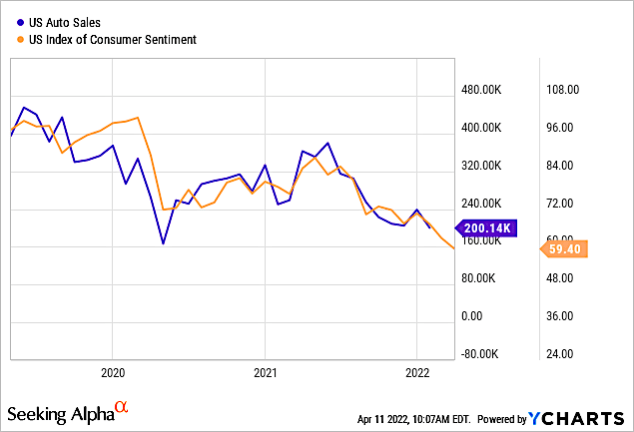
Chart 7 (YCharts)
In 2021, global EV sales increased 108% YoY while the total automobile (EV and ICE) increased just 4.6%. In North America., less than 10% of vehicles are EVs, and the 3.8% growth for the total market would be about 3.4% for ICE and 96% for EVs, according to The Information Network’s report entitled “Global and China EV Batteries and Materials: Technology, Trends and Market Forecasts.”
Ford announced that it was splitting into “two distinct, but strategically interdependent, auto businesses” called Ford Blue and Ford Model E. While Ford Blue will manage all of the legacy internal combustion engine vehicles, Ford Model E represents its push into electric vehicles, with products like the Mustang Mach-E and Ford F-150 Lightning.
The move is a harbinger of the transition away from ICE for the company as it transitions to producing two million electric vehicles in 2026, up from 600,000 EVs planned for 2023.
For Ford’s share price to reach $30, it will need to achieve its lofty plans of producing two million EVs in 2026. And these EVs need to be competitive against Tesla, the EV market leader, and the plethora of other auto companies increasing their EV product line. Ford sold 159,328 vehicles in March 2022 in the U.S., of which just 13,772 EVs were sold. That is less than 9% in the U.S.
Be the first to comment