

dszc/iStock via Getty Images
Thesis: Peak Rent Growth Has Likely Been Reached
Sunbelt-focused multifamily real estate investment trust, Camden Property Trust (NYSE:CPT), is enjoying some well-deserved time in the sun. The stock price is up some 40% from its pre-pandemic level of February 2020 and nearly 60% from the beginning of 2020.
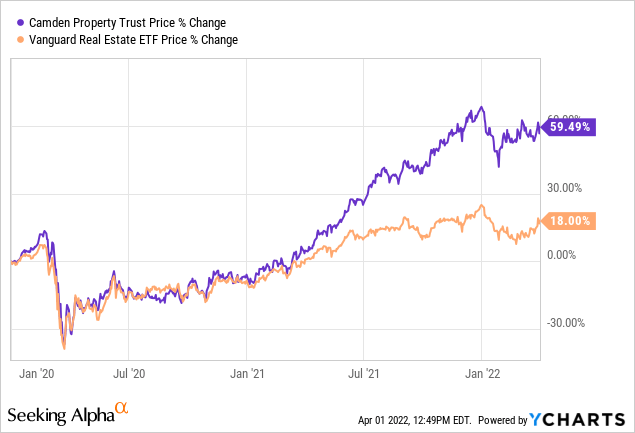
The REIT’s heavy concentration in Sunbelt states has played the primary role in its outperformance over the broader REIT index (VNQ) since the beginning of 2020, with its divergence beginning around the same time as the surge in inflation broadly and rent rates specifically.
This year should be very strong for CPT. For one thing, I’m glad to see its portfolio share of the hot Sunbelt markets of Austin, Houston, and Tampa about to increase when the company acquires full ownership of a joint venture in Q2 in a $1.1 billion deal. And the REIT could also soon get a small boost from inclusion into the S&P 500.
After 13.3% FFO per share growth in 2021, management expects another 15.8% growth (midpoint of guidance) in 2022. Though with the purchase of CPT’s JV interest, growth should actually exceed 17% this year.
Even so, I believe too much optimism for future years is priced into CPT’s stock. The price-to-FFO is 27x based on the midpoint of 2022 guidance and 26.6x based on the highest end of guidance.
For this valuation, I believe the market is assuming faster rent growth than what will actually manifest. As such, despite being a blue-chip multifamily REIT of which I’d like to own more, CPT is a hold at today’s price.
Let me explain why I think rent growth has likely peaked and should moderate this year.
Excessive Optimism In Residential REITs
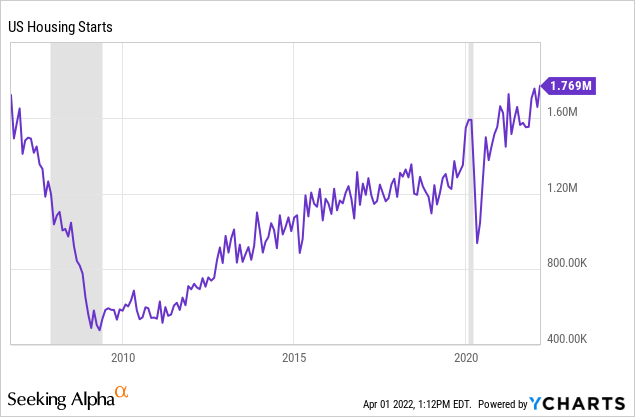
Before the pandemic, the U.S. already had a shortage of housing, as the country underbuilt homes during the 2010s after the painful consequences of overbuilding during the 2000s.
But today, the scars of the housing bubble seem to have healed, and the market is instead licking its wounds from the consequences of underbuilding during the 2010s. If the market overreacted in the 2010s to painful lessons learned late in the 2000s, the pendulum now seems to be swinging the other way. Housing starts have reached their highest level since September 2006:
The labor shortage in the construction sector, while still there, is easing as the total number of construction workers has now surpassed the level of February 2020 as of March 2022.

Federal Reserve
Shortages and delayed deliveries of materials is still a major issue for homebuilders, as the vast majority of builders have recently reported delays and material price increases averaging 25%. However, these issues are also expected to slowly abate over time as materials production ramps up and supply chains strengthen.
What does this have to do with rent growth? Well, as with any other price, rent is set by the interplay of supply and demand. As greater supply of housing hits the market, it should begin to satisfy demand and thereby tamp down on rent growth.
As you can see in the chart below from Apartment List‘s National Rent Report, nationwide rent rates have continued to go up this year.
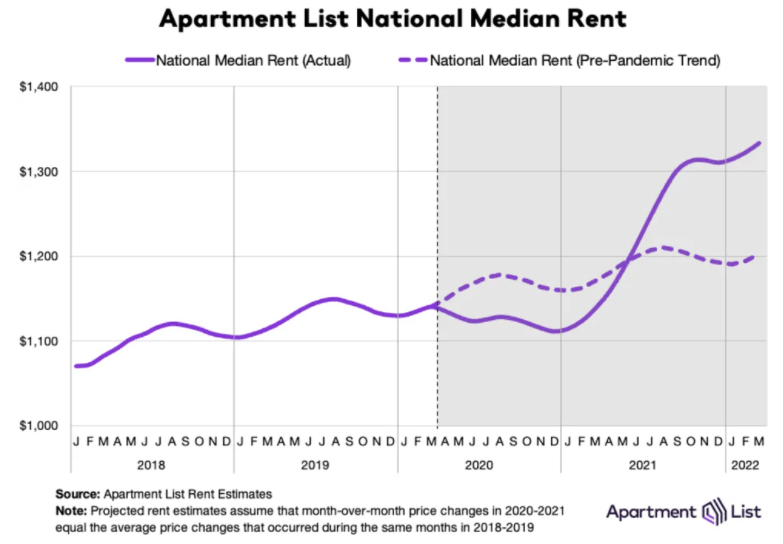
Apartment List
But rent growth is a rate of change measurement.
It is the percentage change from the same month a year ago. For the latter nine months of 2021, it was easy for rent growth to reach into the double digits, since rent rates were not only going up rapidly but were also being compared to sagging rent rates during the comparable months of 2020.
This year will not be like last year. We likely will continue to see rent rates rise, but year-over-year growth rates will face the headwind of higher and higher rents from the comparable months last year.
The broader inflation indexes face the same headwinds (although they have plenty of tailwinds as well) from base effects. A stable YoY growth rate in the CPI requires exponential growth in prices. Linear growth in prices would produce lower and lower YoY CPI growth rates over time.
(Sidebar: If the price of an item rises from $1 to $2 the following year, the price growth is 100%. But if it goes from $2 to $3 the next year, the price growth is only 50%. Then, from $3 to $4, the price growth is only 33%, and so on. In order to maintain a 100% growth rate, the price would have to go from $1 to $2, then $2 to $4, then $4 to $8.)
The same holds true for rent growth. Exponential growth for any item’s price is usually unsustainable. That is the case for rents here.
Going from $1,100 to $1,300 in median rent is an 18% growth rate. But going from $1,300 to $1,500 in median rent is only a 15% growth rate.
Even so, it is unlikely that we’ll see even 15% growth in rents this year. Most experts and industry practitioners instead assume 7-9% rent growth on top of 2021’s level, with most of the rise coming in the first quarter (the easiest YoY comps). CPT, for example, expects revenue growth of 7.75% to 9.75% in 2022.
Another sign that rent growth has probably peaked: rising vacancy rates. Across the nation, vacancy has rebounded off its COVID-era low of 3.8% in August 2021 and crept back up to 4.6% as of March 2022.
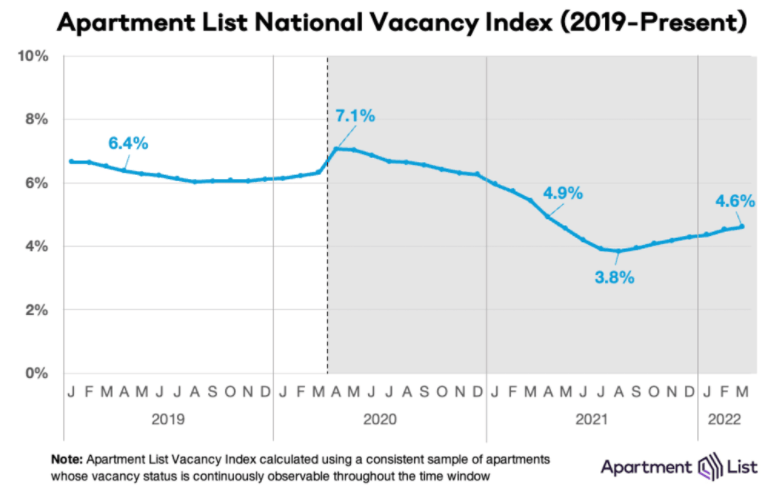
Apartment List
This is still well below the average nationwide vacancy rate of 6%, but the direction of the trend is quite clear at this point: up.
Fortunately, CPT’s same-property vacancy has held steady in recent months, staying flat from Q4 2021’s 2.9% (97.1% occupancy) to January 2022’s 2.9%, then ticking up slightly to a 3.0% vacancy rate (97.0% occupancy) in February 2022.
Moreover, rent growth had likewise begun to decline in February.
| Q4 2021 | January 2022 | February 2022 | |
| Renewal | 13.3% | 14.7% | 13.0% |
| New | 17.7% | 16.7% | 15.6% |
| Blended | 15.6% | 15.7% | 14.3% |
Here CPT’s well-positioned portfolio should assist in keeping rent growth relatively strong in the midst of headwinds from base effects and new housing completions.
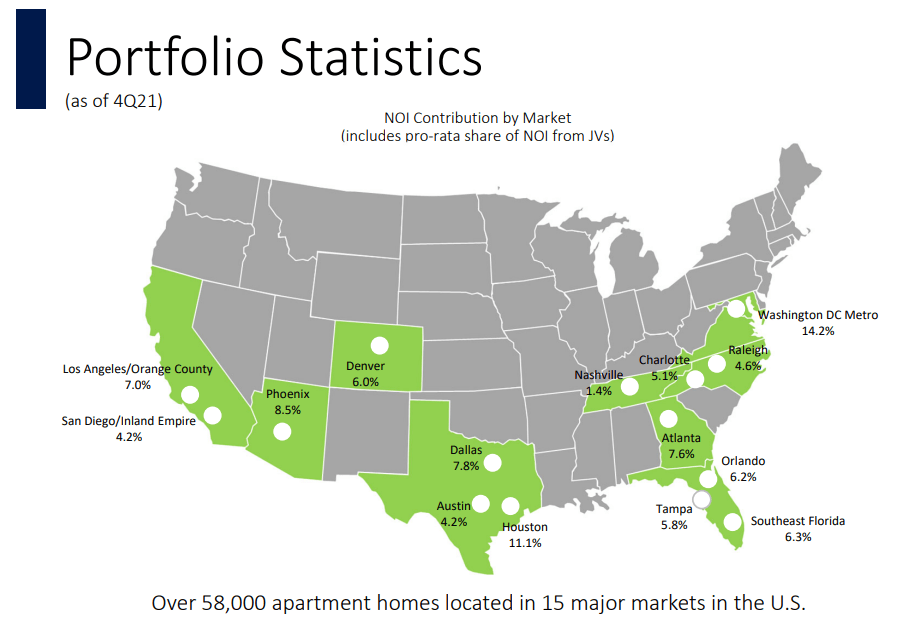
CPT Q4 2021 Presentation
Compare the above asset map to the fastest apartment rent growth markets in the last 6 months as well as since the beginning of COVID-19:

Apartment List
Nearly 27% of CPT’s NOI derives from the top ten markets for highest rent growth since March 2020. Almost one-third (32.9%) of NOI comes from the top ten markets with highest rent growth in the last six months.
On the other hand, a little over 25% of rent derives from two of the top ten markets (Washington D.C. and Houston) that have experienced the slowest rent growth since March 2020, and the Denver market (from which 6% of CPT’s NOI derives) has seen flat rent over the last six months.
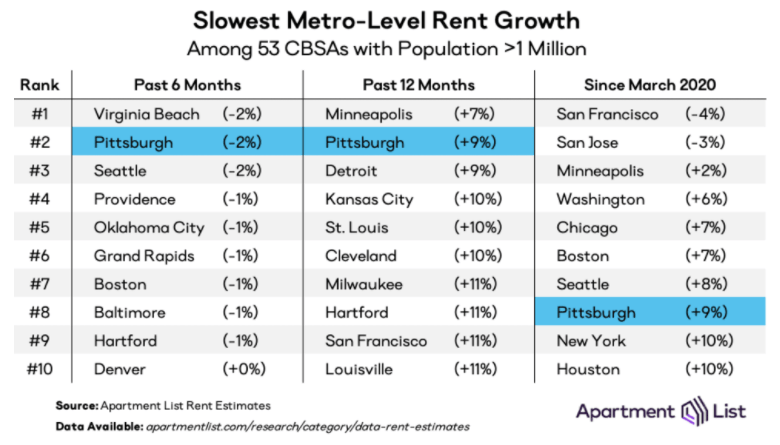
Apartment List
Washington D.C. is a more cyclical market than CPT’s average Sunbelt city, and Houston’s rents surely took a hit from the extreme pain felt in the energy industry during the pandemic. Meanwhile, Denver simply hasn’t enjoyed the same level of in-migration as many Sunbelt markets.
Overall, CPT’s markets do look extraordinarily well-positioned for above-average rent growth in the coming years. CPT has a presence in almost all of the cities with the fastest population and job growth.

CPT Q4 2021 Presentation
Moreover, CPT has a total development pipeline of nearly $2 billion across 16 properties ($818 million currently in development and $1.15 billion planned). These developments will increase CPT’s presence in such hot markets as Atlanta, Georgia; Charlotte and Durham, North Carolina; and Orlando, Florida.
These factors make CPT one of the best multifamily REITs to own. But that doesn’t mean the stock makes a good buy today. And neither does it mean that rent growth rates won’t drop from their current lofty levels in the mid-teens.
Bottom Line
When rent growth slows down, NOI growth tends to slow down with it. Eventually, FFO per share growth is likely to slow as well. This is especially true with homebuilders and multifamily developers chomping at the bit to deliver a big wave of new residential units as soon as possible.
The market seems to think that the underbuilding of the 2010s will continue into the 2020s, but that does not appear to be the case based on housing starts.
I would love to own more CPT, but I can’t escape the conclusion that too much optimism is priced into shares at this time. The good times of double-digit rent, NOI, and FFO per share growth won’t last forever.
The analyst consensus is for 19% FFO per share growth in 2022 and another ~10% in 2023. That still puts CPT at a price/FFO of 24x based on 2023’s analyst consensus FFO per share of $7.04. I would envision FFO per share growth dropping back to the mid-single-digit territory thereafter. If so, then a 24x FFO multiple based on 2023 earnings is too high a price to pay.
As such, CPT is a hold for now.
Be the first to comment