


krblokhin
Earnings of Camden National Corporation (NASDAQ:CAC) will likely increase slightly this year on the back of the lagged benefit of interest rate hikes. Further, subdued loan growth will support earnings. Overall, I’m expecting Camden National to report earnings of $4.24 per share for 2023, up 2% from my estimated earnings of $4.16 per share for 2022. The December 2023 target price suggests a small upside from the current market price. Based on the total expected return, I’m adopting a hold rating on Camden National Corporation.
Margin to Fare Better in 2023
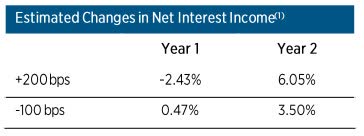
Camden National’s net interest margin grew slightly by four basis points in the third quarter after dipping by three basis points in the second quarter of the year. Due to the large balance of residential mortgages, which usually carry fixed rates, the loan portfolio is quite slow to re-price. As mentioned in the September presentation, adjustable-rate loans make up only 37% of total loans. In comparison, deposits are quicker to reprice. Therefore, the margin stands to initially take a hit from rising interest rates. However, in the longer term, the net interest margin will benefit. The results of the management’s interest-rate simulation model show that a 200-basis points hike in interest rates could decrease the net interest income by 2.43% in the first year and then increase the net interest income by 6.05% in the second year of the rate hike.
September Presentation
The above simulation results take into account the historical balance sheet and old rate sensitivities. In reality, the deposit beta (rate-sensitivity) will naturally worsen in upcoming quarters as depositors will chase yields and move the funds from low interest-bearing accounts to higher interest-bearing accounts. The management mentioned in the conference call that it is “laddering” products so that it can retain depositors and help them shift to higher-yielding products.
On the plus side, the new loan additions will lift the margin. As mentioned in the presentation, residential real estate loans in the pipeline had a yield of 4.83%, while commercial loans in the pipeline had a yield of 4.90%. These estimated yields were much higher than the average loan portfolio yield of 3.91% in the third quarter, as mentioned in the 10-Q filing.
Considering these factors, I’m expecting the margin to have remained unchanged in the last quarter of 2022. Further, I’m expecting the margin to grow by ten basis points in the latter part of 2023.
Weaknesses in Residential Mortgage Market to Drag Loan Growth
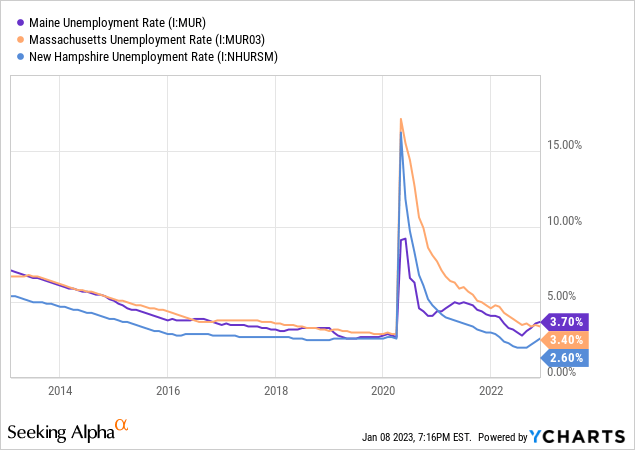
Camden National’s loan growth continued to remain above average in the third quarter of 2022. The portfolio grew by 3.6% during the quarter, taking the first nine-month growth to 13%, or 17% annualized. Commercial loans will likely continue to grow in upcoming quarters thanks to robust job markets. Camden National mostly operates in Maine with some presence in Massachusetts and New Hampshire. As shown below, the unemployment rates of all three states are currently quite low compared to their respective histories.
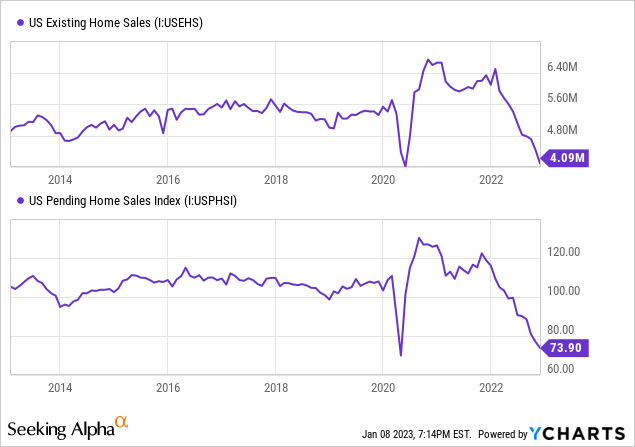
Unfortunately, the outlook for residential loans is not as bright. Residential loans make up around 48% of total loans. Therefore, the interest rate hikes and their effect on mortgage demand will have a significant impact on total loan growth. As shown below, U.S. home sales have continued to trend downwards since early 2022.
Although the rising rates have weakened the U.S. housing market, Camden National’s residential loan pipeline was very strong at the beginning of the fourth quarter, as mentioned in the conference call. The management was also positive about commercial pipelines. As mentioned in the conference call, the residential pipeline stood at $110 million while the commercial pipeline stood at $90 million. To put these numbers in perspective, $110 million is 3% and $90 million is 2% of the loans outstanding at the end of September 2022. Therefore, loan growth can be expected to have stayed strong in the last quarter of 2022. In my opinion, the slowdown in the general housing market will eventually get to Camden in 2023.
Overall, I’m expecting the loan portfolio to have grown by 2% in the last quarter of 2022, taking full-year loan growth to 15%. For 2023, I’m expecting the loan portfolio to grow by 4%. Meanwhile, I’m expecting deposits to grow in line with loans. The following table shows my balance sheet estimates.
| Financial Position | FY18 | FY19 | FY20 | FY21 | FY22E | FY23E |
| Net Loans | 3,002 | 3,070 | 3,182 | 3,398 | 3,901 | 4,059 |
| Growth of Net Loans | 8.8% | 2.3% | 3.7% | 6.8% | 14.8% | 4.1% |
| Other Earning Assets | 946 | 985 | 1,271 | 1,710 | 1,295 | 1,335 |
| Deposits | 3,464 | 3,538 | 4,005 | 4,609 | 4,660 | 4,849 |
| Borrowings and Sub-Debt | 342 | 338 | 247 | 256 | 469 | 483 |
| Common equity | 436 | 473 | 529 | 541 | 440 | 478 |
| Book Value Per Share ($) | 27.9 | 30.6 | 35.2 | 36.2 | 30.0 | 32.6 |
| Tangible BVPS ($) | 21.6 | 24.3 | 28.7 | 29.7 | 23.4 | 26.0 |
| Source: SEC Filings, Author’s Estimates(In USD million unless otherwise specified) | ||||||
Expecting Earnings to Grow by 2%
The lagged benefit of interest rate hikes for the margin will likely drive earnings this year. Further, the bottom line will receive support from subdued loan growth. Meanwhile, I’m expecting the provisioning for expected loan losses to remain near a normal level. I’m expecting the net provision expense to make up around 0.11% of total loans in 2023, which is the same as the average for the last five years.
Overall, I’m expecting Camden National to report earnings of $4.16 per share for 2022, down 10% year-over-year. For 2023, I’m expecting earnings to grow by 2% to $4.24 per share. The following table shows my income statement estimates.
| Income Statement | FY18 | FY19 | FY20 | FY21 | FY22E | FY23E |
| Net interest income | 120 | 128 | 136 | 137 | 149 | 159 |
| Provision for loan losses | 1 | 3 | 12 | (3) | 6 | 4 |
| Non-interest income | 38 | 42 | 50 | 50 | 41 | 41 |
| Non-interest expense | 92 | 95 | 100 | 104 | 107 | 116 |
| Net income – Common Sh. | 53 | 57 | 59 | 69 | 61 | 62 |
| EPS – Diluted ($) | 3.39 | 3.69 | 3.95 | 4.60 | 4.16 | 4.24 |
| Source: SEC Filings, Earnings Releases, Author’s Estimates(In USD million unless otherwise specified) | ||||||
My estimates are based on certain macroeconomic assumptions that may not come to fruition. Therefore, actual earnings can differ materially from my estimates.
Current Stock Price is Near the Year-Ahead Target Price
Camden National is offering a dividend yield of 4.0% at the current quarterly dividend rate of $0.42 per share. The earnings and dividend estimates suggest a payout ratio of 39.6% for 2023, which is close to the five-year average of 34.6%. Therefore, I’m not expecting another increase in the dividend level this year.
I’m using the historical price-to-tangible book (“P/TB”) and price-to-earnings (“P/E”) multiples to value Camden National. The stock has traded at an average P/TB ratio of 1.64 in the past, as shown below.
| FY18 | FY19 | FY20 | FY21 | Average | ||
| T. Book Value per Share ($) | 21.6 | 24.3 | 28.7 | 29.7 | ||
| Average Market Price ($) | 43.5 | 43.3 | 35.1 | 45.9 | ||
| Historical P/TB | 2.02x | 1.78x | 1.22x | 1.55x | 1.64x | |
| Source: Company Financials, Yahoo Finance, Author’s Estimates | ||||||
Multiplying the average P/TB multiple with the forecast tangible book value per share of $26.0 gives a target price of $42.7 for the end of 2023. This price target implies a 0.8% upside from the January 6 closing price. The following table shows the sensitivity of the target price to the P/TB ratio.
| P/TB Multiple | 1.44x | 1.54x | 1.64x | 1.74x | 1.84x |
| TBVPS – Dec 2023 ($) | 26.0 | 26.0 | 26.0 | 26.0 | 26.0 |
| Target Price ($) | 37.5 | 40.1 | 42.7 | 45.3 | 47.9 |
| Market Price ($) | 42.3 | 42.3 | 42.3 | 42.3 | 42.3 |
| Upside/(Downside) | (11.4)% | (5.3)% | 0.8% | 7.0% | 13.1% |
| Source: Author’s Estimates |
The stock has traded at an average P/E ratio of around 10.9x in the past, as shown below.
| FY18 | FY19 | FY20 | FY21 | Average | ||
| Earnings per Share ($) | 3.39 | 3.69 | 3.95 | 4.60 | ||
| Average Market Price ($) | 43.5 | 43.3 | 35.1 | 45.9 | ||
| Historical P/E | 12.8x | 11.7x | 8.9x | 10.0x | 10.9x | |
| Source: Company Financials, Yahoo Finance, Author’s Estimates | ||||||
Multiplying the average P/E multiple with the forecast earnings per share of $4.24 gives a target price of $46.0 for the end of 2023. This price target implies an 8.7% upside from the January 6 closing price. The following table shows the sensitivity of the target price to the P/E ratio.
| P/E Multiple | 8.9x | 9.9x | 10.9x | 11.9x | 12.9x |
| EPS 2023 ($) | 4.24 | 4.24 | 4.24 | 4.24 | 4.24 |
| Target Price ($) | 37.5 | 41.8 | 46.0 | 50.3 | 54.5 |
| Market Price ($) | 42.3 | 42.3 | 42.3 | 42.3 | 42.3 |
| Upside/(Downside) | (11.3)% | (1.3)% | 8.7% | 18.8% | 28.8% |
| Source: Author’s Estimates |
Equally weighting the target prices from the two valuation methods gives a combined target price of $44.3, which implies a 4.8% upside from the current market price. Adding the forward dividend yield gives a total expected return of 8.8%.
Camden National’s stock price has dipped by 16.5% over the last 12 months. However, the stock price has still not reached a level that is attractive enough. Based on the total expected return, I’m adopting a hold rating on Camden National Corporation.
Be the first to comment