


naphtalina/iStock via Getty Images
Investment summary
We are long shares of Cabaletta Bio, Inc. (NASDAQ:CABA) having recognized a comfortable return after entering at $2.03 in December last year. Since, the stock has rallied to ~$11, and I’m back to today to share out latest findings on the stock, advocating that the rally has legs to extend. The market continues to show demand for the stock following recent advancements in its CABA-201 pathway. Following this analysis, we are looking for an entry point at ~$10.50–$11.50, buying another 500 shares, and opine there’s scope for another 36% upside potential at the current market price to $15.50. Net-net, we rate CABA a buy.
The key risks to the investment thesis would be a sharp reversal in price action that would knock out our stop losses and take us out of the position. If the stock pulls back below $7, we will withdraw completely and look to buy back later if things stack up again. Moreover, any negative news on any part of the company’s pipeline could attract a negative price response from the market. Being a small-cap stock, prices can be volatile, and this volatility can occur very quickly in wide fashion. Investors should be fully aware of these risks before reading any further.
CABA recent developments: CABA-201 pathway
There’s been numerous advancements in the field of oncology in the recent decade. Perhaps one of the most exciting discoveries has been around Chimeric Antigen Receptor T-cell therapy (“CAR T”). This therapy involves re-engineering a patient’s own T-lymphocytes so that they can identify and eliminate cancer cells. This approach has been met with remarkable success in preclinical and clinical trials of some haematological malignancies, leading to the FDA approval of six CAR-T products currently available in the market, shown in Exhibit 1.
Exhibit 1. FDA Approved CAR T drugs
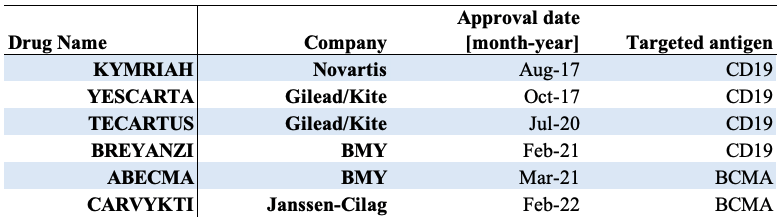
Data: Mazinani & Rahbarizadeh (2022), see: “Table 1”. Image: Author
In October FY22′ CABA announced its CABA–201 investigational compound. It is a human C19 CAR, containing a 4-1BB co-stimulatory domain. The key differentiator for CABA is that it has obtained an exclusive, worldwide license for the C19 binder in CABA-201. In our opinion, this is a large advancement in the company’s propensity to differentiate itself in a concentrated space of the oncology market. Especially as recent evidence points to this route being a potentially viable hypothesis.
To illustrate, a clinical trial published in September FY22′ presented data on the use of a CD19-CAR T cell therapy in combination with a 4-1BB co-stimulatory domain. The key findings were shown when the combination was preceded by lymphodepletion [with fludarabine and cyclophosphamide] in the treatment of severe, refractory systemic lupus erythematosus (“SLE”). The study observed clinical remission in 100% of the patient cohort [n=5] with a median follow-up period of 17 months.
The safety profile held up well, with low incidence of cytokine release syndrome (“CRS”) and no observed cases of immune effector cell-associated neurotoxicity syndrome (“ICANS”). We’d note this was an important step forward in the safety profile of the CABA-201 compound. Furthermore, repopulation of new B cells was observed within 2-5 months post-infusion, without any signs of disease recurrence or auto-antibodies after the repopulation.
For CABA, it’s CD19 binder has been evaluated in a clinical trial conducted in China. Interestingly, the CD19 binder was discovered through a screening process involving 100Bn antibody fragments, and was evaluated using FMC63 as a benchmark [FMC63 is a widely used CD19 binder]. The methodology is using a dual-CD19xCD22 CAR T therapy that is being developed for the treatment of B cell leukaemia and lymphoma. Tolerability also held up well in the entire patient population [n=20], whereas results evidenced the CD19 binder possesses comparable biological activity to FMC63. Due to its similarities with the CD19-CAR T construct that was used in the trial listed earlier – which incorporated a 4-1BB co-stimulatory domain – CABA has strong hopes to provide a medical breakthrough in the treatment of autoimmune diseases caused by B cells, especially SLE. This is a very compelling advancement in our opinion, and should CABA continue progressing through its phase studies here, there’s wide potential to disrupt the market.
Exhibit 2. CABA-201 clinical pipeline
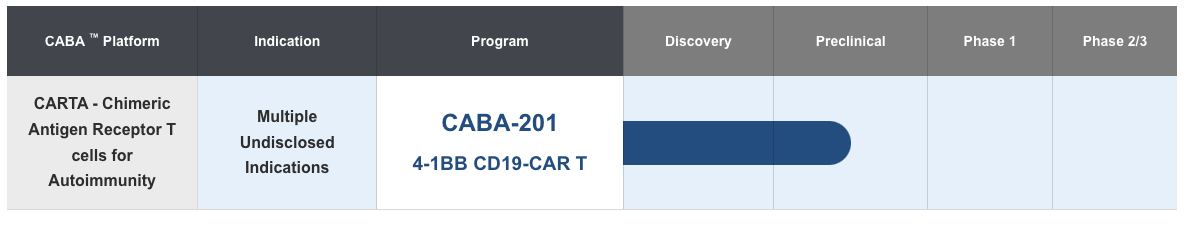
Data: CABA Website, see: “CABA-201”
Market positioning for CABA to guide price visibility
Being a pre-clinical biotech, the absence of CABA’s fundamentals [revenues, earnings, etc.] commands that we rigorously analyse the technical picture to guide price visibility looking ahead. The sharp rally that saw CABA run up the page from October – following its CABA-201 update – is well observed Exhibit 3. Key point to note is that the stock rallied off lows of $0.68 to a high of $11.91, a 1,650% return in this period. This is one of the primary benefits in trading/investing in small-cap securities, in that the price differentials lead to tremendously high return opportunities. Those who bought in at the lows have been large beneficiaries of the rally, which looks to have curled over in the last 3 weeks after the stock broke the upper bound of the ascending channel in the final week of December.
Exhibit 3. CABA rally off lows of $0.68
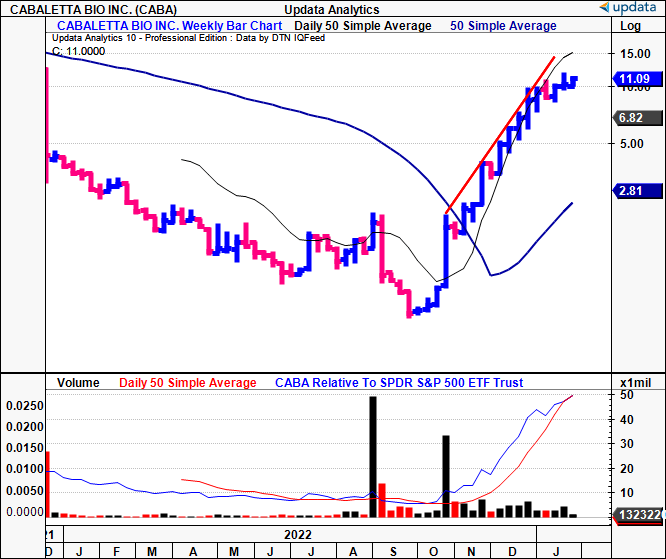
Data: Updata
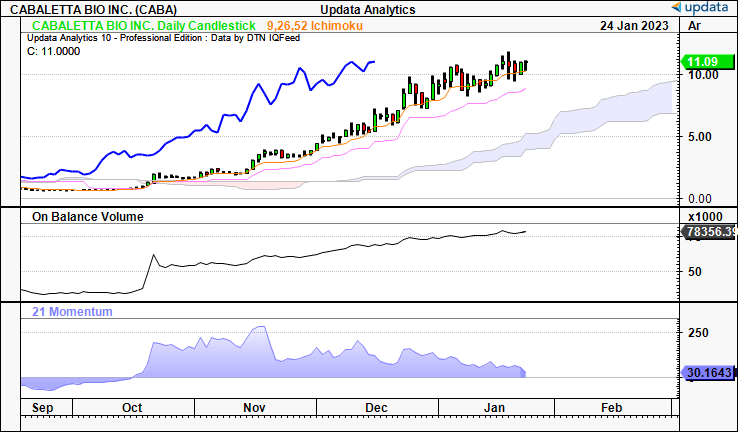
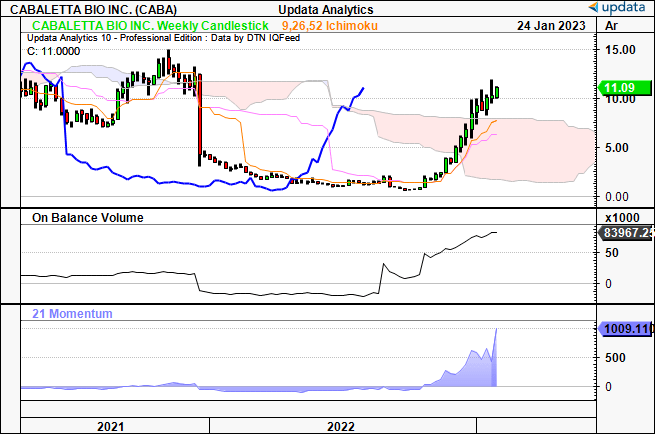
Given the stock has pushed sideways the last 3 weeks trend analysis is essential. We see shares positioned well above the cloud, with the lagging line driving north still. This tells us the trend remains bullish on a medium-term horizon; in other words, the coming weeks. There’s scope for the stock to pullback and close at ~$9.50 by end of February and still remain in the support zone. Looking further out, the weekly chart tells us shares have bullish momentum over a horizon of the next 1-2 months.
Meanwhile, on-balance volume is telling us there’s been plenty of buying activity since October, meaning demand is still strong from buyers at this stage, corroborating the above points.
Exhibit 4. Bullish above the cloud, projecting bullish trend to remain over coming weeks
Data: Updata
Exhibit 5. Shares bullish looking to long-term horizon [1-2 months out]
Data: Updata
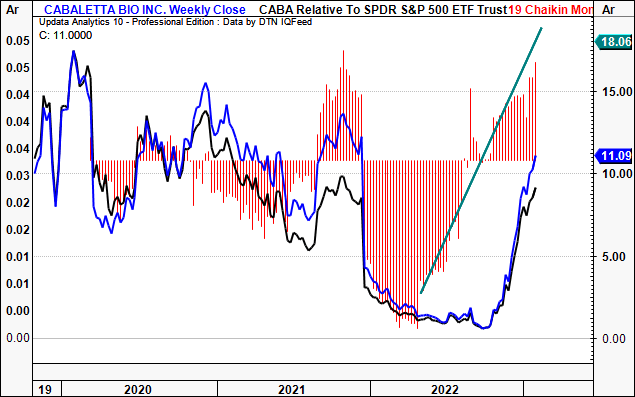
We see further evidence of the demand levels when looking at weekly money flows into CABA equity. You’ll see below that inflows have continued to spike higher, suggesting strong demand at the current market values. This is another bullish weight to the risk/reward calculus.
Exhibit 6. CABA weekly money flows illustrating strong demand [buyers] at current levels. Strong base to continue rally.
Data: Updata
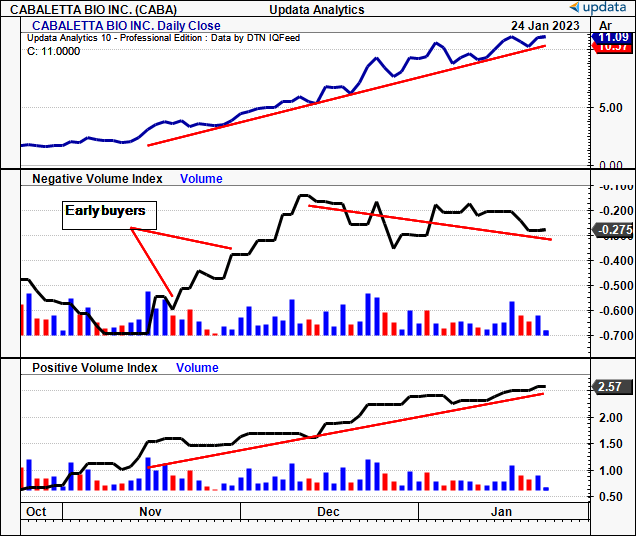
The question now turns to what kind of buyers we have in the market for CABA. You’ll see in Exhibit 7, large buyers [evidenced by the negative volume index, (“NVI”)] were very quick onto the rally, likely providing enormous buying volume at its early stages. These kind of buyers appear to have slowed up somewhat over the last 2 months, potentially remaining long, or even selling into the strength to take profits. We estimate retail flows have been equally as strong across the entire rally as shown by the positive volume index. As a potential risk, the divergence in the CABA share price to the NVI, could suggest that demand is running into exhaustion, should it continue to widen. In the same breath, it also suggests that institutional and accredited investors are active on this name.
Exhibit 7. Large buyers early onto the rally, with retail flows consistently driving gains across the entire span
Data: Updata
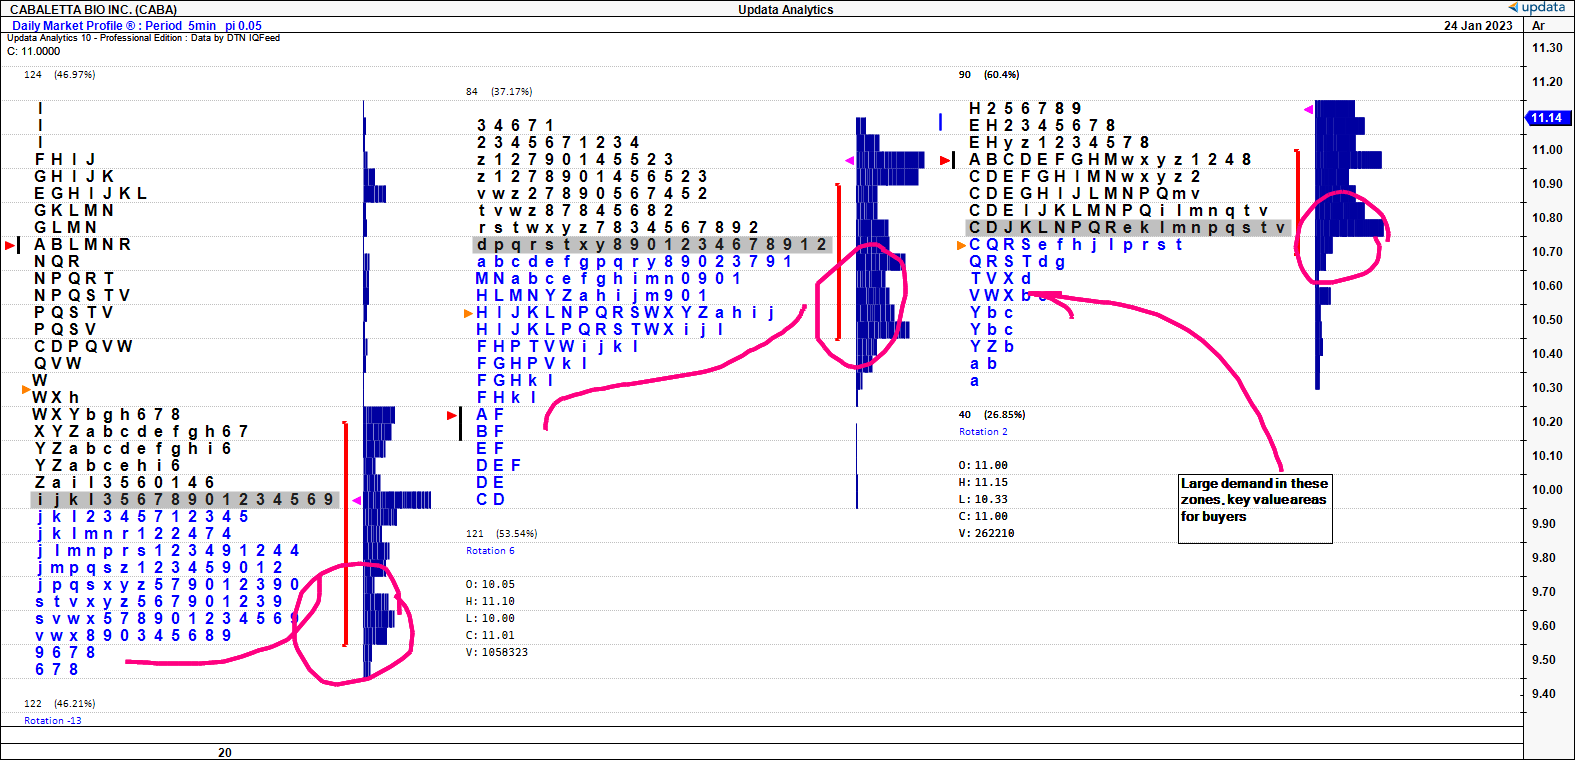
Zooming in on the last 3 weeks of trade, we used the market profile analysis to understand where the market has been trading CABA over this time [Exhibit 8]. To summarize how to interpret the chart, each letter represents a time period, and prices are listed vertically with volume. It shows how long the CABA share price spent at each price level in this time. You’ll note that demand has been incredibly strong at the $10–$10.80 zones over the last 3 weeks, with the stock spending the most time at these prices [shown in grey row]. This is known as the point of control (“POC), and is where the market has found equilibrium at a fair price. The bulk of trading volume has actually occurred above these marks, suggesting longs could be stuck, reducing supply further. At the current POC, it suggests that any mark from $10.50–$11 would represent fantastic entry points, with the markets comfort at these levels. On a pullback, you’d be looking to the $9.50–$10 range as potential entry points to maximise value.
Exhibit 8. Market profile suggesting strong entry points at $9.50–$11 range with market support at these ranges
Data: Updata
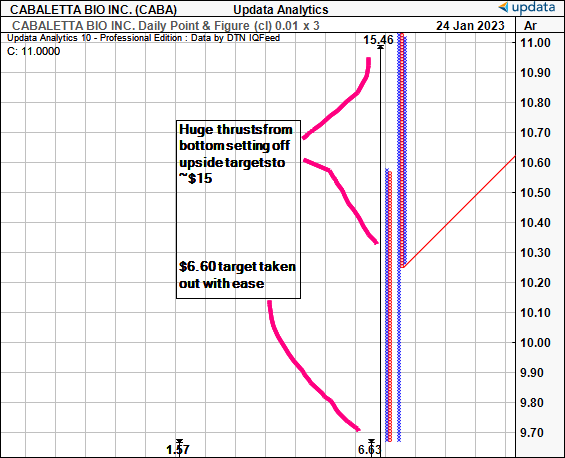
As such, we turned to our point and figure analysis using a 0.01 point x 3 box reversal to see the most sensitive of price movements. These charts are great because they remove the short-term noise/volatility, giving greater insight into the stock’s directional movements. Following the large thrusts off its lows last year, we see the $6.60 target taken out with ease, with the a new upside target to ~$15.50 the next in situ. We are confident, that, should the rally extend, this serves as an appropriate target to aim for, offering another 36% upside at the time of writing.
Exhibit 9. Upside targets to ~$15.50, ~36% upside potential
Data: Updata
In short
We are long CABA shares and are sizing into the position further at the current market prices, looking for an entry point at ~$10.50–$11.50. We believe there’s scope for another 36% upside potential at the current market price and we are buying another 500 shares, resulting in a potential $2,016 absolute return [500x$11.20 = $5,600; at 36% return = $7,616, gross profit = $2,016/(36%)]. Should this eventuate, we’d be looking to review the position to either take profit or scale in further at similar sizing. Net-net, we rate CABA a buy at $15.50 price target.
Be the first to comment