

R&A Studio
Elections are important for the health of our democracy, but often times investors make the mistake of thinking that what happens at the ballot box should affect how they invest.
If you mix politics and investing, you’re making a big mistake.” – Warren Buffett
Warren Buffett has earned investors 20% annual returns through 15 presidential administrations.
Daily Shot
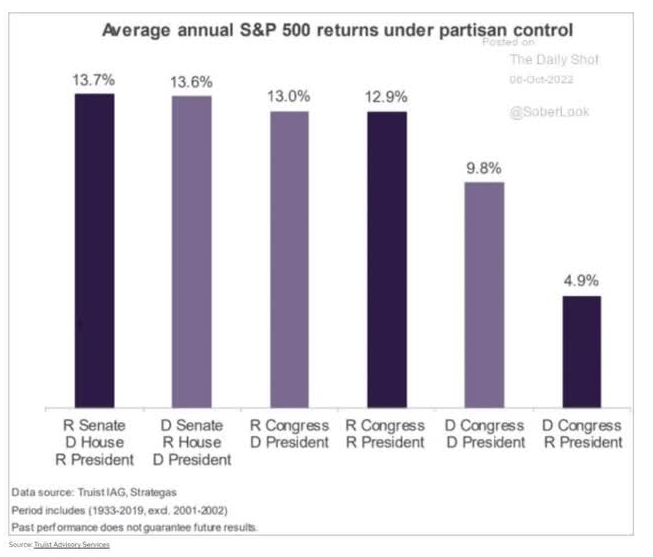
Usually, it doesn’t matter which party holds Congress or the Whitehouse, stocks deliver similar returns over time.
Daily Shot
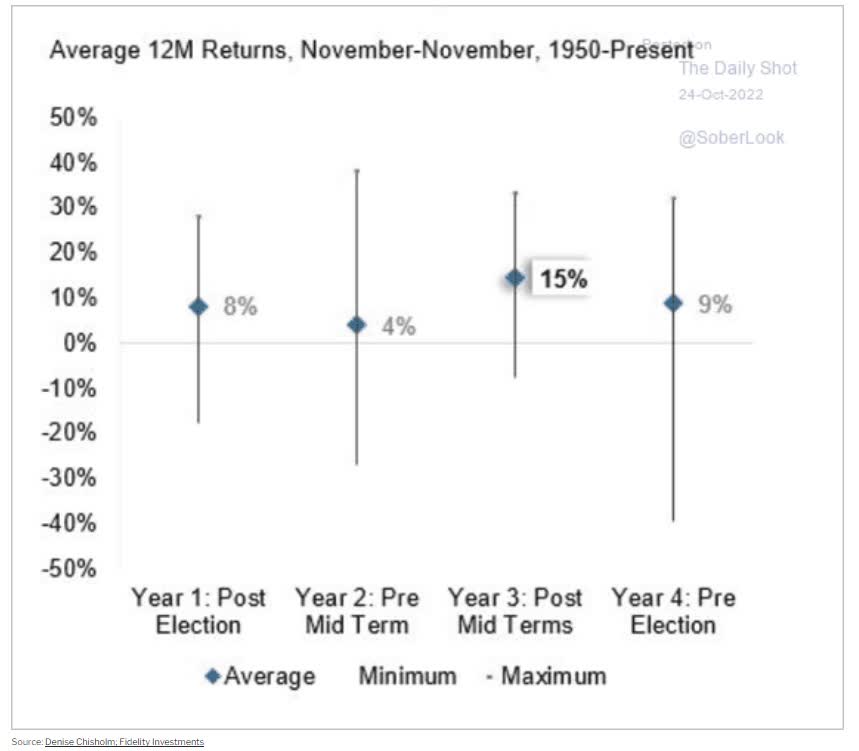
Year two of the election cycle (this year) is historically the worst year for stocks, and this year has been no different.
Next year is, historically speaking, the strongest year for stocks in the election cycle.
State Street
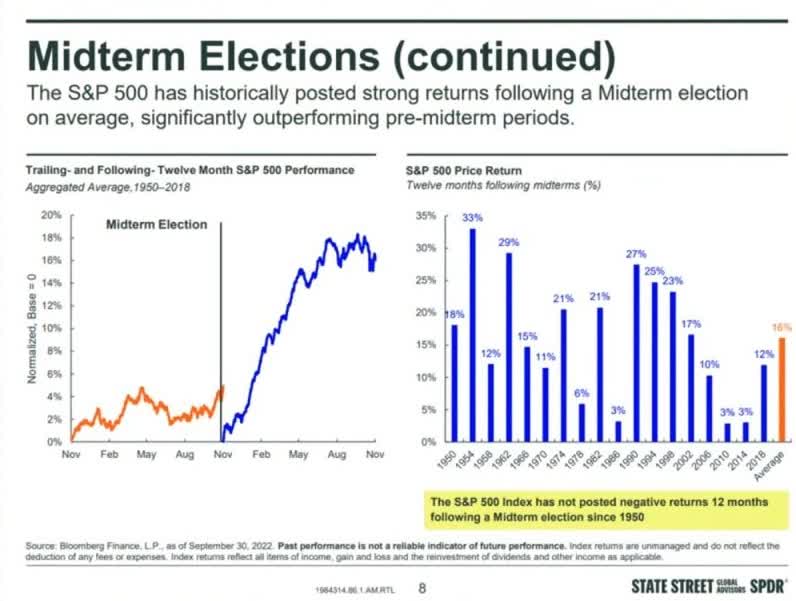
In fact, since 1950 the S&P has never failed to deliver positive returns in the 12 months following a mid-term.
What about this election? Historically speaking the party in power loses at least one house of Congress and this time is expected to be no different.
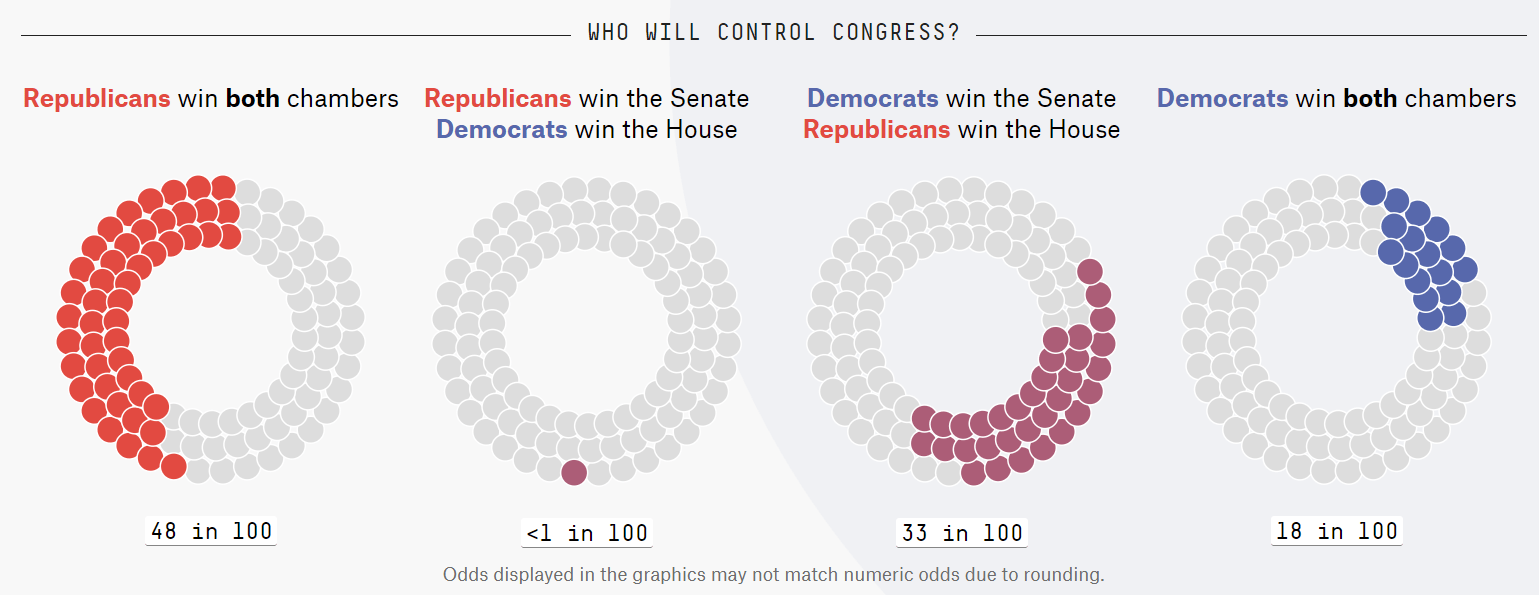
FiveThirtyEight
According to 538.com, which models 50,000 daily mid-term elections based on the most accurate political model of the last 14 years, there is an 81% chance of divided government come January 2023.
That’s what Wall Street loves most, and historically leads to the best returns (about 13% annually).
But just in case you are still worried about the outcome of the election affecting your portfolio, consider the dividend aristocrats.
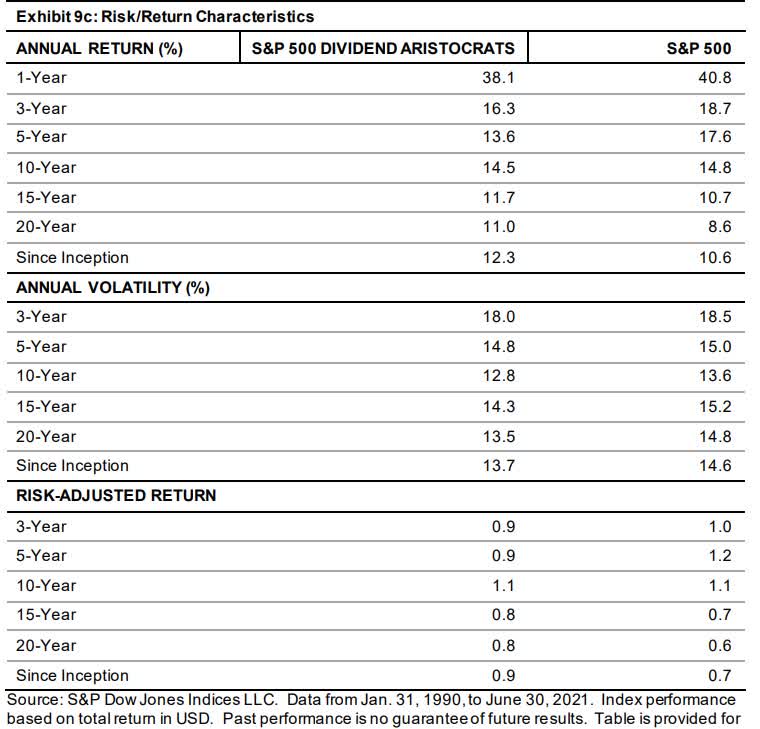
S&P Global
Since 1991 the aristocrats haven’t just been delivering annual dividend growth in every economic, market, and political environment, they’ve been beating the market with less volatility.
That includes every combination of White House, House, and Senate there is.
The bluest of blue-chips, and the ultimate name in dividend dependability are the lowest risk choices for long-term investors worried about the outcome of any individual election.
So let me show you how to easily and quickly find the best dividend aristocrats you can safely buy ahead of this mid-term election, and the 2023 recession.
How To Find The Best Dividend Aristocrats To Buy Ahead Of The Midterms…In 2 Minutes
Let me show you how to screen the Dividend Kings Zen Research Terminal, which runs of the DK 500 Master List, to easily find the best dividend aristocrats to buy ahead of the November 8th election.
The Dividend Kings 500 Master List includes some of the world’s best companies, including:
- every dividend champion (25+ year dividend growth streaks, including foreign aristocrats)
- every dividend aristocrat
- every dividend king (50+ year dividend growth streaks)
- every Ultra SWAN (as close to perfect quality companies as exist)
- the 20% highest quality REITs according to iREIT
- 40 of the world’s best growth blue-chips
| Step | Screening Criteria | Companies Remaining | % Of Master List |
| 1 | Reasonable Buy, Good Buy, Strong Buy, Very Strong Buy, Ultra Value Buy (Never Overpay For Stocks) | 357 | 71.40% |
| 2 | Dividend Champions List (every company with a 25+ year dividend growth streak including foreign ones) | 78 | 15.80% |
| 3 | 10+% long-term return potential (market-like returns or better) | 47 | 9.60% |
| 4 | 81+% safety score (2% or less severe recession dividend cut risk) | 37 | 7.40% |
| 5 | 60+% S&P Global LT-Risk Management Percentile (Low Risk) | 18 | 3.60% |
| 6 | 10+ (Out Of 13 Quality, Blue-Chip or better) | 18 | 3.60% |
| 7 | 3+% Yield | 5 | 1% |
| Total Time | 2 minutes |
The 5 Best High-Yield Dividend Aristocrats To Buy Before The Election
I’ve linked to articles about each company’s investment thesis, growth outlook, and risk profile.
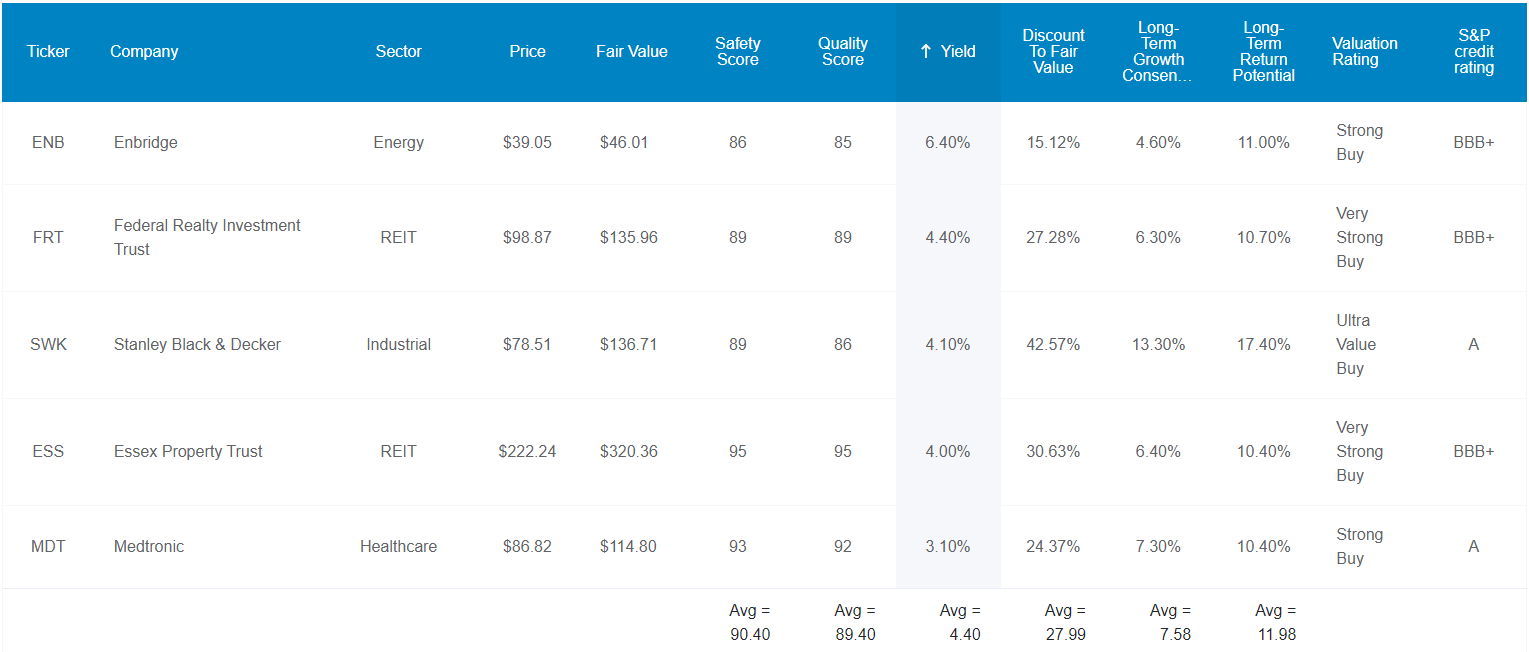
(Source: Dividend Kings Zen Research Terminal)
Here they are in order of highest to lowest yield.
- Enbridge (ENB)
- Federal Realty (FRT)
- Stanley Black & Decker (SWK)
- Essex Property Trust (ESS)
- Medtronic (MDT)
Tax Implications
- ENB is a Canadian company
- 15% dividend tax withholding in taxable accounts only
- none in retirement accounts
- own in retirement account to avoid withholding
- tax credit available in taxable accounts to recoup the withholding
FAST Graphs Up Front
Enbridge 2024 Consensus Total Return Potential
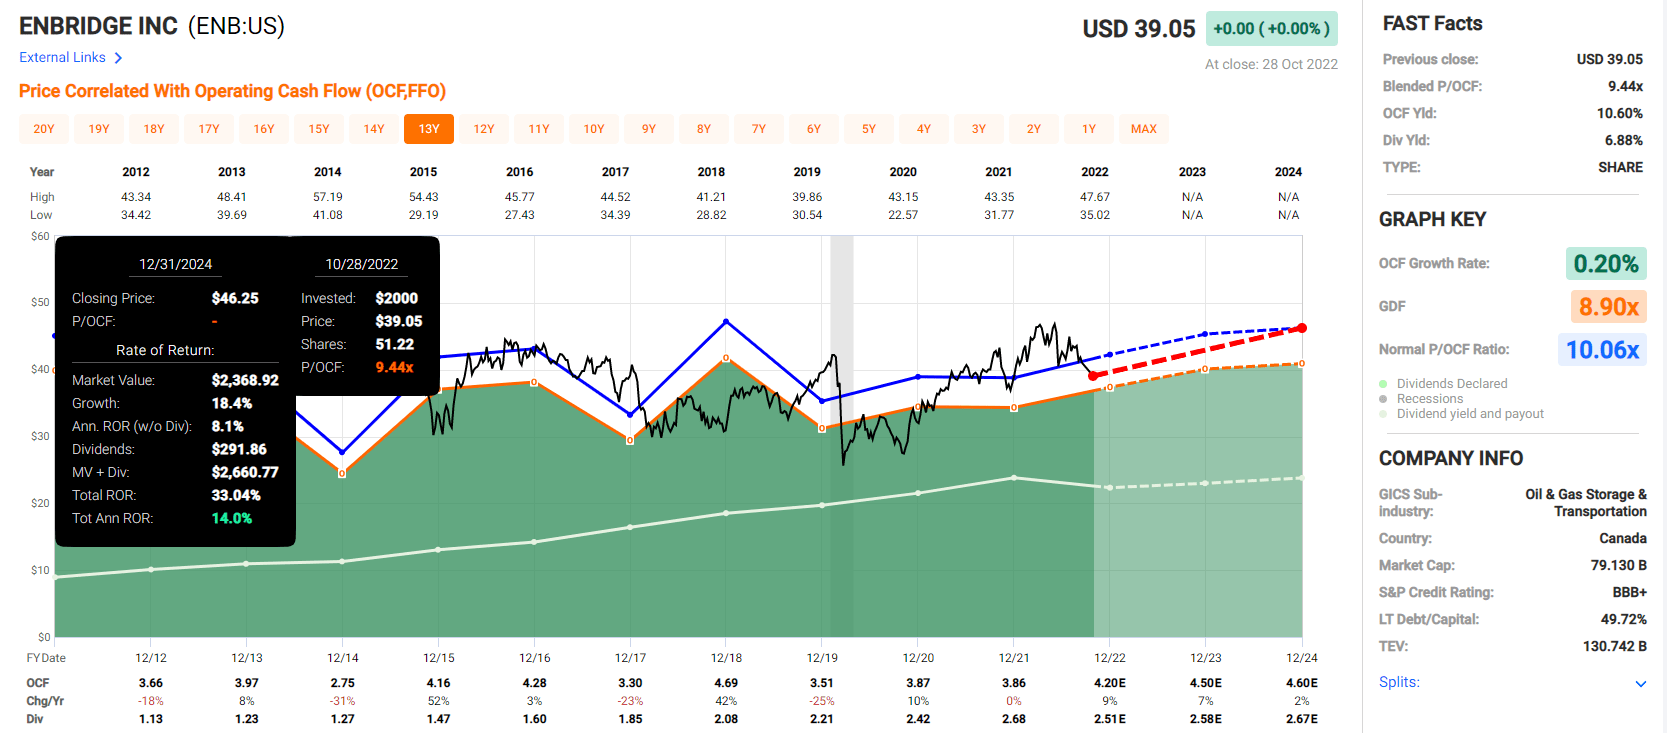
(Source: FAST Graphs, FactSet)
Federal Realty 2024 Consensus Total Return Potential
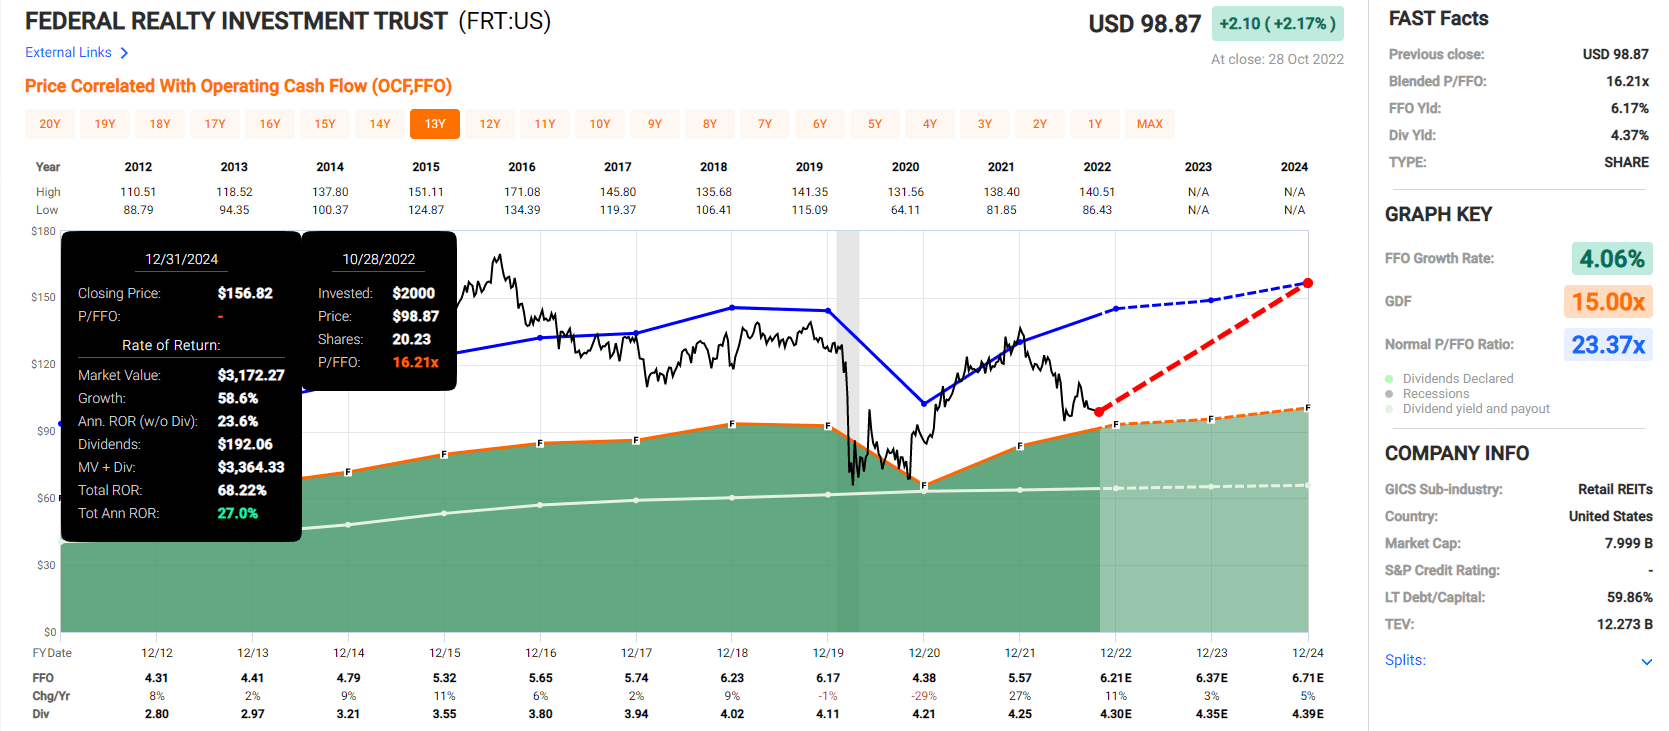
(Source: FAST Graphs, FactSet)
Stanley Black & Decker 2024 Consensus Total Return Potential
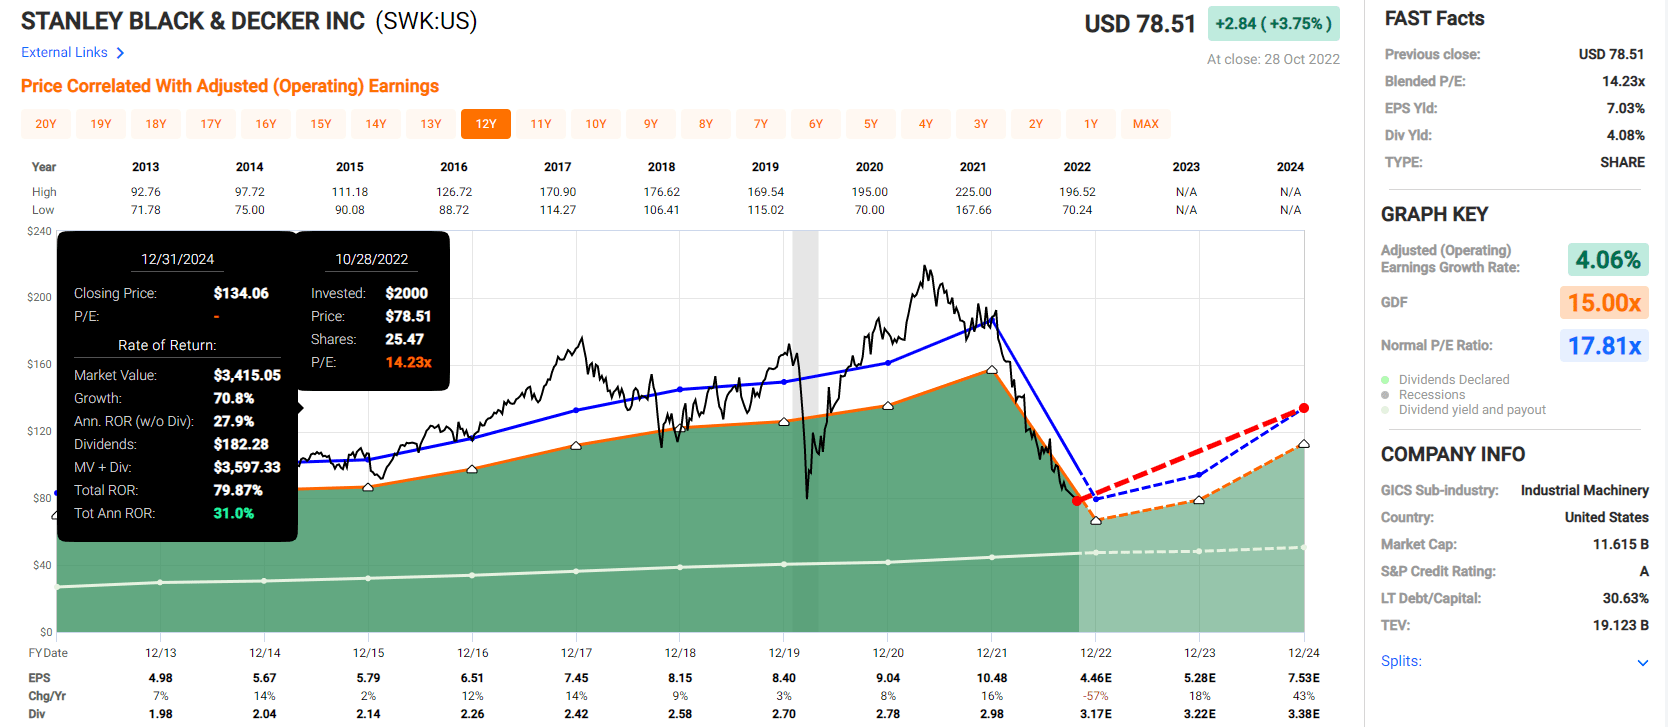
(Source: FAST Graphs, FactSet)
Essex Property Trust 2024 Consensus Total Return Potential
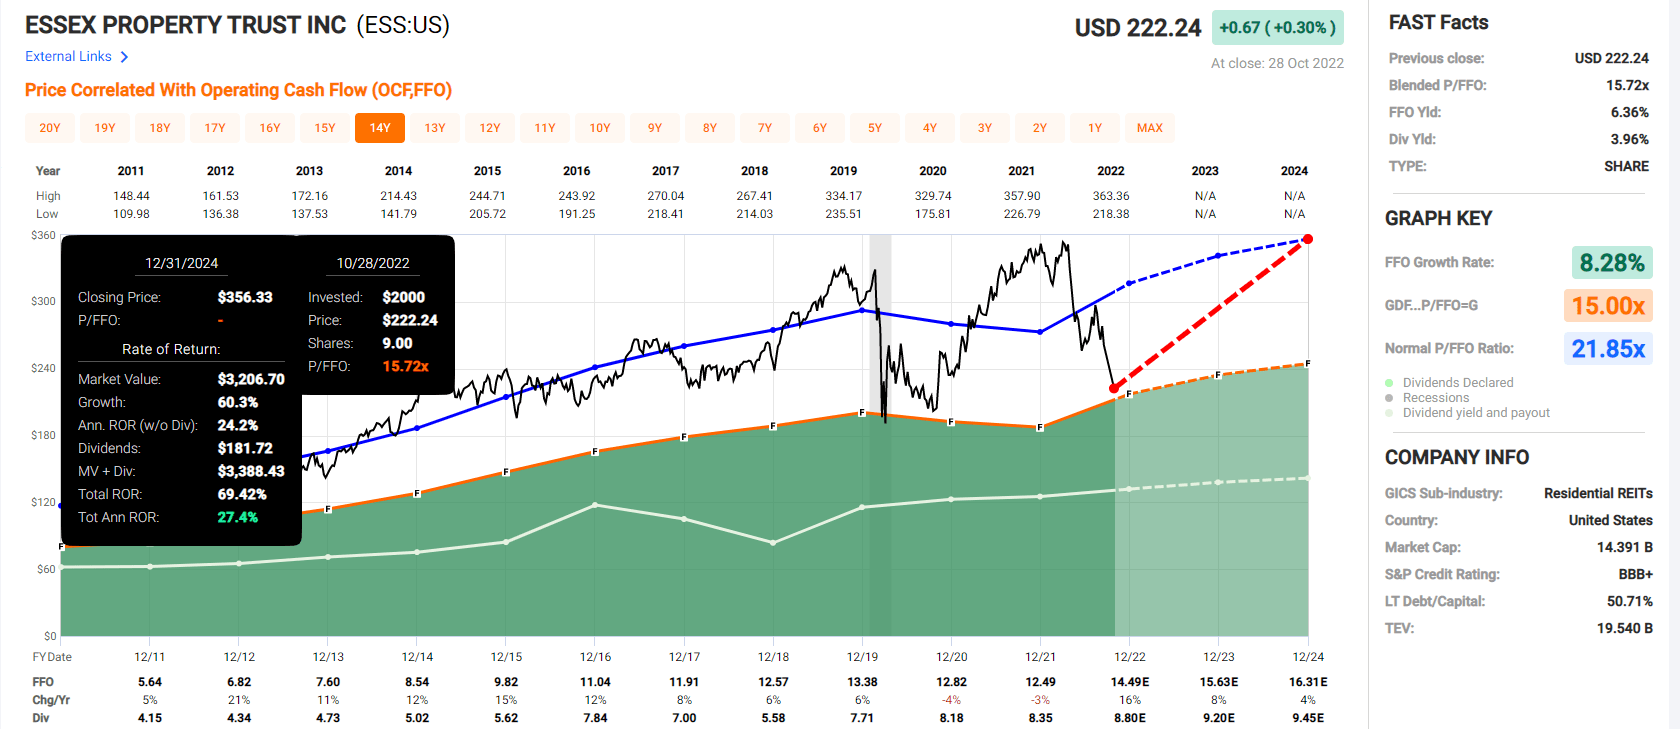
(Source: FAST Graphs, FactSet)
Medtronic 2024 Consensus Total Return Potential
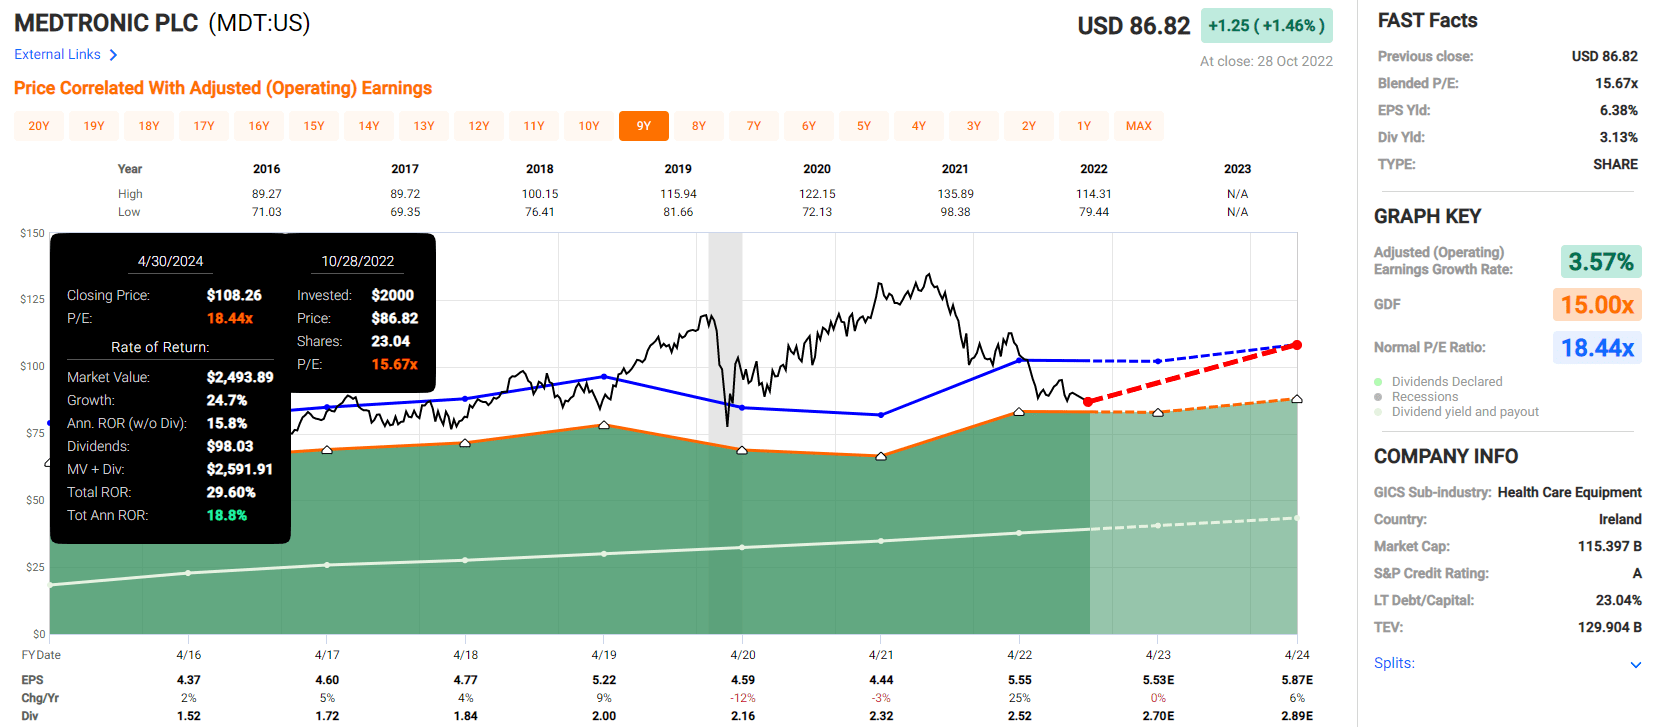
(Source: FAST Graphs, FactSet)
- average consensus total return potential through 2024: 23.6% CAGR
- average consensus total return potential through 2024: 58%
Now compare this to the S&P 500.
S&P 2024 Consensus Total Return Potential
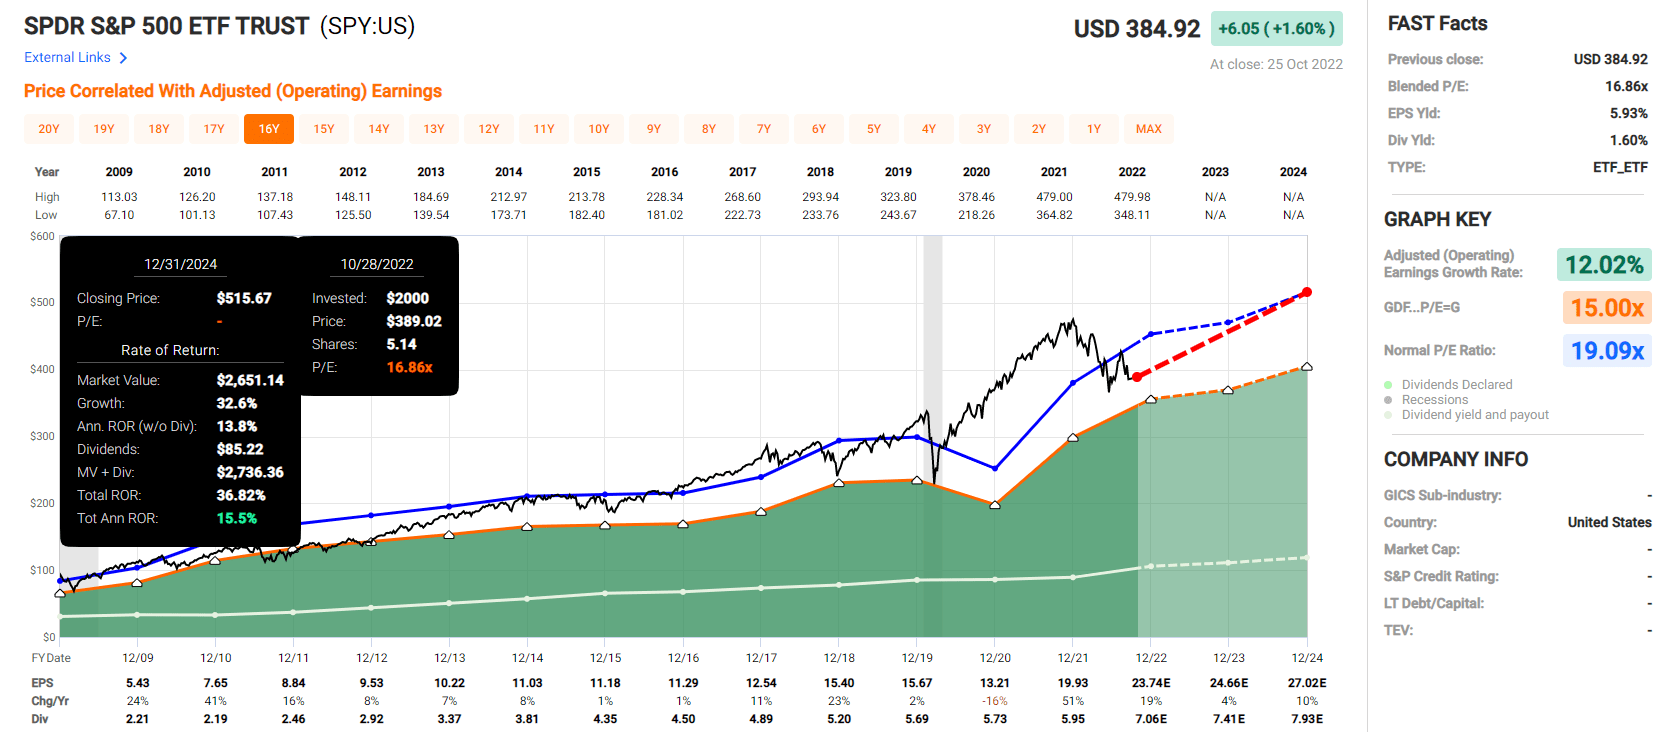
(Source: FAST Graphs, FactSet)
Analysts think the S&P could deliver about 37% total returns through 2024, or 16% CAGR.
These five high-yield aristocrats offer over 50% higher return potential than the S&P 500.
But my goal isn’t help you potentially earn 60% in two years, but life-changing safe income and wealth over years and decades.
5 Of The Safest High-Yield Aristocrats You Can Buy Ahead Of This Election
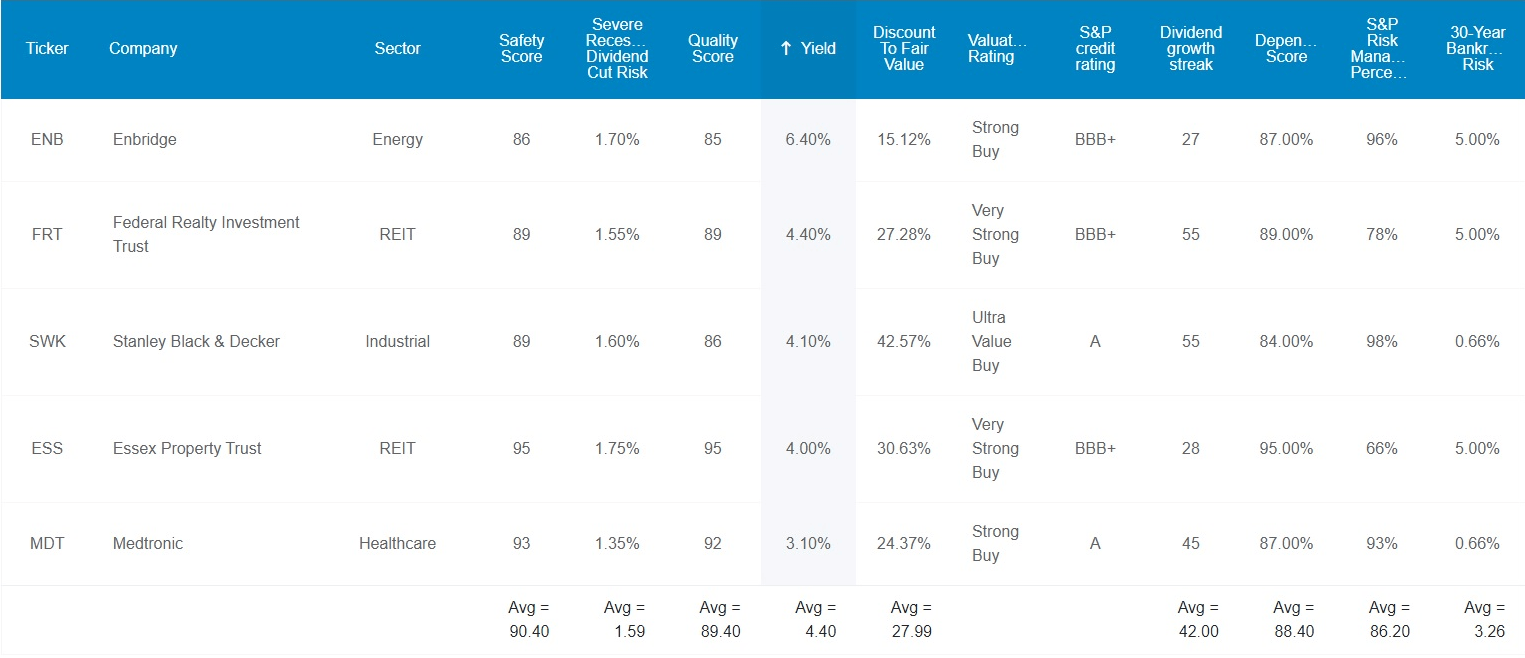
(Source: Dividend Kings Zen Research Terminal)
These aren’t just high-yield aristocrats they are 12.8/13 Ultra SWANs (sleep well at night), as close to perfect quality dividend blue-chips as exist. How can we tell? By comparing them to the dividend aristocrats, the bluest of blue-chips.
Fundamentals Compared To Dividend Aristocrats
| Metric | Dividend Aristocrats | 5 Best Pre-Election High-Yield Aristocrats |
Compared To Aristocrats |
| Quality | 87% | 89% | 102% |
| Safety | 90% | 90% | 100% |
| Average Recession Dividend Cut Risk | 0.5% | 0.5% | 100% |
| Severe Recession Dividend Cut Risk | 1.50% | 1.50% | 100% |
| Dependability | 84% | 88% | 105% |
| Dividend Growth Streak (Years) | 44.8 | 42.0 | 94% |
| Long-Term Risk Management Industry Percentile | 67%, Above-Average, low Risk | 86%, Very Good, Very Low Risk | 128% |
| Average Credit Rating | A- Stable | A- Stable | NA |
| Average Bankruptcy Risk | 3.04% | 3.26% | 107% |
| Average Return On Capital | 105% | 46% | 44% |
| Average ROC Industry Percentile | 83% | 85% | 102% |
| 13-Year Median ROC | 89% | 67% | 75% |
| Forward PE | 19.6 | 14.2 | 72% |
| Discount To Fair Value | 3% | 28% | 933% |
| DK Rating | Reasonable Buy | Very Strong Buy | NA |
| Yield | 2.6% | 4.4% | 169% |
| LT Growth Consensus | 8.5% | 7.6% | 89% |
| Total Return Potential | 11.1% | 12.0% | 108% |
| Risk-Adjusted Expected Return | 7.5% | 8.0% | 106% |
| Inflation & Risk-Adjusted Expected Return | 5.3% | 5.8% | 109% |
| Conservative Years To Double | 13.5 | 12.4 | 92% |
| Average | 144% |
(Source: Dividend Kings Zen Research Terminal)
Ben Graham considered 20+ years without a dividend cut an important sign of quality and 20+ year dividend growth streaks a sign of excellence.
These aristocrats average a 42-year streak, more than 2X the Graham standard of excellence.
Their average risk of a dividend cut in a historically average recession since WWII is 0.5% and their average risk in a severe Pandemic/Great Recession level downturn is about 1.5%.
Joel Greenblatt considers return on capital, or ROC, his gold standard proxy for quality and moatiness.
- annual pre-tax profit/the cost of running the business
The S&P 500’s ROC is 14.6% and these aristocrats have ROC of 46%, 3X better than the average S&P 500 company.
Their profitability is in the 85th industry percentile, indicating wide moats.
S&P estimates their average 30-year bankruptcy risk at 3.2%, an A- stable credit rating, on par with the aristocrats.
And in terms of long-term risk management S&P estimates an average global risk-management percentile of 86th.
DK uses S&P Global’s global long-term risk-management ratings for our risk rating.
- S&P has spent over 20 years perfecting their risk model
- which is based on over 30 major risk categories, over 130 sub categories, and 1,000 individual metrics
- 50% of metrics are industry specific
- this risk rating has been included in every credit rating for decades
The DK risk rating is based on the global percentile of how a company’s risk management compares to 8,000 S&P-rated companies covering 90% of the world’s market cap.
Long-Term Risk Management Is The 105th Best In The Master List (79 Percentile In The Master List)
| Classification | S&P LT Risk-Management Global Percentile |
Risk-Management Interpretation |
Risk-Management Rating |
| BTI, ILMN, SIEGY, SPGI, WM, CI, CSCO, WMB, SAP, CL | 100 | Exceptional (Top 80 companies in the world) | Very Low Risk |
| 5 Best Pre-Election High-Yield Blue-Chips | 86 |
Very Good |
Very Low Risk |
| Strong ESG Stocks | 86 |
Very Good |
Very Low Risk |
| Foreign Dividend Stocks | 77 |
Good, Bordering On Very Good |
Low Risk |
| Ultra SWANs | 74 | Good | Low Risk |
| Dividend Aristocrats | 67 | Above-Average | Low Risk |
| Low Volatility Stocks | 65 | Above-Average | Low Risk |
| Master List average | 61 | Above-Average | Low Risk |
| Dividend Kings | 60 | Above-Average | Low Risk |
| Hyper-Growth stocks | 59 | Average, Bordering On Above-Average | Medium Risk |
| Dividend Champions | 55 | Average | Medium Risk |
| Monthly Dividend Stocks | 41 | Average | Medium Risk |
(Source: DK Research Terminal)
Their risk-management consensus is in the top 21% of the world’s highest quality companies and similar to that of such other blue-chips as
- Lowe’s (LOW): Ultra SWAN dividend king
- BlackRock (BLK): Ultra SWAN
- 3M (MMM): Ultra SWAN dividend king
- Royal Bank of Canada (RY): Ultra SWAN
- Bank of Nova Scotia (BNS): Ultra SWAN
OK, so now that you know why these five high-yield aristocrats are perfect choices for whatever happens with the election, let’s look at why you might want to buy some or all of them today.
Wonderful Companies At Wonderful Prices
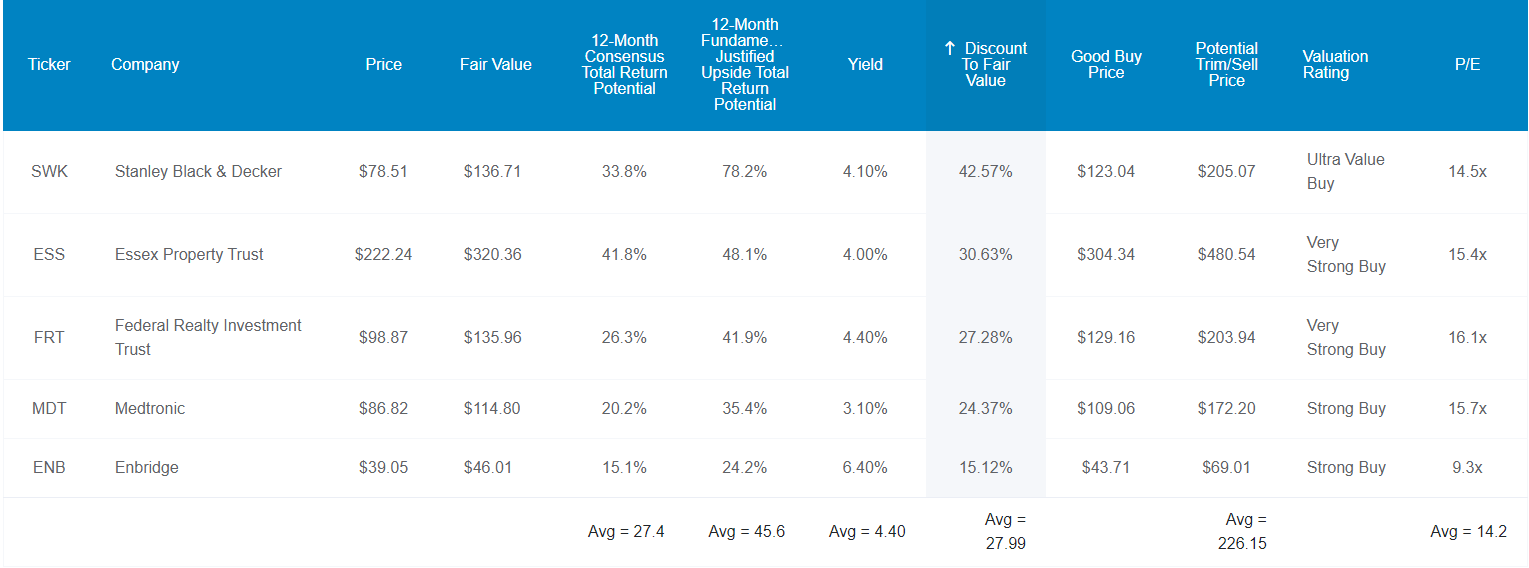
(Source: Dividend Kings Zen Research Terminal)
For context, the S&P 500 is trading at 16.7X forward earnings, a 1% historical discount, while the dividend aristocrats trade at 19.6X forward earnings, a 3% historical discount.
These high-yield aristocrats trade at 14.2X forward earnings/cash flow, a 28% historical discount.
Analysts expect them to deliver 27% total returns within the next 12 months but their 12-month fundamentally justified total return potential is 46%.
- if they all grow as expected and return to historical mid-range market-determined fair value within the next year you will make 46%.
But my goal isn’t to help you earn a 27% one year return, or 60% returns within two years, but life-changing long-term wealth.
How These High-Yield Aristocrats Can Help You Potentially Retire In Safety And Splendor
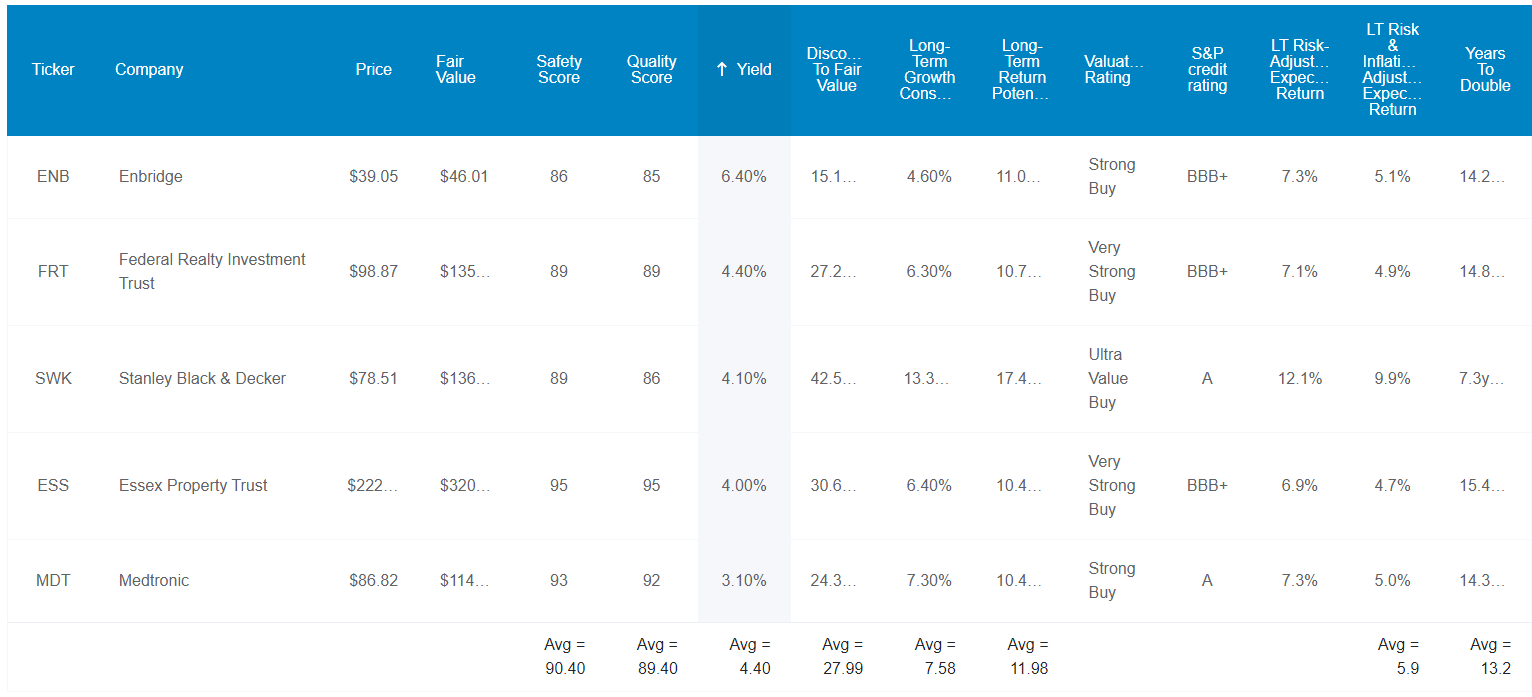
(Source: Dividend Kings Zen Research Terminal)
These five aristocrats don’t just offer one of the safest 4.4% yields on earth, they are also growing at 7.6% and offer 12% long-term return potential.
How impressive is that?
| Investment Strategy | Yield | LT Consensus Growth | LT Consensus Total Return Potential | Long-Term Risk-Adjusted Expected Return | Long-Term Inflation And Risk-Adjusted Expected Returns | Years To Double Your Inflation & Risk-Adjusted Wealth |
10-Year Inflation And Risk-Adjusted Expected Return |
| 5 Best Pre-Election High-Yield Aristocrats | 4.4% | 7.6% | 12.0% | 8.4% | 6.1% | 11.7 | 1.81 |
| Schwab US Dividend Equity ETF | 3.6% | 8.5% | 12.1% | 8.4% | 6.2% | 11.7 | 1.82 |
| Dividend Aristocrats | 2.6% | 8.5% | 11.1% | 7.8% | 5.5% | 13.1 | 1.71 |
| S&P 500 | 1.8% | 8.5% | 10.3% | 7.2% | 4.9% | 14.6 | 1.62 |
| Nasdaq | 0.8% | 11.5% | 12.3% | 8.6% | 6.3% | 11.4 | 1.85 |
(Sources: DK Research Terminal, FactSet, Ycharts, Morningstar)
It’s almost as good as the Nasdaq, and slightly better than the dividend aristocrats, but with a much higher starting yield.
Inflation-Adjusted Consensus Total Return Potential
| Time Frame (Years) | 8.0% CAGR Inflation-Adjusted S&P 500 Consensus | 8.8% Inflation-Adjusted Aristocrat Consensus | 9.7% CAGR Inflation-Adjusted 5 Best Pre-Election High-Yield Dividend Aristocrat Consensus | Difference Between Inflation-Adjusted 5 Best Pre-Election High-Yield Dividend Aristocrat Consensus And S&P Consensus |
| 5 | $1,468.65 | $1,526.66 | $1,590.84 | $122.19 |
| 10 | $2,156.93 | $2,330.70 | $2,530.78 | $373.85 |
| 15 | $3,167.77 | $3,558.19 | $4,026.06 | $858.30 |
| 20 | $4,652.33 | $5,432.16 | $6,404.83 | $1,752.50 |
| 25 | $6,832.64 | $8,293.08 | $10,189.07 | $3,356.43 |
| 30 (retirement time frame) | $10,034.74 | $12,660.73 | $16,209.19 | $6,174.45 |
| 35 | $14,737.50 | $19,328.67 | $25,786.25 | $11,048.75 |
| 40 | $21,644.21 | $29,508.37 | $41,021.84 | $19,377.64 |
| 45 | $31,787.72 | $45,049.33 | $65,259.25 | $33,471.53 |
| 50 | $46,684.97 | $68,775.14 | $103,817.12 | $57,132.15 |
| 55 | $68,563.78 | $104,996.45 | $165,156.57 | $96,592.79 |
| 60 (investing lifetime) | $100,696.06 | $160,294.18 | $262,737.92 | $162,041.86 |
| 100 (institutional time frame, multi-generational wealth) | $2,179,486.17 | $4,730,019.35 | $10,777,993.57 | $8,598,507.40 |
(Source: DK Research Terminal, FactSet)
Analysts think these high-yield aristocrats could deliver 30X returns over the next 30 years, or 16X adjusted for inflation.
Over an investing lifetime they have the potential for 263X inflation-adjusted returns.
| Time Frame (Years) | Ratio Inflation-Adjusted 5 Best Pre-Election High-Yield Dividend Aristocrat Consensus/Aristocrat Consensus | Ratio Inflation-Adjusted 5 Best Pre-Election High-Yield Dividend Aristocrat Consensus vs. S&P consensus |
| 5 | 1.04 | 1.08 |
| 10 | 1.09 | 1.17 |
| 15 | 1.13 | 1.27 |
| 20 | 1.18 | 1.38 |
| 25 | 1.23 | 1.49 |
| 30 | 1.28 | 1.62 |
| 35 | 1.33 | 1.75 |
| 40 | 1.39 | 1.90 |
| 45 | 1.45 | 2.05 |
| 50 | 1.51 | 2.22 |
| 55 | 1.57 | 2.41 |
| 60 | 1.64 | 2.61 |
| 100 | 2.28 | 4.95 |
(Source: DK Research Terminal, FactSet)
That’s far more than the dividend aristocrats or S&P 500 and with a very safe 4.4% yield on day one.
What evidence is there that these aristocrats can deliver anything close to 12% long-term returns?
Historical Returns Since 1994 (Annual Rebalancing)
The future doesn’t repeat, but it often rhymes. – Mark Twain
Remember, “past performance is no guarantee of future results.”
But, studies show that blue chips with relatively stable fundamentals offer predictable returns based on yield, growth, and valuation mean reversion over time.
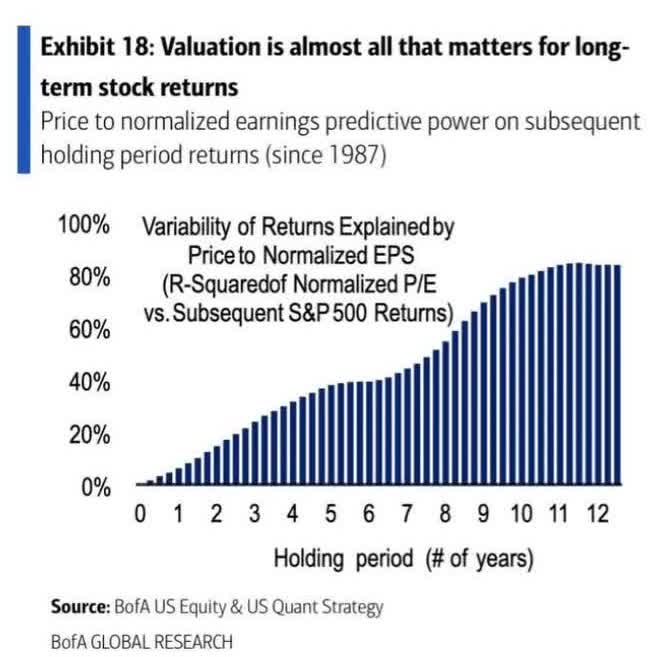
Bank of America
28 years is a time frame in which 95% of total returns are due to fundamentals, not luck.
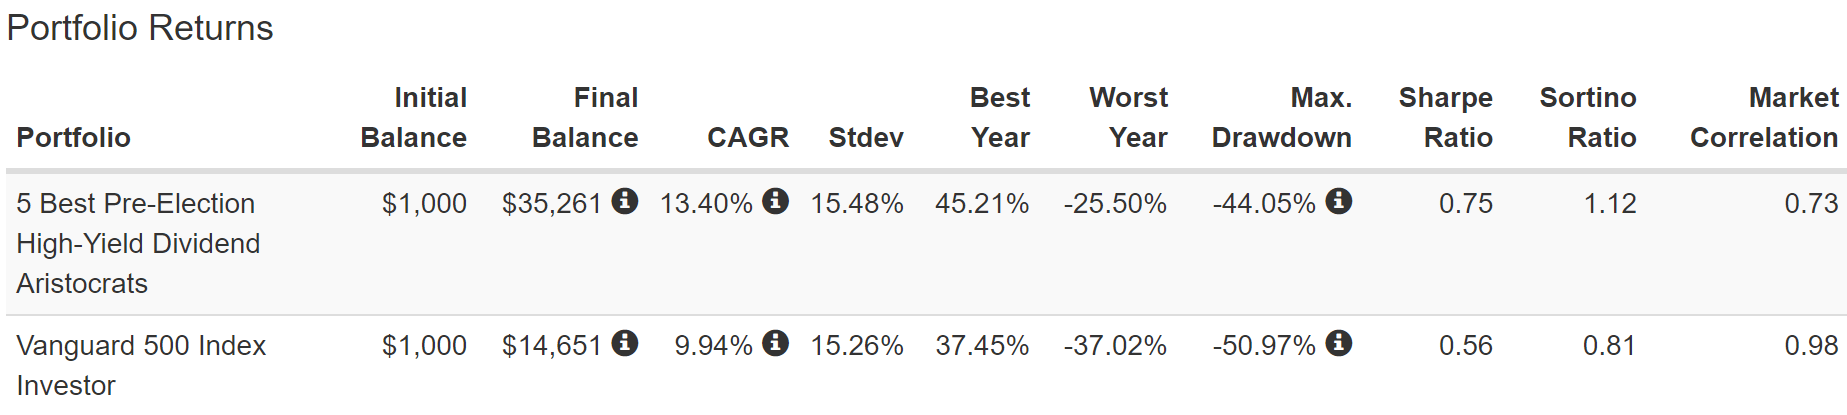
(Source: Portfolio Visualizer Premium)
Excellent 13.4% annual returns for 28 years, which resulted in 18X inflation-adjusted returns, 2.5X more than the S&P 500, similar to what analysts expect in the future.
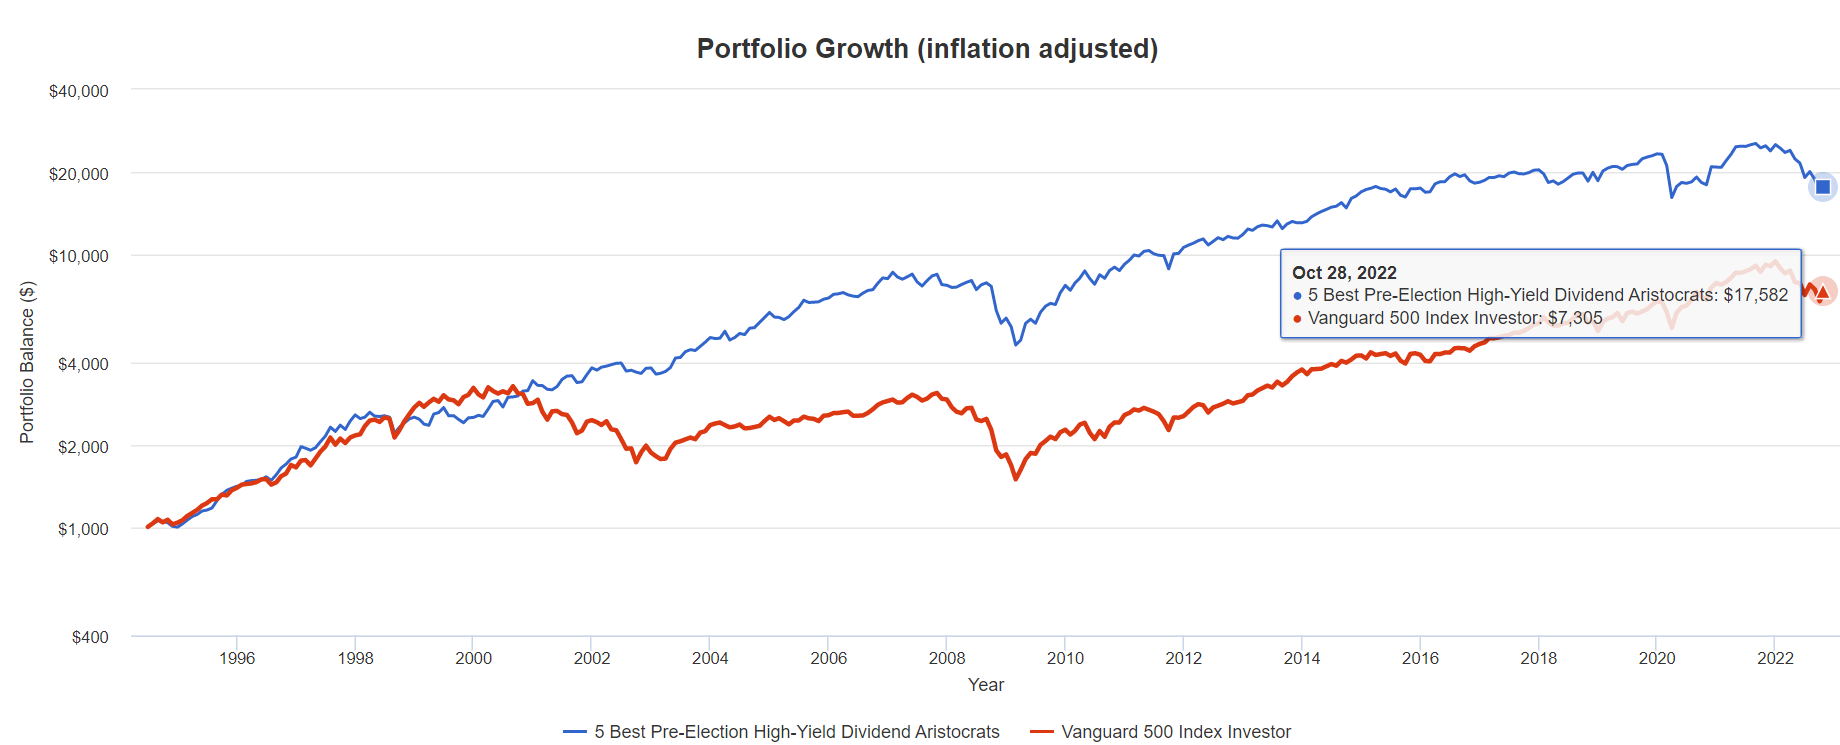
(Source: Portfolio Visualizer Premium)
But more importantly, take a look at the incredible dividend growth and dependability they’ve delivered over the last three decades.
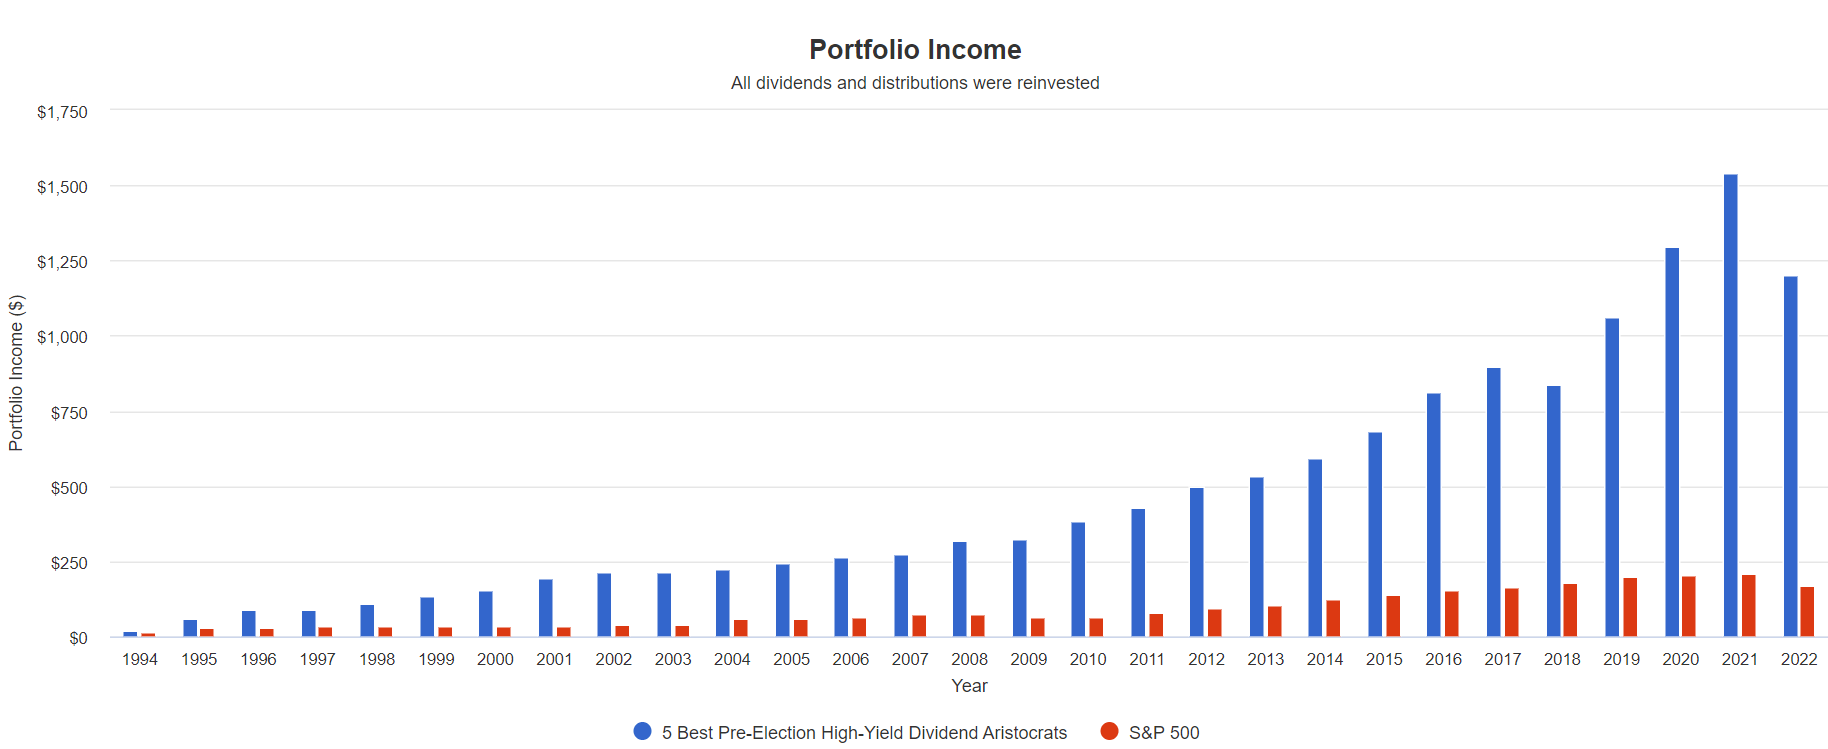
(Source: Portfolio Visualizer Premium)
Cumulative Dividends Since 1994 Per $1,000 Initial Investment
| Metric | S&P 500 | Best 5 Pre-Election High-Yield Dividend Aristocrats |
| Total Dividends | $2,686 | $14,115 |
| Total Inflation-Adjusted Dividends | $1,323.15 | $6,953.20 |
| Annualized Income Growth Rate | 8.0% | 14.5% |
| Total Income/Initial Investment % | 2.69 | 14.12 |
| Inflation-Adjusted Income/Initial Investment % | 1.32 | 6.95 |
| More Inflation-Adjusted Income Than S&P | NA | 5.26 |
| Starting Yield | 2.6% | 3.6% |
| Today’s Annual Dividend Return On Your Starting Investment (Yield On Cost) | 22.5% | 160.4% |
| 2022 Inflation-Adjusted Annual Dividend Return On Your Starting Investment (Inflation-Adjusted Yield On Cost) | 11.1% | 79.0% |
(Source: Portfolio Visualizer Premium)
These dividend aristocrats grew their dividends almost 2X faster than the S&P which over 28 years resulted in 5.3X more inflation-adjusted income.
It meant the 3.6% initial yield is now 79% inflation-adjusted yield on cost.
- every $1 invested in 1994 is now paying $0.79 per year in inflation-adjusted income
- and that’s still growing exponentially
How To Turn These 5 Dividend Aristocrats Into A Complete Sleep Well At Night Retirement Portfolio
Most investors wouldn’t feel comfortable with just five companies, not even five Ultra SWAN dividend aristocrats with A-credit ratings and 86th percentile risk management.
(Source: Portfolio Visualizer Premium)
Sleep well at night quality companies have nothing to do with volatility and SWAN status doesn’t mean “can’t fall a lot in a bear market”.
(Source: Portfolio Visualizer Premium)
In this bear market their peak decline is28%, just like the S&P 500.
But take a look at what happens if we turn these five high-yield aristocrats into a ZEUS portfolio.
- ZEUS = Zen Extraordinary Ultra SWAN
The basic setup of the ZEUS strategy is:
- 33% core ETFs
- 33% hedges
- 33% individual blue-chips
In this case our ZEUS High-Yield Aristocrat portfolio looks like this:
- 33.3% SCHD or VYM (gold standard high-yield blue-chip ETFs)
- 16.67% EDV or TLT (long duration US treasuries)
- 16.67% managed futures (DBMF, GIFMX, PQTAX, or AMFAX)
- 33.3% 5 Pre-Election High-Yield Aristocrats (6.67% each)
| Metric | 60/40 | ZEUS High-Yield Aristocrat | X Better Than 60/40 |
| Yield | 2.3% | 5.0% | 2.15 |
| Growth Consensus | 5.1% | 5.4% | 1.06 |
| LT Consensus Total Return Potential | 7.4% | 10.4% | 1.40 |
| Risk-Adjusted Expected Return | 5.2% | 7.3% | 1.40 |
| Safe Withdrawal Rate (Risk And Inflation-Adjusted Expected Returns) | 2.9% | 5.0% | 1.71 |
| Conservative Time To Double (Years) | 24.6 | 14.4 | 1.71 |
(Source: DK Research Terminal, FactSet)
This ZEUS portfolio has more than 2X the yield of a 60/40 and is expected to deliver 3% higher annual returns, with a 5% safe withdrawal rate that’s almost 2X higher than a 60/40’s.
Inflation-Adjusted Consensus Total Return Potential: $510,000 Average Retired Couple (Age 65) Savings Initial Investment
| Time Frame (Years) | 5.1% CAGR Inflation-Adjusted 60/40 | 8.1% Inflation-Adjusted ZEUS High-Yield Aristocrat Consensus | Difference Between ZEUS High-Yield Aristocrat Consensus and 60/40 Consensus |
| 5 | $654,320.24 | $753,878.21 | $99,557.97 |
| 10 | $839,480.35 | $1,114,377.17 | $274,896.82 |
| 15 | $1,077,037.23 | $1,647,264.05 | $570,226.82 |
| 20 | $1,381,818.17 | $2,434,973.48 | $1,053,155.32 |
| 25 | $1,772,846.27 | $3,599,359.71 | $1,826,513.44 |
| 30 | $2,274,527.85 | $5,320,546.78 | $3,046,018.93 |
(Source: DK Research Terminal, FactSet)
Over a 30-year retirement that 3% higher annual return could mean $3 million in additional inflation-adjusted wealth for the average retired couple.
| Time Frame (Years) |
Ratio ZEUS High-Yield Aristocrat Consensus Vs 60/40 Consensus |
| 5 | 1.15 |
| 10 | 1.33 |
| 15 | 1.53 |
| 20 | 1.76 |
| 25 | 2.03 |
| 30 | 2.34 |
(Source: DK Research Terminal, FactSet)
That’s potentially 134% higher returns than a 60/40.
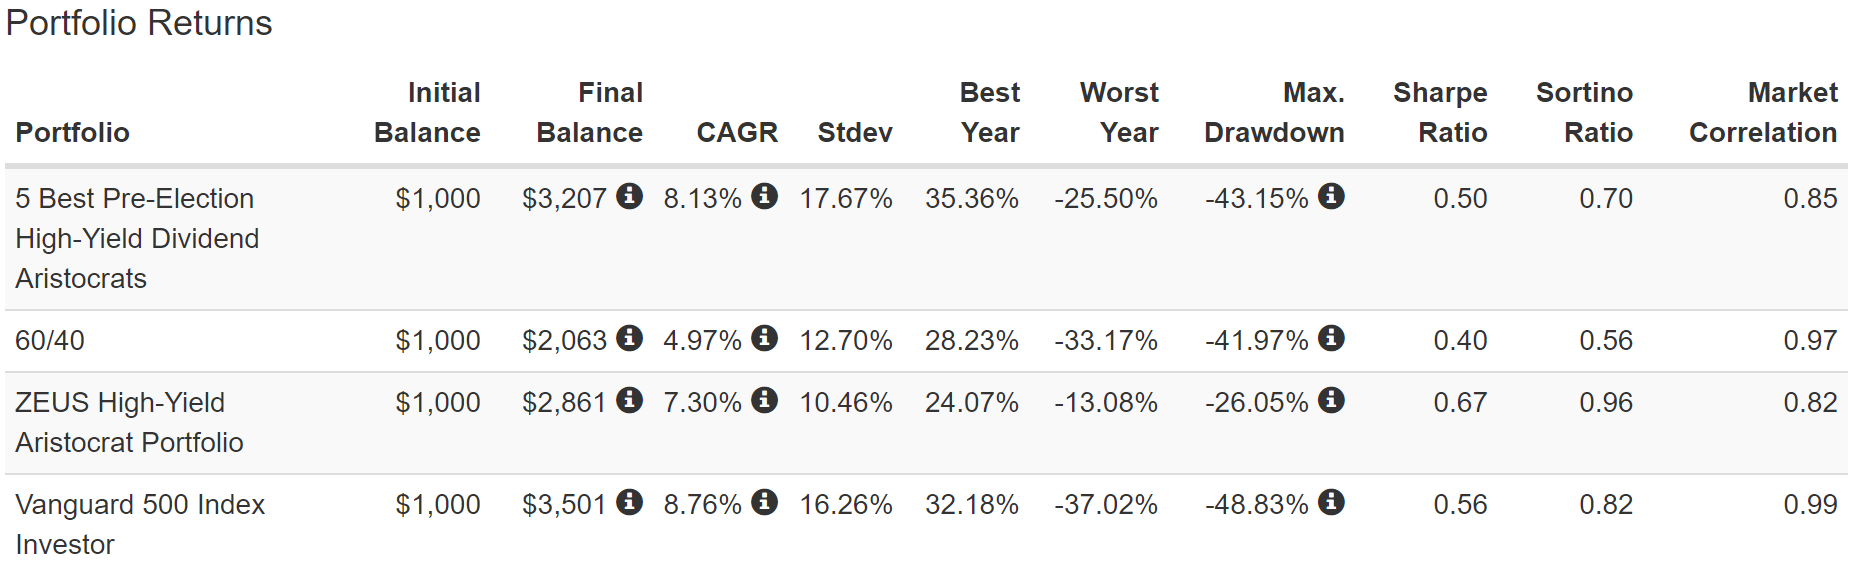
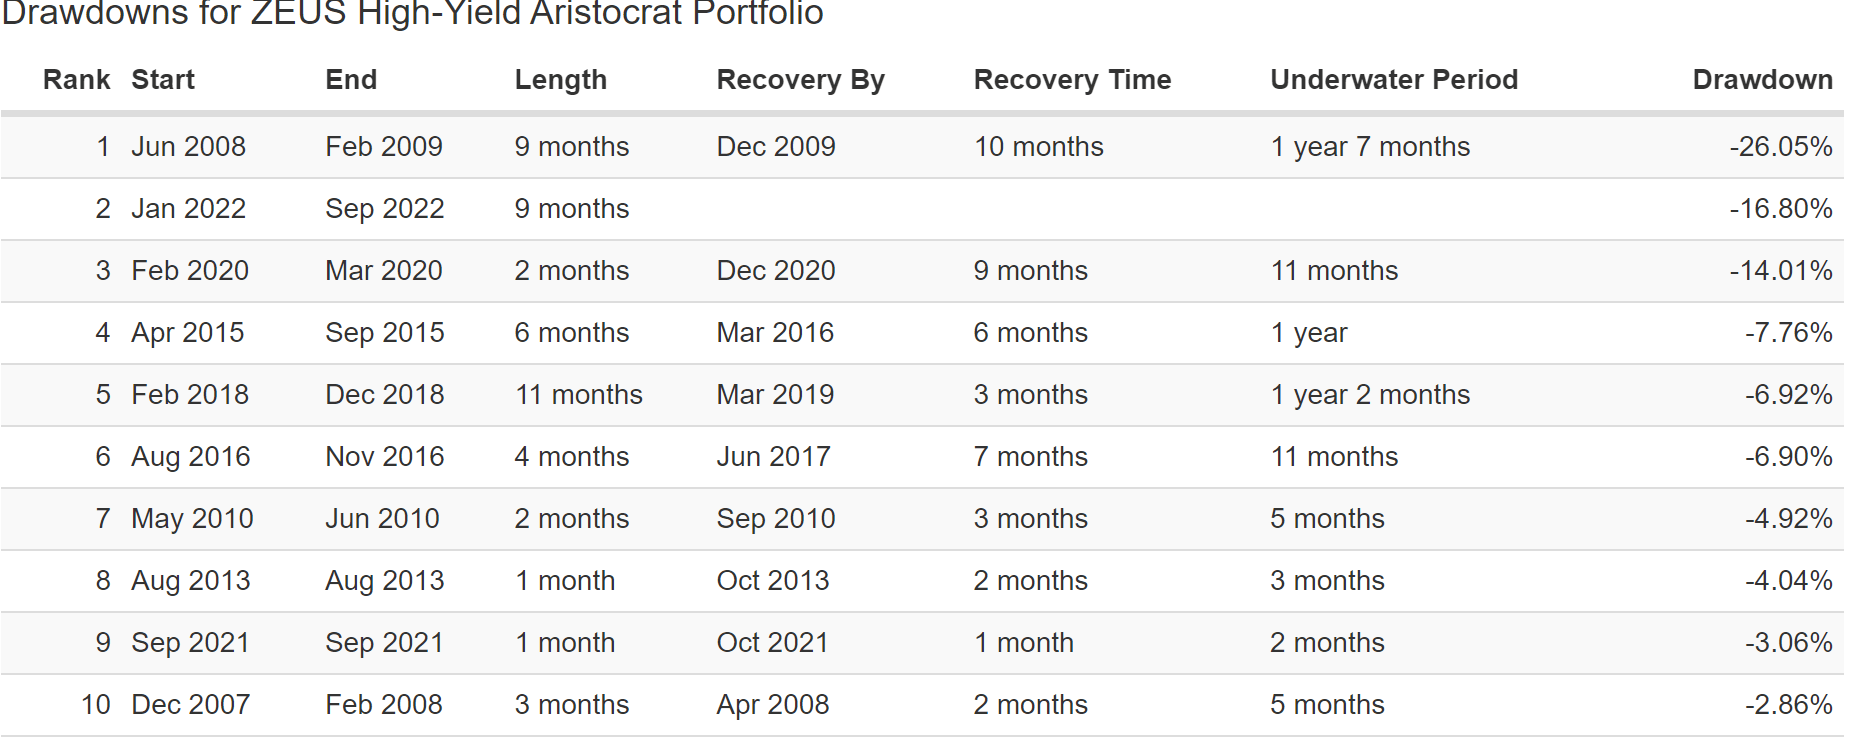
Historical Returns Since December 2007
(Source: Portfolio Visualizer Premium)
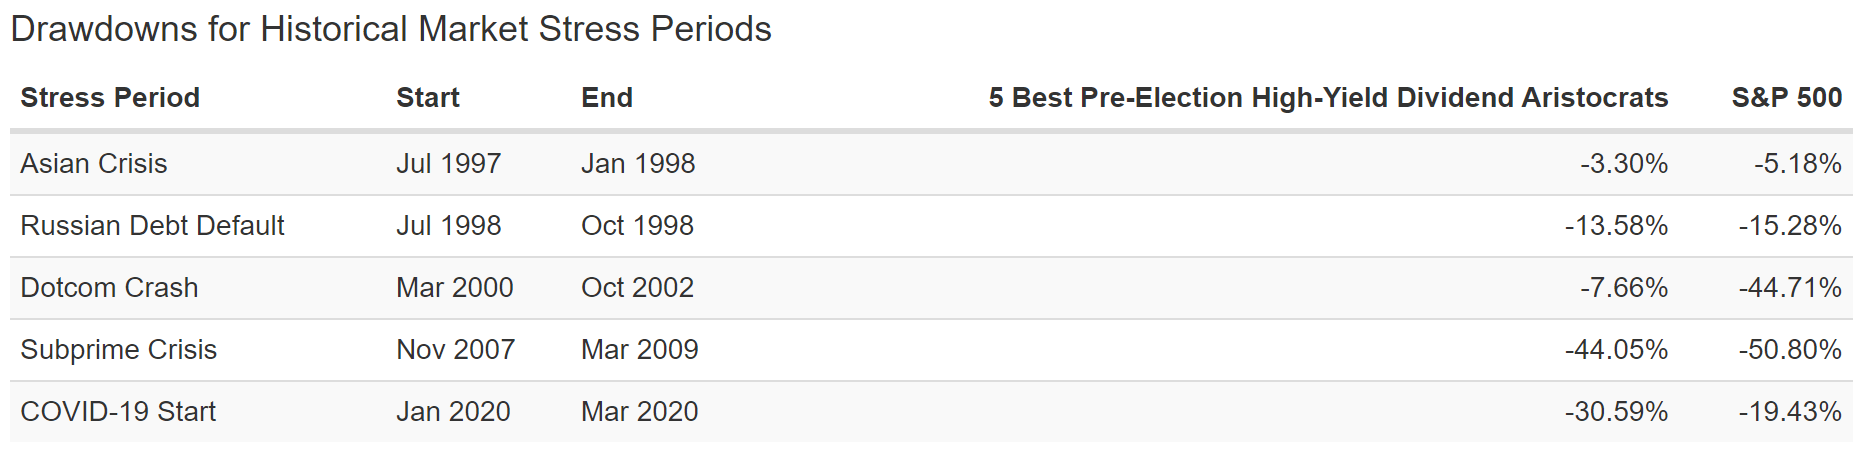
Superior long-term returns to a 60/40 and with much lower annual volatility, that’s almost 40% lower than the S&P 500.
- peak decline in the Great Recession half that of the S&P 500
(Source: Portfolio Visualizer Premium)
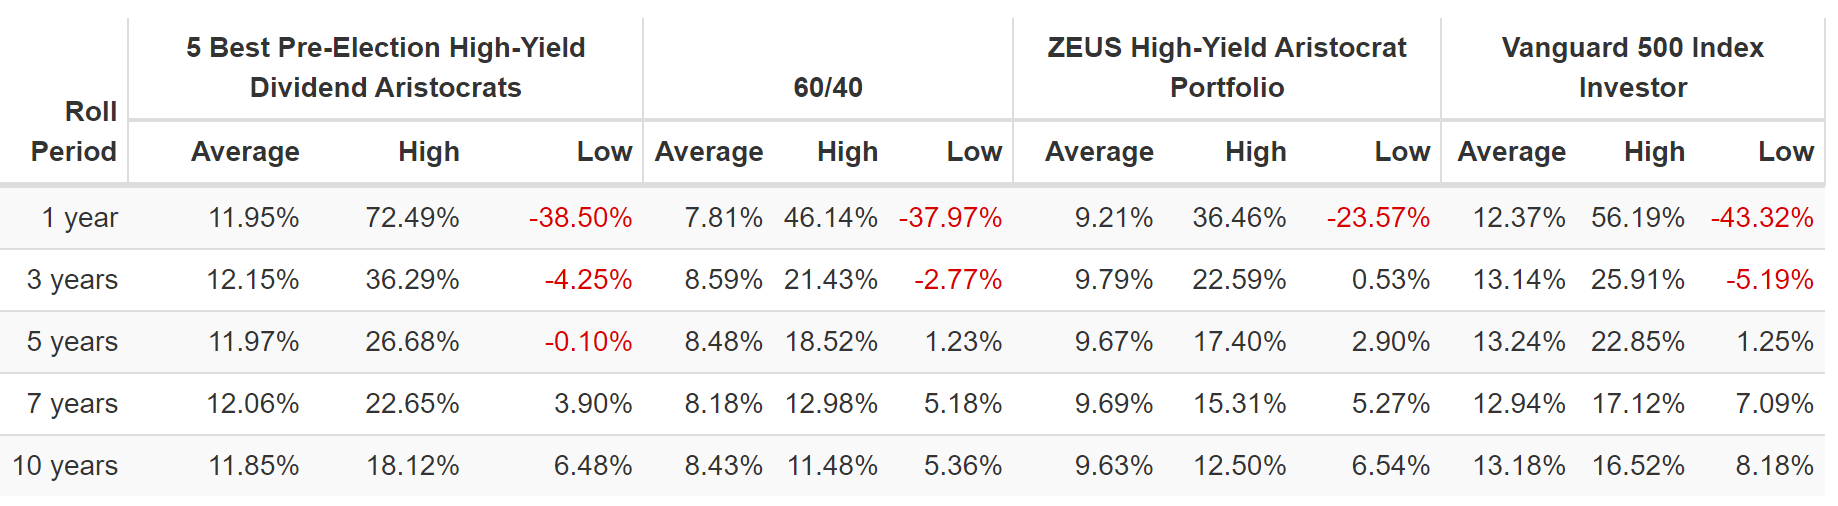
Average long-term rolling returns 9.6% similar to what analysts expect in the future.
(Source: Portfolio Visualizer Premium)
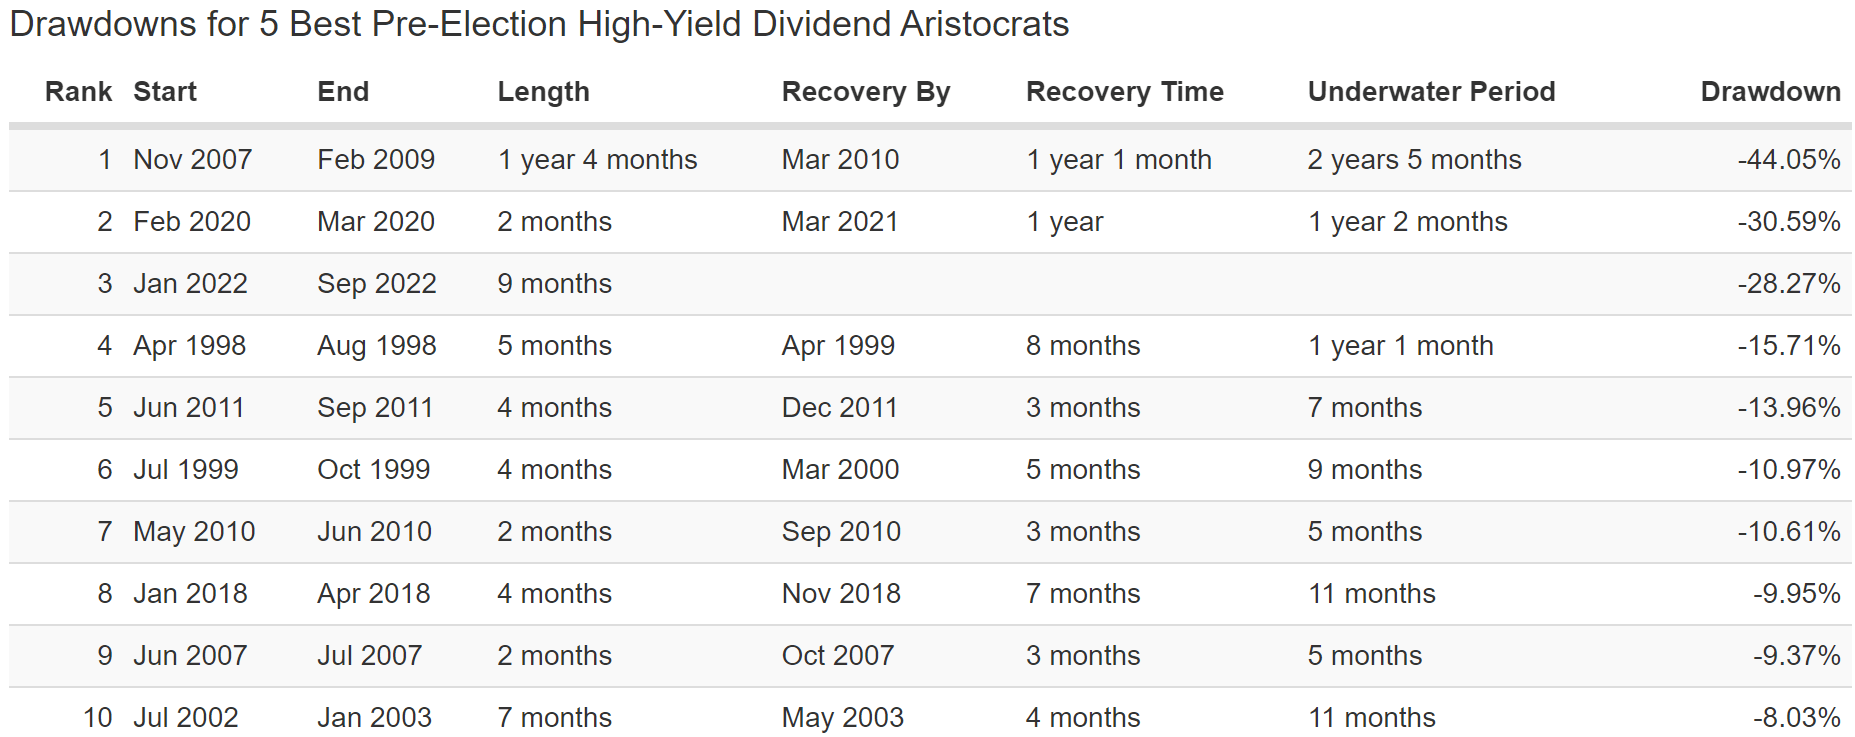
Just three corrections in 14 years, and just one bear market. And that required the 2nd largest market crash in US history.
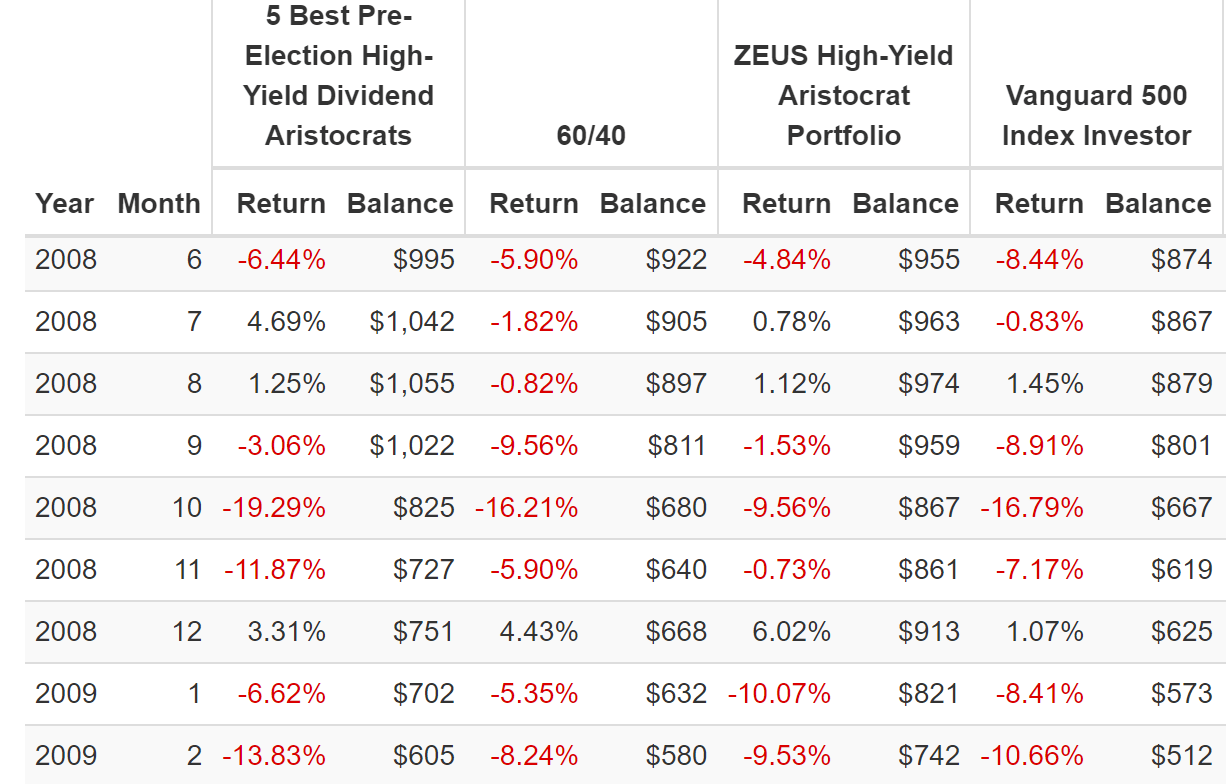
ZEUS In Great Recession: Peak Decline 26% (54% Less Than S&P)
(Source: Portfolio Visualizer Premium)
In October 2008 the S&P fell 17% in a single month, and a 60/40 fell 16%. The high-yield aristocrats fell 19% and ZEUS fell about 50% less than the market.
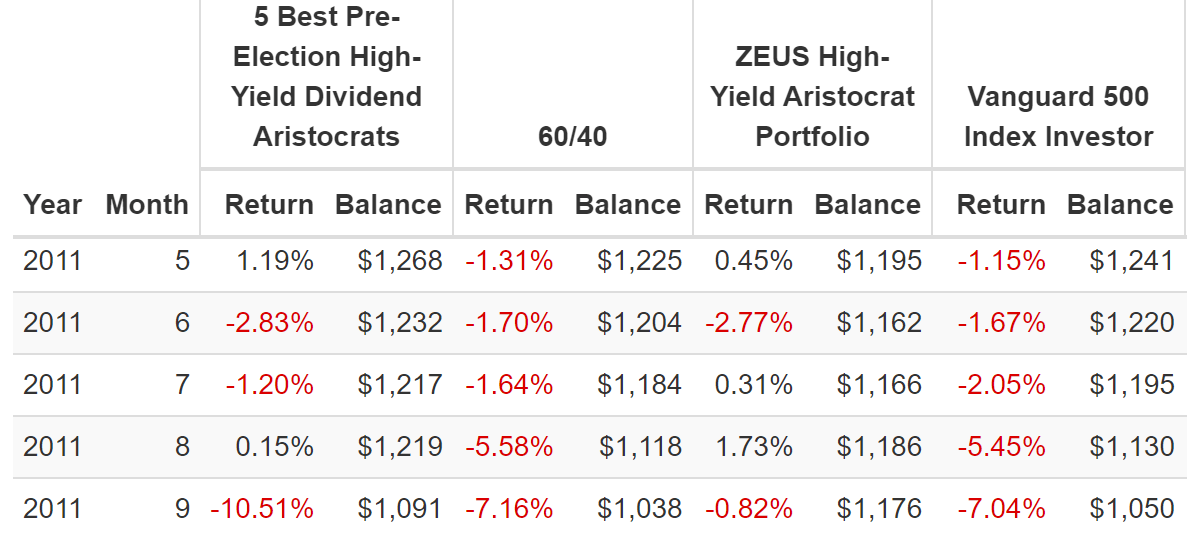
ZEUS In 2011 Bear Market: Peak Decline 1% (95% Less Than S&P)
(Source: Portfolio Visualizer Premium)
In 2011 the S&P hit -22% intraday and fell for give consecutive months of accelerating losses.
ZEUS fell just 1.2% in this bear market.
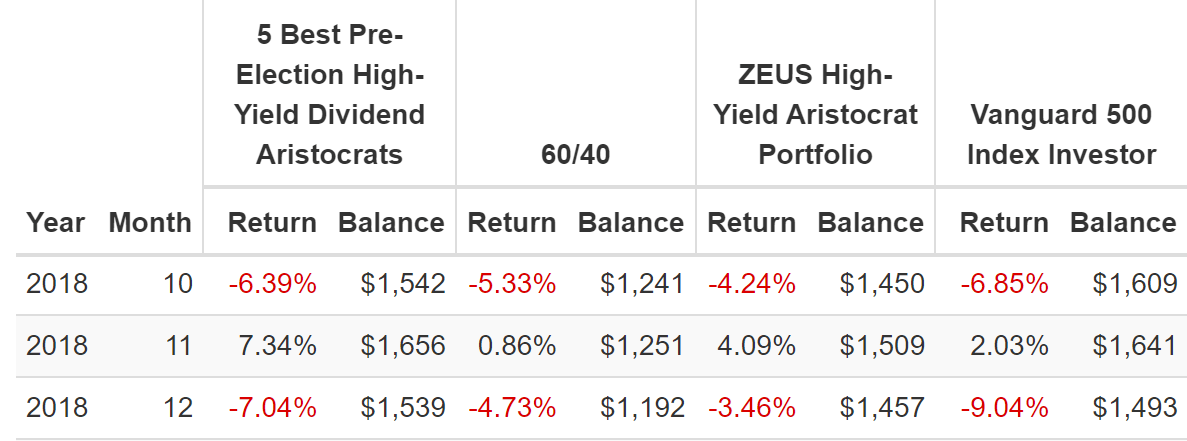
ZEUS In 2018 Bear Market: Peak Decline 4% (81% Less Than S&P)
(Source: Portfolio Visualizer Premium)
December 24th, 2018, the S&P hits -21% intraday, and fell 9% in December, while ZEUS fell 1/3rd as much as December and just 4% overall.
ZEUS In Pandemic: Peak Decline 14% (59% Less Than S&P)
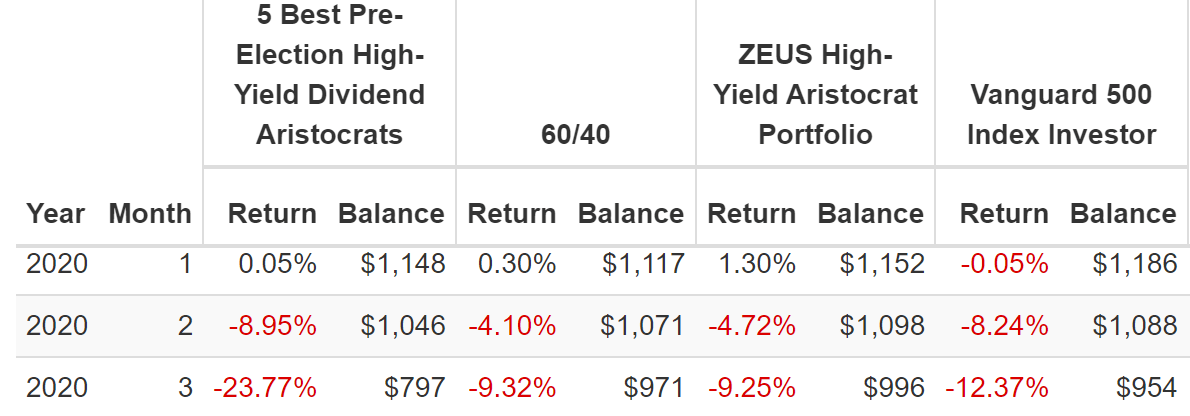
(Source: Portfolio Visualizer Premium)
These five high-yield aristocrats, mostly the two REITs, fell 24% in March 2020. The S&P plunged 12% and ZEUS fell a lot less.
All told, ZEUS’s peak decline was 14% in the Pandemic crash while the S&P plunged 34%.
ZEUS In 2022 Bear Market: Peak Decline 16% (42% Less Than S&P)
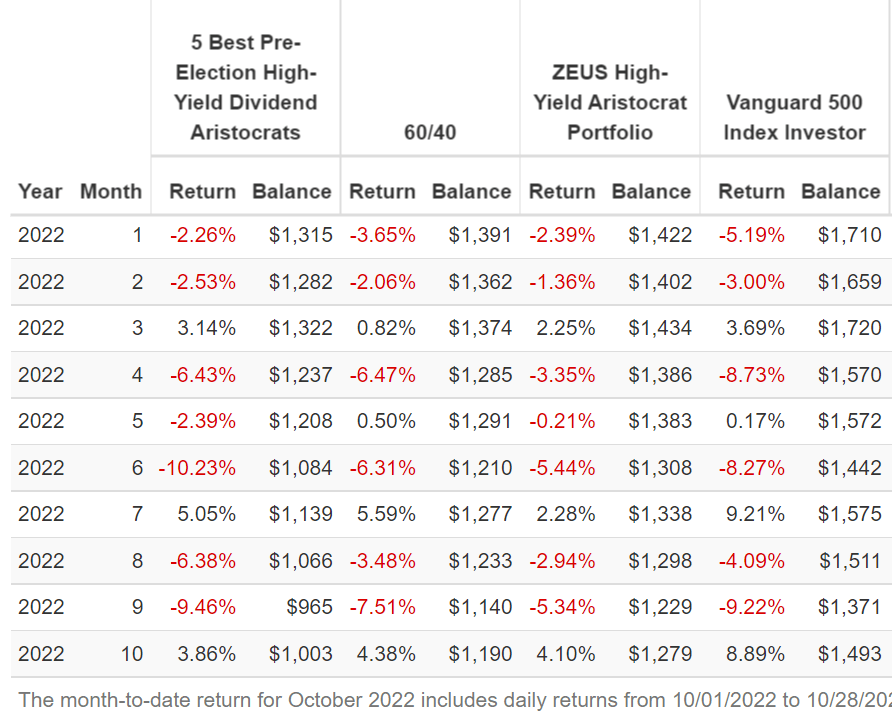
(Source: Portfolio Visualizer Premium)
In the 2022 bear market the S&P has fallen 9% in a single month twice, and 8% once.
ZEUS has done an admirable job falling a lot less than the market, the high-yield aristocrats, or a 60/40.
This is the power of a diversified and prudently risk-managed portfolio. This is the power of ZEUS.
- high yield
- stronger returns
- much lower volatility
- much smaller peak declines in severe market crashes
Bottom Line: No Matter Who Wins The Election These Are 5 High-Yield Dividend Aristocrats You Can Trust
Most likely the GOP will take the house, and the Senate is a toss up. But either way there is an 81% chance that we end up with divided government which the stock market tends to love.
- gridlock = no major changes and corporations have an easier time planning and making long-term investment plans
The historical November post election rally might be partially priced in already, but it’s possible that the combination of technical factors, the post-election bump, and Santa Clause rally drives stocks up a bit more into the rest of the year.
Next year’s recession won’t be affected by the election results, and thus we’re likely to see a painful Q1 (potentially bottoming in March according to RBC and Morgan Stanley).
But only traders should care about short-term market swings, long-term investors should not.
If your goal is to make a quick 10% or 20% (and pay top margin income tax rates on those short-term gains) I can’t help you.
If your goal is to retire in safety and splendor with the world’s best blue-chips then ENB, FRT, SWK, ESS, and MDT are five of the best high-yield aristocrats you can safely buy ahead of the election.
- 4.4% very safe yield
- A-credit rating
- 42-year dividend growth streak
- 86th percentile long-term risk management
- 7.6% long-term growth rate
- 12.0% CAGR long-term return potential (similar to what they’ve delivered over the last 26 years)
If you want to make 60% in two years, these aristocrats can do that. More importantly they have the potential to deliver 30X returns over 30 years.
Let the traders obsess over every stock market bounce and dip. Rich retirements aren’t built on trading, but long-term blue-chip investing.
Retiring in safety and splendor isn’t a matter of avoiding a single painful day, week, or month in the stock market. It’s about buying the world’s best companies, with great risk-management and balance sheets, that can adapt to anything.
I try to invest in businesses that are so wonderful that an idiot can run them. Because sooner or later, one will.” – Warren Buffett
If your portfolio’s investment thesis can be blown up by an election result, you’re not an investor, you’re a speculator.
If your portfolio is a bunker that can withstand anything, including the two worst economic catastrophes in 75 years? Well my friends, then it doesn’t matter who wins what election because retiring rich is just a matter of time, patience, and watching your dividends roll in.
Be the first to comment