

Khaosai Wongnatthakan
This calendar anomaly has generated a good fraction of the profits in US major market indexes: Buy at the close of the month and sell at the close after three trading days.
Below is a backtest in the SPY ETF (SPY) from inception to November 1, 2022.
Backtest Results of a Calendar Anomaly in SPY ETF (Price Action Lab Blog – Norgate Data)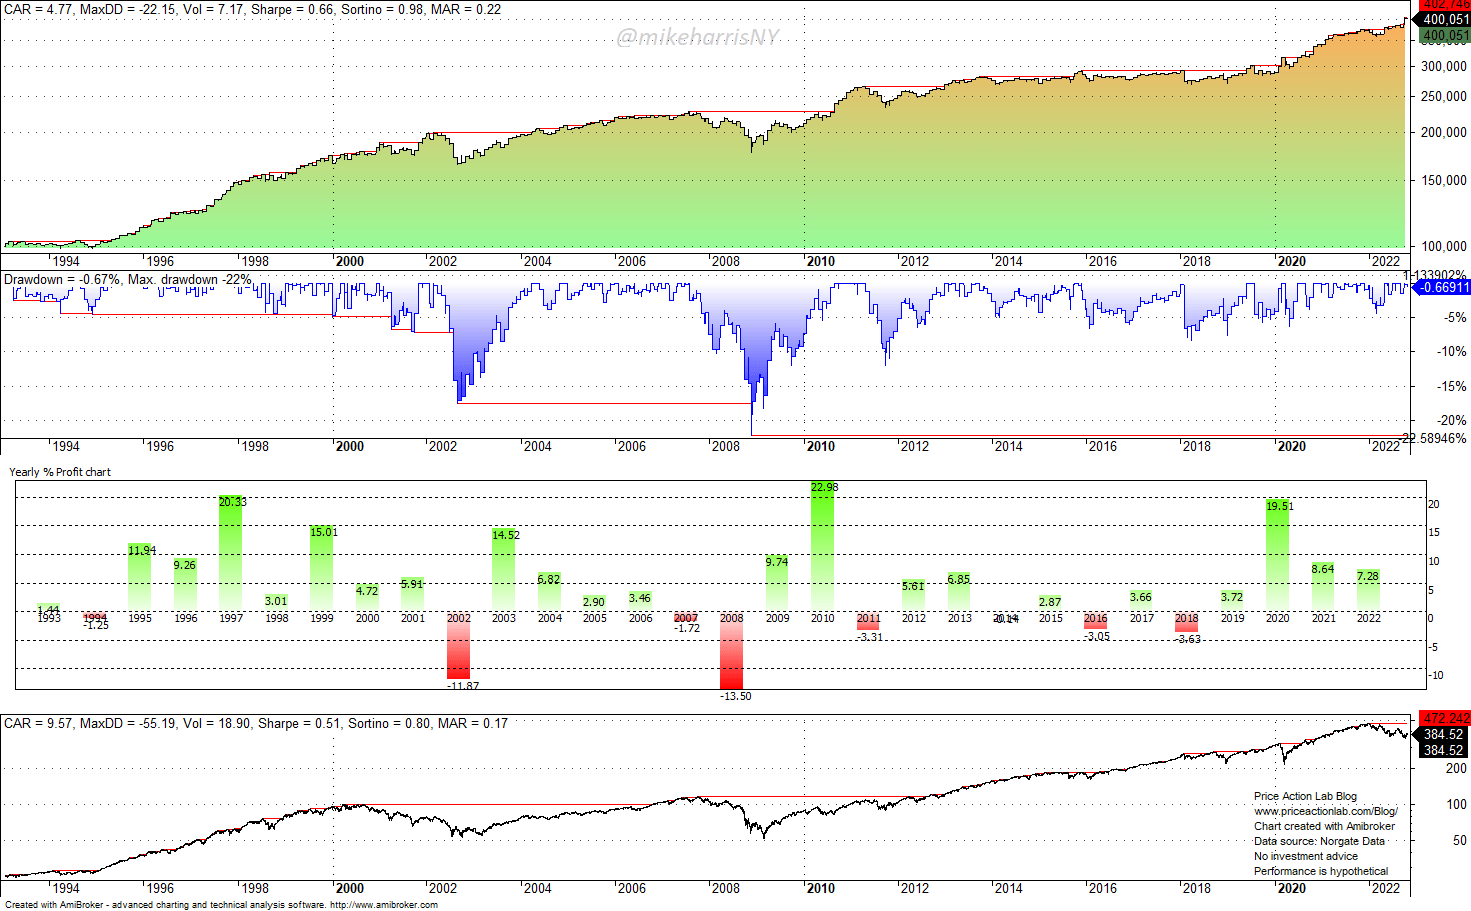
The top chart shows the equity line of this calendar anomaly on a log scale.
The second chart shows the drawdown profile of the calendar anomaly.
The third chart shows the yearly returns. Year-to-date, buying at the close of a month and selling after 3 trading days at the close has generated a 7.3% gain before commissions.
The last chart shows the SPY ETF daily prices since inception on a log scale.
Performance comparison table
| Parameter | Calendar Anomaly | Buy and Hold |
| Annualized return | 4.8% | 9.6% |
| Maximum Drawdown | -22.2% | -55.2% |
| Sharpe ratio | 0.66 | 0.51 |
| Volatility | 7.2% | 18.9% |
| 2008 Return | -13.5% | -36.8% |
| 2022 Return (YTD) | 7.3% | -18.1% |
The above results suggest that holding the SPY ETF only for the first three days of the month with 2x leverage has generated the same annualized return as buying and holding but at a lower maximum drawdown and higher Sharpe ratio.
Essentially, then, the above table suggests that with 2x leverage, only the first three days of each month have determined the performance of the SPY ETF.
Some well-known quants have suggested that data before 2000 (the top of the dot-com crash) skews backtest results significantly due to the strong uptrend of the 90s. For this reason, we will test the performance of the calendar anomaly with data starting in 2000 for the following ETFs: SPY, QQQ (QQQ), and IWM (IWM). Below is a table of the results for each ETF and a comparison between buy and hold.
SPY ETF
| Parameter | Calendar Anomaly | Buy and Hold |
| Annualized return | 3.9% | 6.3% |
| Maximum Drawdown | -22.2% | -55.2% |
| Sharpe ratio | 0.53 | 0.32 |
| Volatility | 7.5% | 19.8% |
| 2008 Return | -13.5% | -36.8% |
| 2022 Return (YTD) | 7.3% | -18.1% |
In this case, with a backtest starting in 2020, the 3-day leveraged performance is much higher than the buy-and-hold performance, about 8% versus 6.3% in the annualized return. Year-to-date, the anomaly is up 7.3% versus a loss of 18.1% for buying and holding.
QQQ ETF
| Parameter | Calendar Anomaly | Buy and Hold |
| Annualized return | 4.5% | 5.5% |
| Maximum Drawdown | -29.3% | -82.9% |
| Sharpe ratio | 0.40 | 0.20 |
| Volatility | 11.4% | 27.6% |
| 2008 Return | -17.6% | -41.7% |
| 2022 Return (YTD) | 4.2% | -30.5% |
In the QQQ case, the effect of this calendar anomaly has been even more pronounced since 2000: about 80% of the annualized return of 5.5% has been generated in the first 3 days of each month. Year-to-date, the return is 4.2% for the anomaly versus -30.5% for buying and holding. The leveraged performance of the calendar anomaly is higher by a factor of about 1.6 as compared to buying and holding, and at about half the maximum drawdown. This is a significant result.
IWM ETF
| Parameter | Calendar Anomaly | Buy and Hold |
| Annualized return | 3.0% | 7.7% |
| Maximum Drawdown | -32.0% | -58.6% |
| Sharpe ratio | 0.32 | 0.24 |
| Volatility | 9.4% | 24.3% |
| 2008 Return | -21.3% | -34.1% |
| 2022 Return (YTD) | 5.2% | -18.1% |
The performance of the calendar anomaly has been lower in the IWM ETF, but it is still significant. About 39% of the annualized return has been generated in the first three days of the month. Year-to-date, the return for the anomaly is 5.2% versus a loss of 18.1% for buy and hold.
Comments and conclusion
This calendar anomaly could be the result of portfolio rebalancing by large funds, especially passive index funds, at the end of every month. Causes are hard to prove in financial markets, and other confounding factors may exist.
The conclusion is that, based on the historical analysis, so far, the first three days of a month have had a decisive impact on the performance of equity indexes. A leveraged investor could have invested in the first three days of each month and then stayed out of the market for an average exposure of about 14%, which minimizes market risk while allowing the deployment of capital to other investments and strategies.
Caveat emptor: calendar anomalies tend to fade and can disappear suddenly. In this particular case, there may be fundamental reasons for the manifestation of this anomaly, but there are no guarantees it will work well in the future.
Be the first to comment