

designer491/iStock via Getty Images
It has been two decades since I owned any ordinary plain vanilla U.S. Treasuries. The last time I bought Treasuries the Nasdaq 100 was approaching its top and I saw a big tumble coming. One Friday night the late Sir John Templeton recommended them on Wall Street Week. It struck me instantly that they were the solution. The opportunity was greater then and more certain, but there were several similarities to the present. I had built up a ton of cash and didn’t want anything to do with stocks. The thing that made it hard then was the fact that the Treasury yield had fallen persistently since 1982. A 6.5% yield didn’t look so great in comparison to the past. The bond bull market had started when 15% was available on the 10-Year Bond. In 2000, however, 6.5% was fine. It would pull ground on everything and everyone else. The following Monday I went all in with the 10-Year.
The situation is similar today but different enough that I haven’t yet gone all in. I have had something of the same hesitancy I had in 2000 because rates today are only around 3%. I’m also not as keen on the 10-Year as I was in 2000 because ten years is a long time given the number of variables in play right now. You can get about the same yield on the 2-Year anyway. You should look at that 3%ish yield on short Treasuries (2 years and less) as a way to improve your return on cash without sacrificing a lot of flexibility. You have to remember that the long term path of yields may have turned up. I thought that at the time of the all time low around zero in March 2020 and wrote about it at the time in this article. I continue to think that the .54 yield on the 10-Year on March 9, 2020, marked the top for Treasuries and the low for Treasury yields in my lifetime. The long bond rally from 1982 probably ended on that day.
Short Treasuries now are likely in a countertrend move which will look like a blip after a few decades. That’s in fact a reason to keep maturities short and maintain some reserves in case Fed actions resume driving bonds down and yields up. My thinking is that between now and the resumption of a long term upward trend in yields there will likely be a recession which will pull yields down and keep them down for a while. Short term Treasuries are the solution for the uncertainty, providing a good place to put cash while a recession is pulling rates down. If you have been holding a large cash position as I have they represent a material improvement in the overall return of your portfolio. This first occurred to me a couple of weeks ago and I thought about it for a few days, shaped a strategy, and executed.
A better rate was available for a few days before I acted but I didn’t let that stop me. It was necessary to see the top on June 14. The loss of a few basis points hasn’t made it a bad deal. You may be concerned about not buying with yields at that top tick, but it’s not too late. I never managed to buy at the absolute bottom. The thing to remember is that your goal is to get your total portfolio return up without any risk and with maximum flexibility. It works fine with the good-enough current yield. At the same time keep in the back of your mind the likelihood that for the next few decades the probability is that yields slowly rise and bonds slowly fall. So why buy Treasuries now?
Playing The Odds
Over the long term the yield on Treasuries of all maturities will likely go up. If that doesn’t happen it will be very bad news for the economy over a very long period. Over the short term, the direction of movement in Treasury yields is less certain. The odds are probably about 50-50 that bonds rally and yields fall from here. What do you do when the odds are 50-50? You align yourself with the odds and go 50-50 yourself.
You probably think that 50-50 is a casual number I just pulled out of the air, and to an extent it is. Actually it’s a way of looking at binary outcomes when you have no privileged information. The assumption is that the present price is where it ought to be, which we all know as a market theory which isn’t true. But assume it is the best model you have. In this particular case, the odds of an actual capital loss is nil. The Treasury will pay you what it has promised.. The risk is “opportunity cost” if it turns out you would have done better to wait. The solution is balancing immediate yield against opportunity cost and adjusting your 50-50 odds as new information becomes available. If you are even slightly statistical I strongly recommend taking a look at Kelly Criterion betting. You can google John L. Kelly Jr. or go to the library and read pp. 63 and following in Fortune’s Formula by William Poundstone. Investing half an hour of reading will provide a new tool in thinking about investment decisions.
The odds for a recession started increasing in late March, and accelerated at the beginning of June. On June 14 the 10-year yield reached 3.49%. Then a funny thing happened. Just as it looked like the bond market was about to collapse and yields would take off rates started to fall across the yield curve. That’s what rates do when the probability of recession begins to increase. The quick turnaround in yields got my attention. About the same time analysts at various money managers started to adjust their recession probabilities to 30%, 40%, or 50%, and in a few cases 100%.
Everybody now recognizes that the Federal Reserve is caught in a dilemma. They may successfully choke off inflation by raising rates and manage to avoid a recession, but the odds are not in their favor. They can fight inflation relentlessly or they can tiptoe and whisper about what they are doing and hope that consumers, workers, and the stock market don’t notice. They seem to be tilting toward an all-in war on inflation at the moment. If this policy continues, the yield curve will continue to flatten and yields at all maturities will continue to decline. Keep an eye on that possibility as a major indicator of a recession on the way. Here’s a table of the historical Treasury yield curve as of June 23, 2022:
| Date | 3 Mo | 6 Mo | 1 Yr | 2 Yr | 3 Yr | 5 Yr | 7 Yr | 10 Yr | 20 Yr | 30 Yr |
|---|---|---|---|---|---|---|---|---|---|---|
| 06/01/2022 | 1.15 | 1.63 | 2.16 | 2.66 | 2.84 | 2.94 | 2.98 | 2.94 | 3.31 | 3.09 |
| 06/02/2022 | 1.17 | 1.64 | 2.15 | 2.65 | 2.83 | 2.92 | 2.95 | 2.92 | 3.30 | 3.09 |
| 06/03/2022 | 1.21 | 1.68 | 2.18 | 2.66 | 2.87 | 2.95 | 2.99 | 2.96 | 3.33 | 3.11 |
| 06/06/2022 | 1.26 | 1.74 | 2.23 | 2.73 | 2.94 | 3.03 | 3.07 | 3.04 | 3.41 | 3.19 |
| 06/07/2022 | 1.26 | 1.75 | 2.26 | 2.75 | 2.91 | 2.99 | 3.02 | 2.98 | 3.35 | 3.13 |
| 06/08/2022 | 1.28 | 1.77 | 2.29 | 2.78 | 2.94 | 3.03 | 3.06 | 3.03 | 3.40 | 3.18 |
| 06/09/2022 | 1.30 | 1.81 | 2.35 | 2.83 | 2.99 | 3.07 | 3.08 | 3.04 | 3.40 | 3.18 |
| 06/10/2022 | 1.39 | 1.98 | 2.58 | 3.06 | 3.21 | 3.25 | 3.24 | 3.15 | 3.45 | 3.20 |
| 06/13/2022 | 1.73 | 2.25 | 2.89 | 3.40 | 3.56 | 3.56 | 3.53 | 3.43 | 3.68 | 3.42 |
| 06/14/2022 | 1.83 | 2.43 | 3.15 | 3.45 | 3.60 | 3.61 | 3.60 | 3.49 | 3.72 | 3.45 |
| 06/15/2022 | 1.74 | 2.32 | 2.93 | 3.20 | 3.35 | 3.38 | 3.39 | 3.33 | 3.64 | 3.39 |
| 06/16/2022 | 1.59 | 2.24 | 2.88 | 3.14 | 3.33 | 3.35 | 3.36 | 3.28 | 3.59 | 3.35 |
| 06/17/2022 | 1.63 | 2.25 | 2.86 | 3.17 | 3.35 | 3.34 | 3.34 | 3.25 | 3.55 | 3.30 |
| 06/21/2022 | 1.70 | 2.46 | 2.92 | 3.21 | 3.35 | 3.38 | 3.39 | 3.31 | 3.63 | 3.39 |
| 06/22/2022 | 1.61 | 2.40 | 2.79 | 3.06 | 3.20 | 3.22 | 3.24 | 3.16 | 3.49 | 3.25 |
| 06/23/2022 | 1.65 | 2.44 | 2.78 | 3.01 | 3.12 | 3.14 | 3.16 | 3.09 | 3.45 | 3.21 |
Table Courtesy US Treasury Department
Take your time and have fun with the chart. It looks like a German train schedule but if you are unfamiliar with the yield curve you will begin to get the hang of it. Notice that rates out to 10 years rose steadily as they had done since March 9, 2020, when the 10-year was 54 basis points. The recent sharp turnaround started on June 14. The chances that this turnaround continues can’t be calculated but in figuring out what to do with a cash position, I’m sticking with 50-50 odds. That means putting 50% of available cash in a short term Treasury ladder.
A Few Inflation Indicators
If anything, my intuitive sense that a recession is on the way is getting stronger. That would, of course, suggest locking in current yields. This isn’t just a notion. The odds on a recession are not quite pure speculation and a number of important indicators are slowly ticking up. The first one may be the behavior of the bond market itself. The Treasury market is one of those peculiar indicators which helps predict its own future. A few secondary indicators often confirm the picture. Here are a few.
- Housing sales recently hit a wall. This in part because of rising mortgage rates. Houses under construction continue rising but new contracts are stalling. Housing is one of the most important factors in ups and downs of the economy. Among the indicators which forecast the future of housing are prices of leading housing stocks like Lennar (LEN). Lennar was recently down 41% from its December high and is selling at 4 times forward earnings. That means the market thinks that forward earnings will be knocked down quite a bit.
- The price of lumber is a concrete and immediate indicator of what is on the way for the economy. Lumber futures are down 58% from their March high.
- Consumers are a larger factor than housing but less predictive because they are more stable. Consumer discretionary businesses are a better indicator than consumer staples. Staples are currently outperforming discretionary, a common sign of a weakening economy. The Consumer Discretionary Select Sector SPDR ETF (XLY) is down 35% since its November 2021 high while the Consumer Staples Select Sector ETF (XLP) is down only 13.5%.
- Copper is sometimes called Dr. Copper because it functions as a professor predicting the economic future. Copper futures are down 23% since their March high.
- The ratio of copper/gold, effectively copper priced in gold, is a good indicator of the level of optimism about the economy versus pessimism and fear. It has been relatively flat for 15 months before breaking down to a new low in June. Fear reigns.
Are these numbers definitive predictors of a recession? Not quite. Employment numbers remain strong, although they are a coincident indicator. Future indicators increasingly point in the direction of recession.
Why Put Just 50% Of Cash Reserves Into A Treasury Ladder?
The first point to make is the obvious one. The reason for doing this and doing it right now is that Treasury yields have risen enough to make it worth doing. Money market funds of all kinds are yielding next to nothing. Laddering Treasuries out to 2 years or so picks up yield in the vicinity of 3% with minimal risk and maximal flexibility. This article is written for people who hold cash they don’t presently want to deploy long term but would like to add a modest contribution to total portfolio returns.
Investing is the eternal search for win-win solutions. The ideal strategy is one where you win even if your premise is wrong. The premise of my short Treasury strategy is that the recent 3.49% print on yield for the 10-Year Treasury may have been the high for a while. It’s also the premise of this article, but it comes with a moderate level of conviction. What’s the way to win even if the premise is wrong? The answer is a bond ladder.
A surprising number of highly intelligent people I have asked don’t know what a bond ladder is. It’s really a fairly simple concept. You simply buy bonds (or other fixed income instruments like CDs) with maturities at set future intervals. Your choice for the interval will vary depending on your particular needs or the nuances of your strategy. In my present actions the interval starts at six months and continues at 6-month intervals, and it is what I am recommending in this article. What I did and what I suggest for you is to buy equal amounts of Treasuries starting at six months, then 12 months, then 18 months, then two years. That’s where my personal Treasury ladder stops. My time periods aren’t exact. I will extend a month or two if I get a meaningful jump in yield. For instance, in my recent buying I got a jump in yield by pushing my 18 month duration out by a couple of months. That anomaly was in the Treasury offerings at Vanguard and may or may not still be there.
Why did I stop at 2 years? The short answer is that two years is the extent of visibility I have at the present moment. Also, if you look at the tables above you don’t get paid very much for moving out beyond 2 years. In fact, the rate for 2 years is trading around the same as the rate for 10 years. That’s the number one indicator, you will remember, for a softening economy.
There is, however, one argument for going further out on the yield curve, to 3 years, or even 10 years. That’s to lock in a good yield against the prospect that rates go back down quickly and stay down. That’s something which might well happen if the market stumbles badly and there is a deep recession. The Fed might stop tightening and raising rates and instead pivot to dropping rates quickly in order to fight the recession. In that case, you would be pleased to have higher rates which are no longer available. For example, I have CDs (not Treasuries) bought at a 3.55% yield five years ago and coming due this December. Over the intervening period nothing approaching 3.55% was available.
Most insurance companies use a bond ladder as their primary approach to setting funds aside to pay estimated future claims. While writing a recent article on Markel (MKL) I noticed that their ladder extends to five years. It is possibly shorter than it might otherwise be because longer maturities have not offered much improvement on shorter maturities in recent years and also because Markel has a blue chip stock portfolio which should cover the need for funds to pay claims in the more distant future. That may be helpful in thinking about ladders. Stocks are assets with very long maturities.
The great advantage of a ladder is that it provides flexibility. Here are some of the possible actions that you could do with the 50% you keep in cash. It assumes equal amounts invested right now at six month intervals starting in the present and going out two years:
- You can lengthen your furthest out maturity at any point by extending your ladder to 2 1/2 or 3 years, or more if you like. You might do this if the curve steepens and longer Treasuries offer higher yield, or you might do it because you wish to lock in longer maturities because you feel that the present yields may get away.
- You could do the same thing redeploying the funds received when the six month Treasuries mature. That’s the most basic use of a ladder. You push the six month maturity out to the new 2 year maturity. Your past one-year step on the ladder becomes the 6-month. You don’t have to do that, however. Every six months you get the chance to reassess. You may wish to stay short term or go much longer term. You could also use the cash to buy stocks or take a nice vacation.
- In fact, the amount of your total cash you wish to deploy and the length of your longest maturity will take into account the amount you would wish to have on hand if a sudden great opportunity of any kind presented itself.
- Ultimately a good strategy for many investors is to establish first the percentage you would like to hold in stocks versus bonds. My own strategy is to emphasize the risk free 3% rate of Treasuries right now but remain ready to add stocks if a good buying opportunity arises. My own long term preference is to hold 100% stocks but certainly not right now.
A Cheap Vanguard ETF Will Basically Do This For You
Nothing beats organizing your own ladder. This enables you to tinker and adjust as you wish. The Vanguard Short-Term Treasury Index ETF (NASDAQ:VGSH) accomplishes something similar but without the same opportunity to shape and tinker on your own. There is a long history of argument about buying fixed income funds or ETFs versus buying the individual fixed income securities. The best argument for owning the individual securities is that the individual securities mature at a time certain when they reach maturity. At that point you get your money back and have options as to what you wish to do with it. VGSH does the laddering for you.
Here are numbers from Vanguard’s presentation of the basic facts:
| Short-Term Treasury ETF | US 1-3 Year Treasury Index | |
|---|---|---|
|
Number of Bonds |
93 |
93 |
|
Yield to Maturity |
2.5% |
2.5% |
|
Average Coupon |
1.3% |
1.4% |
|
Average Effective Maturity |
2.0 years |
2.0 years |
|
Average Duration |
1.9 years |
1.9 years |
|
Total Assets |
$18.3 billion |
— |
Data Extracted From Vanguard Table
The fact that the yield is less than the roughly 2.78% available for the one year means that the portfolio must be weighted toward shorter maturities perhaps starting with the 3-month. I don’t include the 3-month because as you will see in the Treasury Yield Curve table the rate drops off quite a bit. It does, however, enable you to turn over your ladder more quickly.
The fact that the average short term coupon is much lower than the portfolio yield to maturity means that a number of securities were issued when rates were lower and now sell at discounts. This was the case with more than half of the Treasuries I bought, meaning that while they are priced for the current yield I will get the largest part of it at maturity. Treasuries being sold by former holders on this basis often offer a somewhat higher ultimate return than Treasuries selling at par. Individual sellers are probably more motivated and some buyers prefer their returns in regular coupons despite the fact that total yields take all factors into mathematical account.
The above paragraph may seem a bit esoteric, but if buying your short Treasuries on a site like Vanguard it may help you to reread it if a question comes up concerning such things as a coupon rate far under the yield to maturity. Duration, for readers not familiar with fixed income, reflects the fact that interest payments are made before maturity and the early return of a part of your capital shortens the average time until your money is returned.
The following chart tracks the performance of the Vanguard Short-Term Treasury ETF since inception:
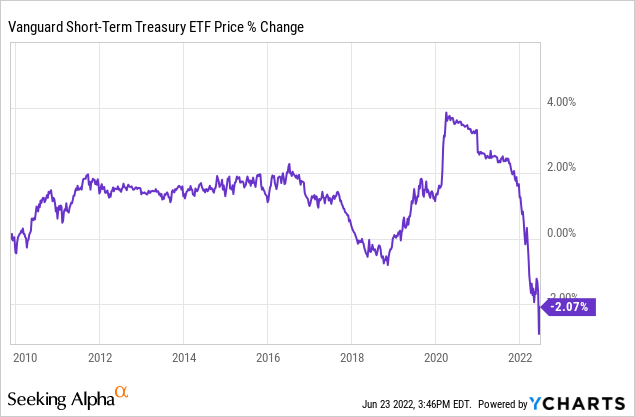
The above chart is counterintuitive. When it goes down, rates are going up. When it goes up, rates are going down. The recent peak was in March 2020 when it felt like the financial world was coming to an end and rates kept going down as the Fed provided liquidity. The extended flat period from 2010 to 2017 represented the long deflationary period in which the Fed suppressed rates and rates for an average of 2-year maturities stayed just under 2%. During those years holders of the ETF mainly got the coupon. With stocks going up over most of that period buying a short term Treasury ETF wasn’t worth the trouble.
The Fed tried raising rates in 2018 and precipitated a mini bear market in stocks. It went back to suppressing rates in 2019 and then pushed rates down frantically as the pandemic lockdown crushed stocks and the economy. The Fed then let rates rise gradually to the ten year norm before undertaking a huge push to fight inflation. This whacked the value of bonds held in the Short-Term Treasury ETF as short Treasuries bought when yields were much lower fell to heavy discounts (as in the Vanguard table above). It’s a little mind bending but the ETF should do well again if rates stabilize or decline.
Conclusion
Many quant estimates of stock returns suggest that current valuations are likely to be in low single digits for the next five or ten years. A true wipeout bear market might drop stock prices enough that you would suddenly have the opportunity to pile into stocks in a big way with the promise of something closer to the long term average of 10% nominal returns. Unless that happens, a Treasury return of 3% looks pretty good in risk adjusted terms. The flexibility of laddered short Treasuries may set you up well to buy stocks in a deep bear market.
The Vanguard Short-Term Treasury ETF is a way to get more or less the same result from a similarly laddered portfolio starting at a shorter maturity than the 6 months I prefer. I feel that by doing it myself I take advantage of owning Treasury securities which run off at a time certain and can take advantage of the opportunity to make changes as the situation in the market changes. The VGSH ETF provides convenience, especially, if you are in any way insecure about buying your own individual securities and it has a very low .04% cost. It’s the great second best option.
The strategy employing laddered short Treasuries has as its goal replacing money market funds, which have minuscule yields, with investments that now offer a very meaningful 3% return. The rationale for buying now is that recession odds are rising. The direction of rates is very much binary. It goes up with inflation and a continuing strong economy, down if a serious recession is in the cards so that the Fed is forced to add liquidity and drop rates. Having no privileged insight I’m going with 50-50 odds for now, although the odds seem increasingly to be tilting toward recession. For now I’m going with a 50% short Treasuries/50% cash position. I may at some point add to the Treasury side and extend the maturity for the last leg of my ladder. My suggestion is to take your own situation and goals into account and do something similar. It’s not too late.
Be the first to comment