


RichLegg
Goldilocks?
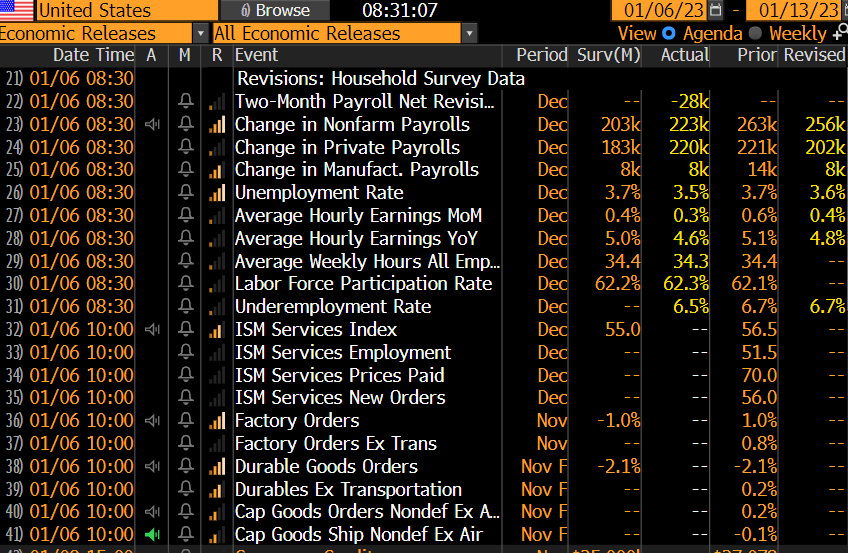
The December employment report revealed a 223,000 jobs gain, not far from the 203,000 consensus estimate. Manufacturing employment increased by 8,000. Private payrolls grew by 220k vs. the 183k expectation. The unemployment rate came in at 3.5%, down from November and below the 3.7% forecast. The U3 rate is now tied for the lowest since 1969 as the employment market remains tight, as suggested by this week’s JOLTS report and claims data.
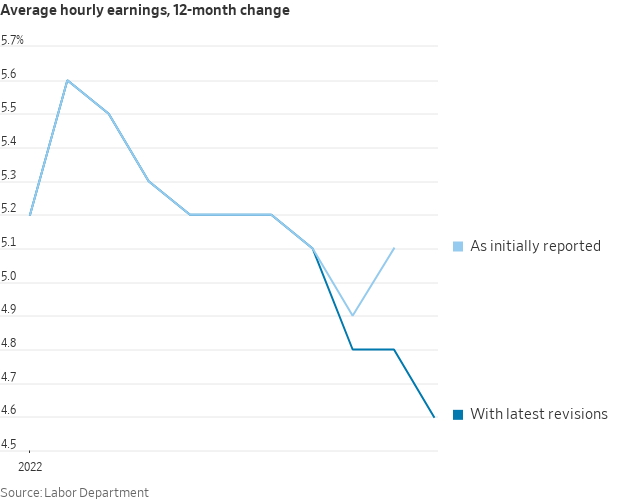
Average hourly earnings rose by 4.6% on a year-over-year basis, down from +4.8% in November. With a +0.3% month-over-month rise, that’s better than the +0.4% estimate and indicative of positive real wages for both November and December. Also, there’s good news on the inflation front as a slightly weaker-than-expected average weekly hours figure from November and relative to consensus might mean a less hawkish Fed.
Weaker Revised Average Hourly Earnings
WSJ
Meanwhile, the Labor Force Participation Rate rose to 62.3, the best since August 2022’s 62.4 – a good sign for the Fed. The underemployment rate (U6) fell to a cycle low of 6.5%, equal to the pre-pandemic trough. Interestingly, the often more volatile household survey showed a massive 717k jobs gain, reversing a trend of relatively weak household surveys compared to the establishment report.
North of the border, by the way, the Canada December employment report showed an extraordinarily strong +104k reading (forecast of 5k).
A Bullish Jobs Report, Soft Average Hourly Earnings
Christian Fromhertz
Following the bullish US employment situation data, Treasury yields fell while stock market futures rose. Dow futures were up by more than 300 points while S&P 500 futures rose by 44. The yield on the 10yr Treasury note bounced around but was below 3.7% after the NFP report. The 2-year rate fell 6bps to 4.38%. VIX futures tumbled to near 22.
Bulls might want to check their optimism at the door, though, as the trend over the last year (which has featured many stronger-than-expected headline jobs gains) has been negative in the days and weeks after the monthly employment report release. The S&P 500, on average, has dropped by nearly two percentage points in the two weeks after NFP, according to data gathered from Michael McDonough.
Weak S&P 500 Returns Post-Jobs Reports In The Last Year
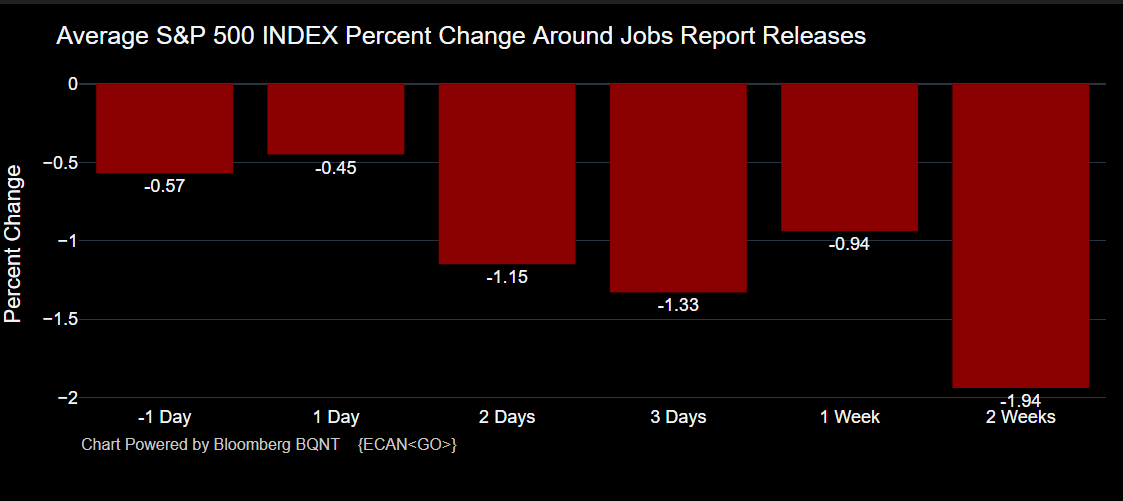
Michael McDonough
Nine Straight Better-Than-Forecast NFPs
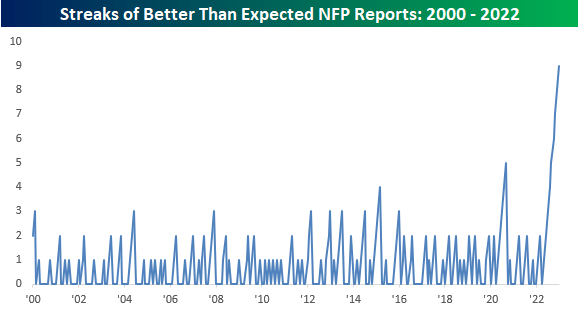
Bespoke Investments
Monthly Job Gains Coming Down
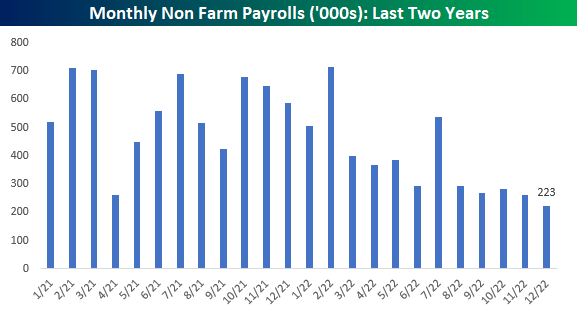
Bespoke Investments
The good news is that hourly earnings, among other inflation measures, should give the Fed more leeway in not needing to raise rates a whole lot more, despite their hawkish rhetoric lately. Keep in mind that the Fed’s words and messaging are part of its monetary policy. Fed fund futures now price in a peak rate of 5.04% by June. Today’s employment report is an arrow in the quiver of the soft-landing camp, but stocks remain mired in a downtrend that is tough to break right now. One efficient fund tracks US large caps.
According to Vanguard, the Vanguard Large Cap ETF (NYSEARCA:VV) provides a convenient way to match the performance of a diversified group of stocks of large U.S. companies. The fund seeks to track the performance of the CRSP US Large Cap Index using a passively managed, full-replication approach. In essence, it provides very comparable total return exposure to the S&P 500 index. VV features just a 0.04% annual expense ratio and has paid a 30-day SEC yield of 1.66%.
Despite average volume over the past 50 days of just 409,000, the 30-day median bid/ask spread is very tight at just three basis points while the ETF has a history of trading remarkably close to its NAV. In terms of portfolio construction, VV holds 568 stocks with average earnings growth of 11.7%. The P/E ratio on the large-cap blend portfolio is 18.2. Morningstar rates VV with four stars and a gold rating.
VV Portfolio & Key Measures
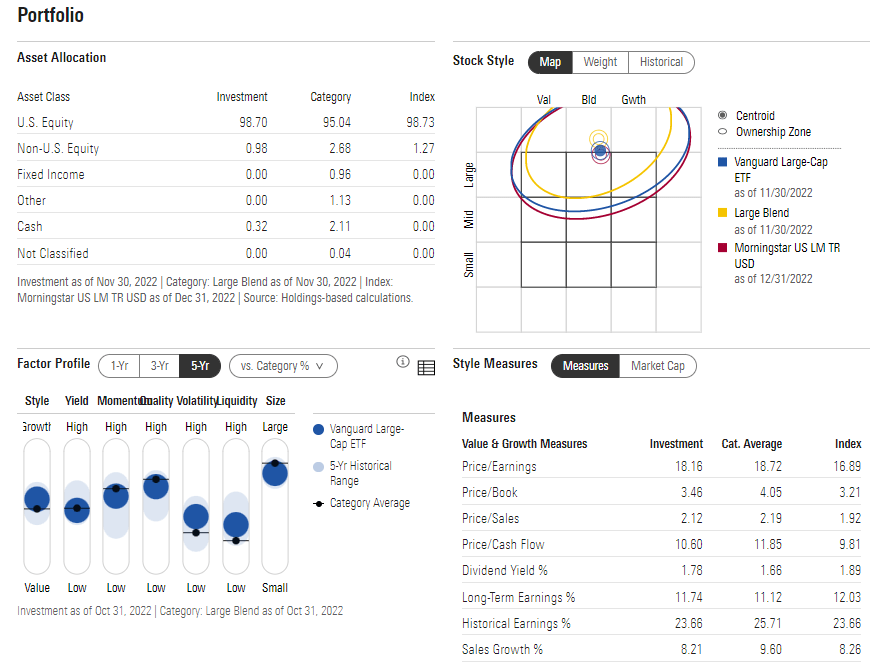
Morningstar
The Technical Take
VV, like the S&P 500, was rejected at attempts to climb above its 200-day moving average on a few tries over the last several months. There was some optimism back in November and December when shares settled above the key long-term trend indicator, but the bears roared to close out the year despite a bullish Santa Claus Rally stretch (a positive total return from the last five trading days of 2022 and first two of 2023).
The chart below illustrates that large-cap US stocks remain stuck in a downtrend that began more than a year ago. Moreover, the 200-day is downward sloping—a bearish sign—while the RSI indicator at the top of the chart suggests an ultimate move to near 30 might be in the cards considering several trips down to that level in the last 12 months. Finally, notice how very recent price action in the last month has the hallmarks of a bear flag pattern. Overall, I continue to be cautious on the broad market here but would be more constructive on a flush to the low to mid 3000s or a breakout above 4200 on the SPX.
VV: US Large Caps Trending Lower. Bear Flag?
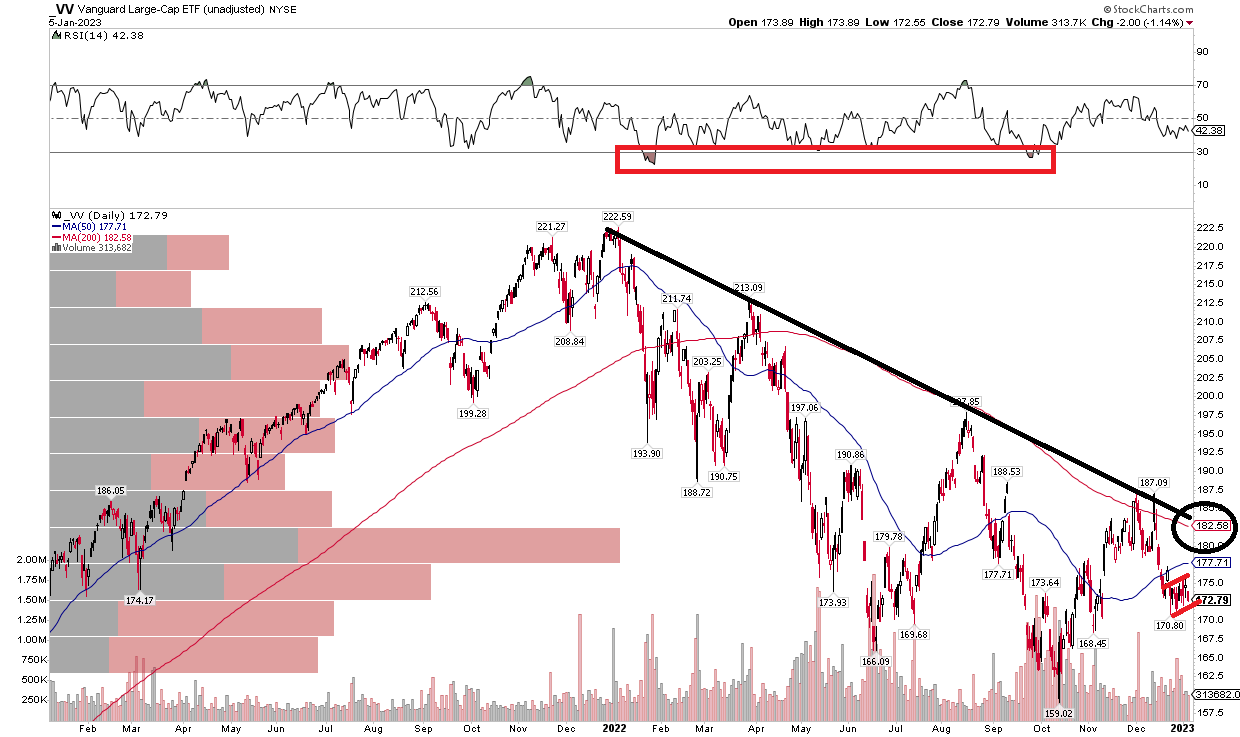
Stockcharts.com
The Bottom Line
The December jobs report came in above expectations. US stock market futures initially rallied following the news, but US large caps, as measured by the VV ETF, continue to trend down from their all-time high notched more than a year ago. I see more volatility ahead as the economy potentially falters into a mild recession, but today’s impressive report might reduce the chance of a prolonged economic contraction.
Be the first to comment