

FireflyLight/iStock via Getty Images
The Pacer US Cash Cows Growth ETF (NYSEARCA:BUL) offers exposure to an amalgamation of the growth, quality, and value factors in a U.S. equity portfolio calibrated using a Free Cash Flow-centered methodology.
This is a unique strategy producing solid results. To corroborate, although having just a few years in the books, BUL has already proved that it is capable of delivering sizeable returns, significantly outpacing the market. For instance, incepted on 2 May 2019, during the June 2019 – December 2022 period, it beat not only the iShares Core S&P 500 ETF (IVV) but also its racier peer tech-heavy Invesco QQQ ETF (QQQ), delivering an almost 14% compound annual growth rate. Interestingly, despite the fact that growth stocks, even those sporting leading free cash flow yields, were through the wringer in 2022, and BUL also declined meaningfully, by about 16.2%, it still managed to outperform IVV by more than 2%.
That being said, this ETF has a few vulnerabilities which might be overlooked upon cursory inspection. My today’s article is supposed to provide a balanced overview of both advantages and drawbacks to arrive at a conclusion about whether BUL deserves a Buy rating or not.
Investment strategy
The footing of BUL’s strategy is the Pacer US Cash Cows Growth Index, which is rebalanced quarterly; the fund’s 76% turnover is a direct consequence of that.
The benchmark itself is a fraction of the S&P 900 Pure Growth index, from which it picks 50 players with the highest FCF yields, weighing them by market cap, restricting a constituent’s maximum weight to 5%. The yield is calculated by dividing FCF by Enterprise Value.
The S&P 900 is essentially the sum of the S&P 500 and S&P 400, the barometers of the U.S. equity large- and mid-size segments. Its ‘pure-growth’ component consists of stocks that have the strongest sales growth, the ratio of earnings change to price, as well as price momentum; it uses a smart-beta ‘growth-score’ driven weighting schema.
Importantly, BUL’s underlying index has no interest in financials (except for REITs); this is explainable as the concept of free cash flow is irrelevant for banks, insurance brokers, and the like.
Portfolio: overweening exposure to petroleum
As of January 13, with a portfolio of 50 stocks, BUL had an overweening exposure to energy, with almost 46% allocated. The Invesco S&P 500 Pure Growth ETF (RPG) also has a sizeable share of the net assets invested in petroleum players, close to 31%. Next, in the S&P 900 Pure Growth index, the energy sector accounted for slightly more than a quarter as of 30 December 2022. All these are more likely the consequence of the oil price slump of 2020 and the subsequent recovery of Brent, WTI, and other benchmarks, last year spurred by the geopolitics that worsened the supply/demand imbalances and sent prices soaring. Expensive crude oil (and partly natural gas) grossly contributed to revenue growth in the industry, also boosting the operating and free cash flows of petroleum players.
Created by the author using data from the funds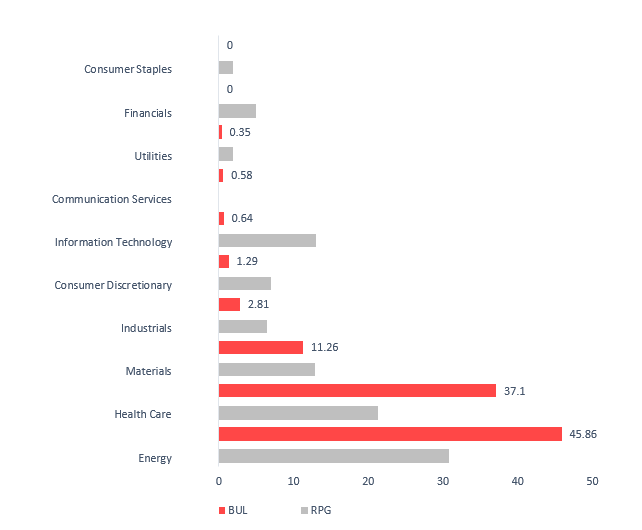
At the same time, BUL sees little value in communications (0.6%) and utilities (0.4%). The latter is represented by just one stock, ONE Gas (OGS), a regulated natural gas distribution utility company, with a 0.4% weight. Another sector the fund is steering clear of at this point is consumer staples; I am of the opinion this could be the consequence of typically lackluster growth profiles in this sector. This implies investors seeking recession-proof portfolios for whatever reason should think twice before going long BUL as in case the soft-landing plans go awry, there is a solid chance this ETF with minuscule exposure to defensive equities will underperform burdened by cyclicals (especially petroleum).
It is of note that BUL is significantly underweight IT, with just one tech stock in the portfolio at the moment, WEX (WEX), a fintech company, while, for instance, RPG mentioned above has close to 13% parked in the tech stocks. Interestingly, in December 2021, as illustrated by the fund’s webpage saved by the Wayback Machine, BUL had close to 27% allocation to the tech sector, with Apple (AAPL) and Microsoft (MSFT) being both present in its portfolio.
Also, in line with the index methodology, BUL completely ignores the financial sectors; real estate, by the way, has also failed to qualify.
Regarding the size factor, the ETF has solid exposure to mega-caps, with almost 34% spread between 7 stocks, while mid-caps account for only 10.6% of the overall portfolio. As a consequence, the weighted-average market capitalization is around $114.3 billion. This should be a strong tailwind for quality.
At the moment, BUL is especially bullish on Moderna (MRNA), which occupies the top stop with a weighting of 5.5%. This biotech company, previously the pandemic hot stock, is forecast to deliver a 115% forward revenue growth rate; my calculations show it has about 10.8% FCF yield (FCF/EV).
Is BUL comfortably valued?
As the fund is heavy in oil & gas exploration & production companies, it was hardly surprising for me to uncover that BUL has a rich weighted-average earnings yield of around 12.3%, or a P/E ratio of 8.2x, a phenomenally low level, about 2.4x lower than IVV’s. 17 out of 21 energy stocks in this basket have an EY above 10%, which drove the fund’s EY higher. Partly owing to the same factor, the weighted-average cash flow yield (I computed it by dividing net CFO by EV) is around 14.4%, a decent level. Finally, almost 28% of the holdings have an at least B- Quant Valuation grade.
Interestingly, despite being comfortably priced, BUL sports a weighted average forward EPS growth rate of close to 29%, as of my calculations, coupled with a WA EBITDA growth rate of over 38%.
Does BUL hold high-quality stocks?
It obviously does. 99.3% of the holdings have a B- Quant Profitability grade or better. None of the companies is cash-burning; the median cash margin is solid, 31%.
Performance analysis
During the June 2019 – December 2022 period (it was incepted on 2 May 2019), the ETF delivered about 13.95% CAGR, solidly outpacing IVV, QQQ, and RPG. However, its value-focused peer Pacer US Cash Cows 100 ETF (COWZ) still did better, with the highest CAGR in the group thanks to its spectacular return of 41.7% in 2021; also, in 2022, it managed to deliver a TR of 20 bps while the rest of the group was in the red.
| Portfolio | BUL | IVV | RPG | QQQ | COWZ |
| Initial Balance | $10,000 | $10,000 | $10,000 | $10,000 | $10,000 |
| Final Balance | $15,968 | $14,800 | $13,761 | $15,682 | $18,860 |
| CAGR | 13.95% | 11.56% | 9.32% | 13.38% | 19.37% |
| Stdev | 23.39% | 19.73% | 24.40% | 22.89% | 23.46% |
| Best Year | 32.48% | 28.76% | 29.40% | 48.40% | 41.70% |
| Worst Year | -16.18% | -18.16% | -27.55% | -32.58% | 0.20% |
| Max. Drawdown | -27.33% | -23.93% | -31.66% | -32.58% | -27.84% |
| Sharpe Ratio | 0.63 | 0.6 | 0.45 | 0.62 | 0.83 |
| Sortino Ratio | 1 | 0.92 | 0.66 | 0.97 | 1.33 |
| Market Correlation | 0.96 | 1 | 0.95 | 0.93 | 0.89 |
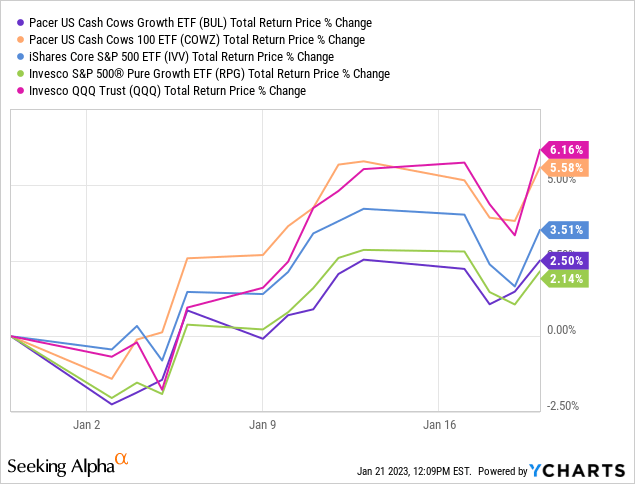
It has started 2023 on an up note yet outperforming only RPG for now.
BUL: a few critical remarks
The essential issue is its expense ratio of 60 bps, which is justified given the complex high-turnover strategy, yet it is nevertheless fairly uncomfortable as burdensome fees erode returns. Apart from that, with just $40.6 million in assets under management, BUL’s average daily share volumes are more than 2x lower than the median for all ETFs covered, so building a comparatively large position should be rather challenging.
Conclusion
What is BUL in the current iteration? Essentially, this is a 50-strong equity portfolio of S&P 900 stocks completely dominated by energy, with rich earnings, cash flow yields, robust quality, and growth characteristics to be justly proud of. Assuming the current market environment, I would otherwise assign it a Buy rating. Alas, fees and liquidity are the apparent disadvantages. And in my view, the most appropriate rating is Hold.
Be the first to comment