

bitterfly/iStock via Getty Images
Investment Thesis
Builders FirstSource, Inc. (NYSE:BLDR) 2022 revenue is about 6.5 times larger than that in 2015. While revenue has grown, there are no clear improvements in the margins or asset utilization.
Its strong performance was in the past 2 years. These were due to the tailwinds from the one-off price spike. Washing out the effects of the price spike and looking at its performance over the cycle, it is not a high-growth stock.
This conclusion was based on a Greenwald Asset Value vs Earnings Power Value analysis. A Greenwald analysis showed that is not a “franchise” with a moat. There is no margin of safety based on the Greenwald return formula.
Thrust of my analysis
In my last article on BLDR, I analyzed and valued it as a no-growth cyclical stock. Refer to “Builders FirstSource: Don’t Be Mesmerized By The Past Few Years’ Performance”.
Some readers have challenged my view. In their view, BLDR can continue to grow through acquisitions despite being in a cyclical sector. The other critique was that the changes in the margins were due to efficiency improvements and /or changes in the product mix. The historical margins over the cycle did not reflect the improvements.
This article considers the alternative view – BLDR is a growth stock with improved margins.
I used the Greenwald approach to determine whether BLDR is a high-growth company. I then used the Greenwald return formula to determine whether there is a margin of safety at the current price.
I looked at 2 scenarios:
- Scenario 1 – the past 2 years’ numbers reflect the future performance.
- Scenario 2 – BLDR is still a cyclical company and we have to factorize the past 2 years’ numbers to reflect the future cycle.
There are 3 challenges in determining the cycle factor:
- The current revenue reflects the historical acquisitions.
- There was an industry-wide, one-off price spike in 2021/22.
- Despite any acquisition in the future, BLDR still operates in a cyclical sector.
To address the above, I assumed that the 2022 performance reflected the full impact of all the acquisitions. The 2022 revenue then represented its current size, except that it still incorporated the one-off price spike.
I next washed out the one-off price spike in revenue. BLDR provided a breakdown of its annual revenue growth into those from acquisitions for the year, organic growth, and price changes. I used this data to estimate what the 2022 revenue would be if there were no price spikes in 2021/22.
Since BLDR is a cyclical company, I next estimated the normalized margins over the cycle based on the 2021/22 margins. To derive these, I scaled the 2021/22 values with an industry factor. The industry factor = (industry 2005 to 2020 average) / (industry 2021 to 2022 average).
Using the Greenwald approach with the above-adjusted data, I found that based on the cyclical scenario:
- BLDR is not a high-growth company. It is not a “franchise” in Greenwald’s terminology.
- There is no margin of safety based on Greenwald’s return approach.
Of course, you have the opposite conclusion if based only on the unadjusted past 2 years’ numbers.
Greenwald approach
According to Professor Bruce Greenwald, you can get strategic insights by comparing the Asset Value (AV) with the Earnings Power Value (EPV). You then have 3 scenarios:
- AV = EPV. Here the returns would equal the cost of funds. You would expect this in a freely competitive environment. If the returns are higher, there would be incentives for new entrants that would drive the returns down. If the returns are lower, companies would leave the industry. There would be less competition and returns would improve.
- AV > EPV. Here the returns are less than the cost of funds. There is poor asset utilization due to poor management or industry problems.
- AV < EPV. Here the returns are higher than the cost of funds in a sustained manner. For this to hold, the company must have some economic moat. Greenwald believes that this sustainable growth characteristic is only applicable to “franchises”. He only considers incorporating the value of growth into the valuation for this case.
According to Greenwald, the high growth duration depends on the strength of the moat. One way to gauge this is to see how long it would take for the competitive advantage to compete away. If a company has moats that can provide “protection” for more than 2 or 3 decades, then it makes sense to determine the value of growth. Otherwise, you ignore the value of growth.
Greenwald believes that there are too many uncertainties when using a DCF model in a high-growth situation. Instead, he suggests that you look at the return space rather than the value space when figuring out the margin of safety.
Returns
As for the returns, Greenwald classifies them into 3:
- Cash returns. These are from dividends and buybacks.
- Returns from reinvestments. For this to have value, the return has to be greater than the cost of capital.
- Organic growth This comes from the general economic growth and Greenwood considers them as “free”.
He uses the following formula to estimate the expected returns:
return = b(E/P) + (1-b)(E/P)(ROE/r) + g
Where:
b = Portion of earnings distributed.
E = Earnings per share.
P = Price per share.
ROE = Return on equity
r = Cost of equity.
g = Growth.
What drove revenue growth?
BLDR’s revenue growth was due to a combination of acquisitions, organic volume growth, and price growth. BLDR provided a breakdown of each in its Form 10k which I have summarized in Table 1.
You can see that acquisitions accounted for most of the growth.
The price component was significant only because of 2021. Furthermore there are years with price declines. If there was no price growth in 2021, the price component would only have a 1.2 % CAGR instead of the 5.1 %.
Chart 4: Peer Gross Profit Margins (Author)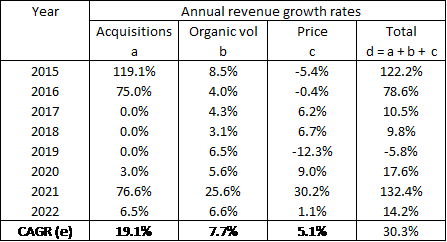
Notes to Table 1:
a) These refer to acquisitions for the year.
b) The organic volume growth includes the cumulative historical acquisitions.
c) These refer to the organic price growth.
d) These refer to the total change in the revenue.
e) These were derived by establishing the index for each component with 2014 = 100.
To get a sense of the contribution of each component, I converted the growth rates into the respective $ revenue component. I then charted them as shown in Chart 1.
From 2015 to 2022, BLDR revenue grew at 30.3 % CAGR. You can see that acquisitions accounted for the bulk of the growth.
Table 3: Determining the cycle values (Author)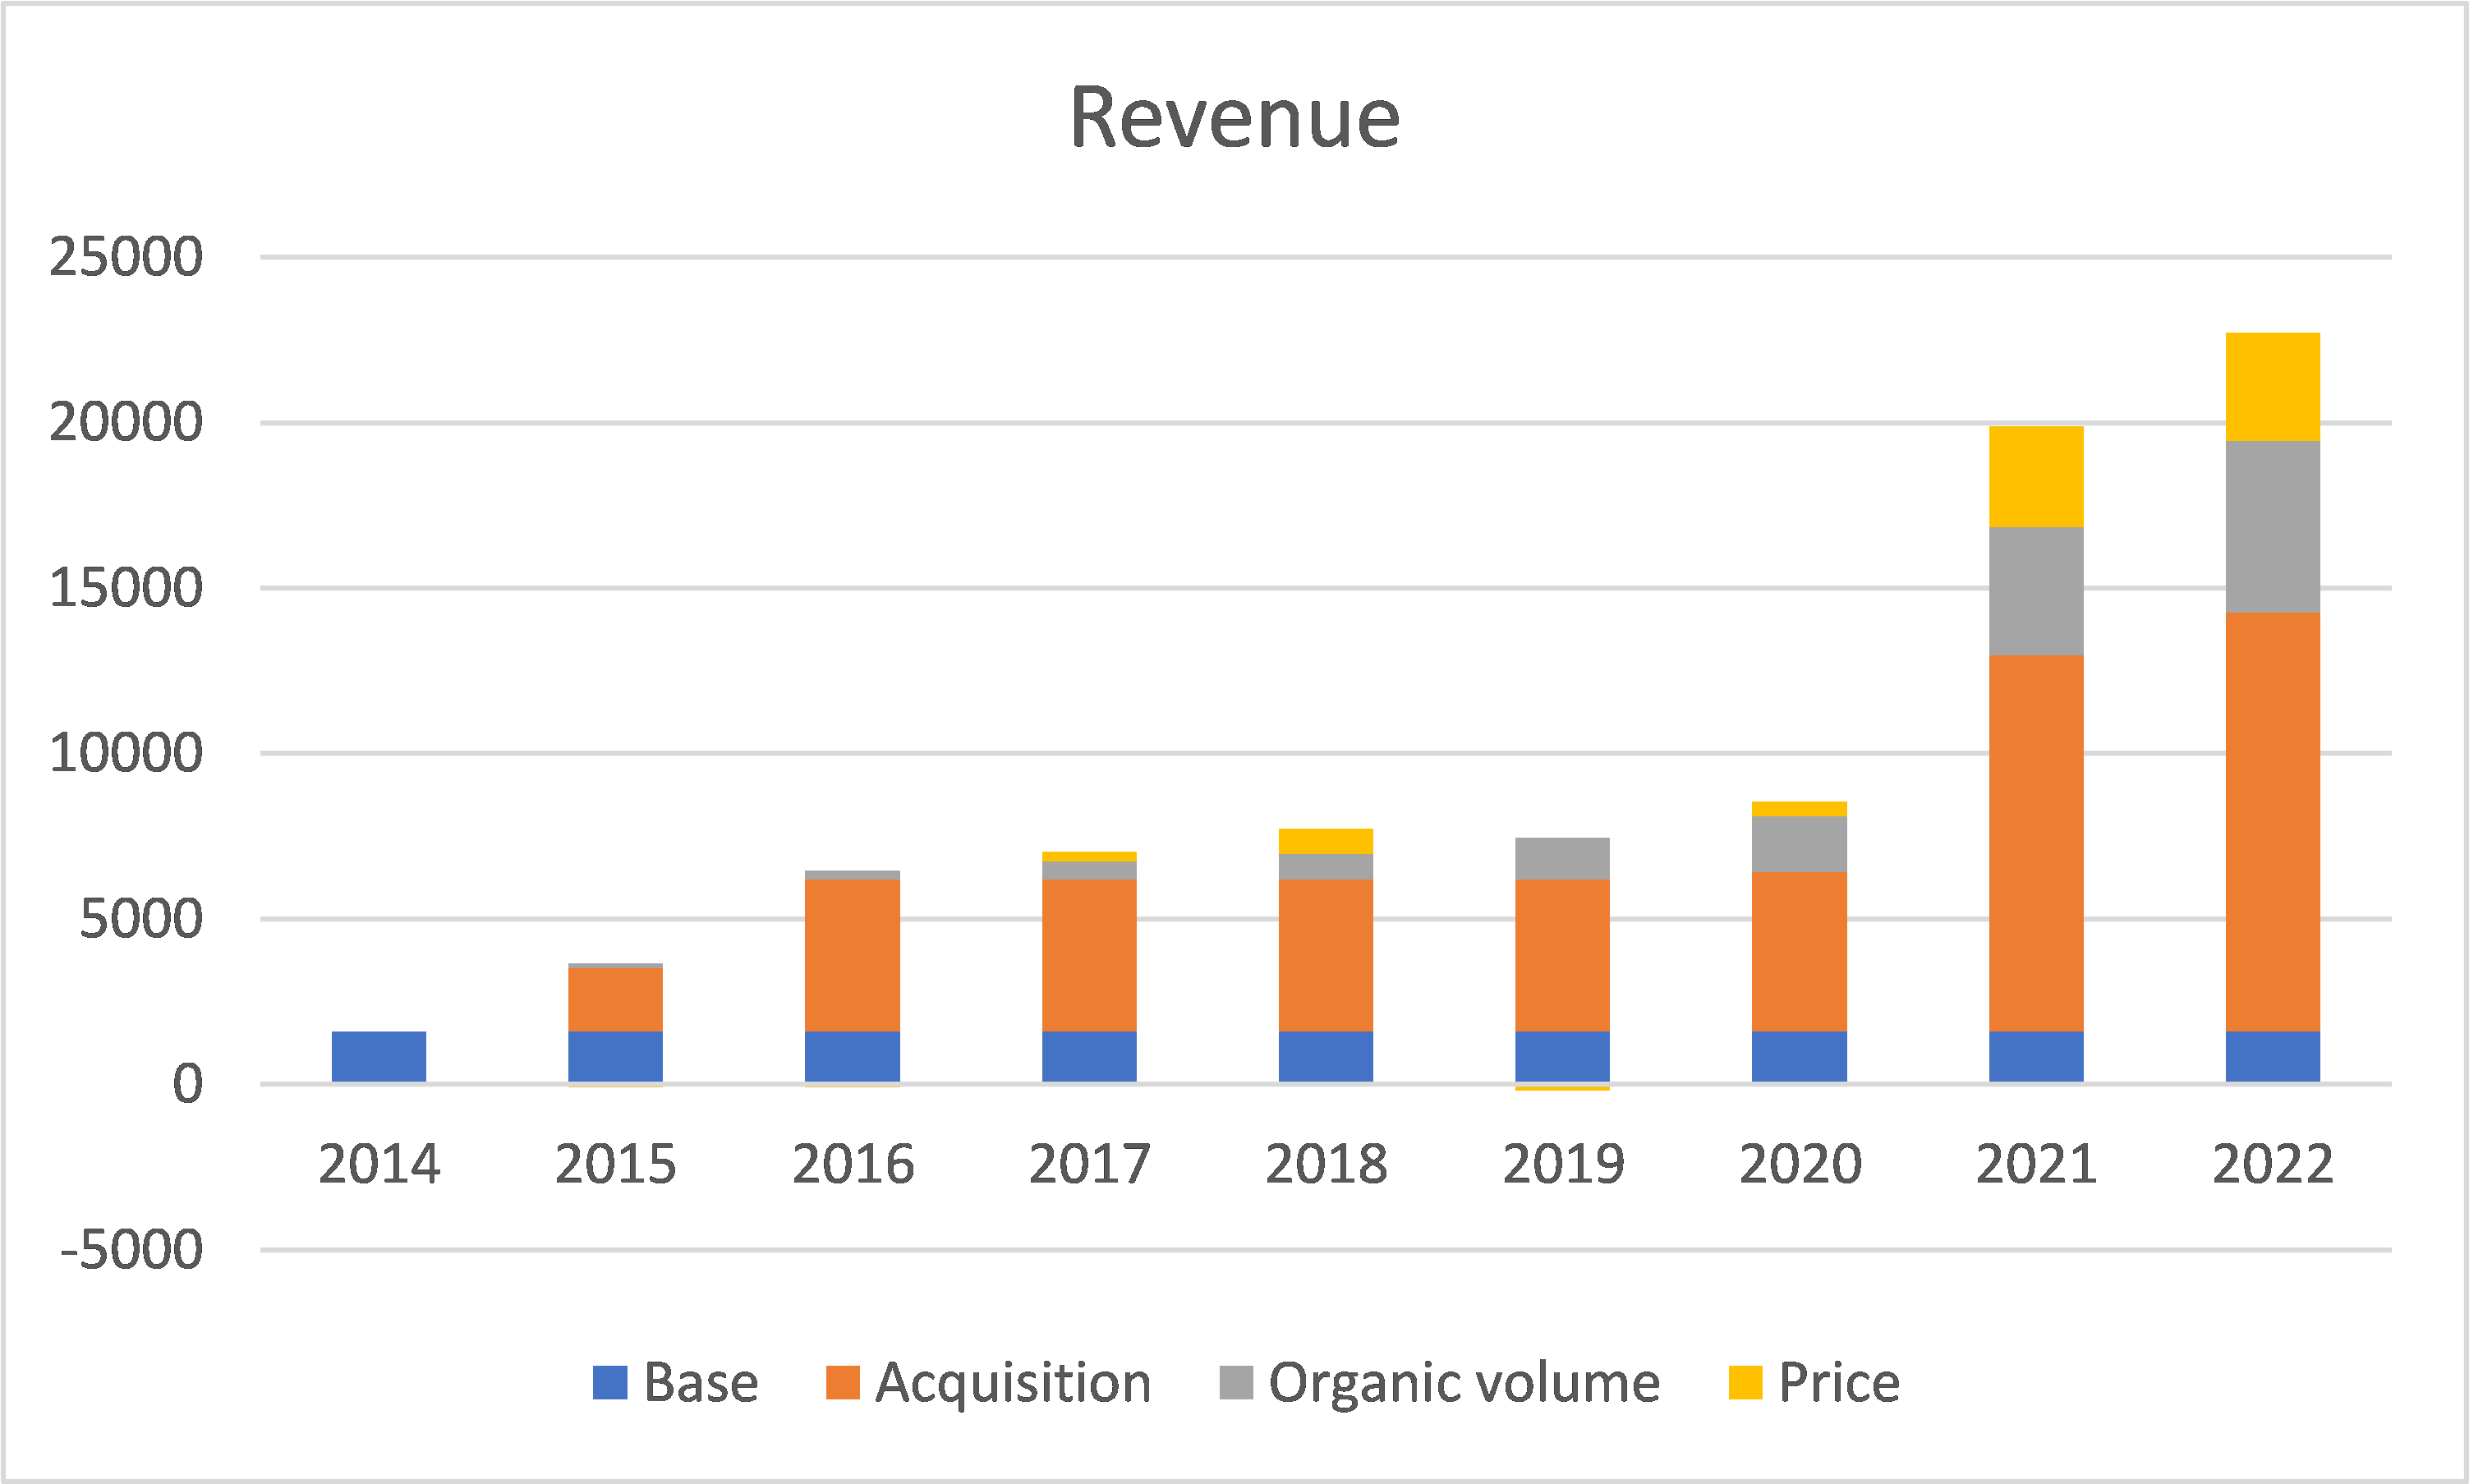
Notes to Chart 1: Units are USD million
a) I used the 2014 actual revenue as the base.
b) The organic volume growth includes the cumulative historical acquisitions.
Looking at Chart 1, you can see that there were significant price growth components in 2021/22. I do not believe that the 2021/22 prices are sustainable in the long run.
Chart 2 shows the historical lumber prices and it is obvious that the 2021/22 prices were exceptional.
Chart 2: US Lumber prices (Trading Economics)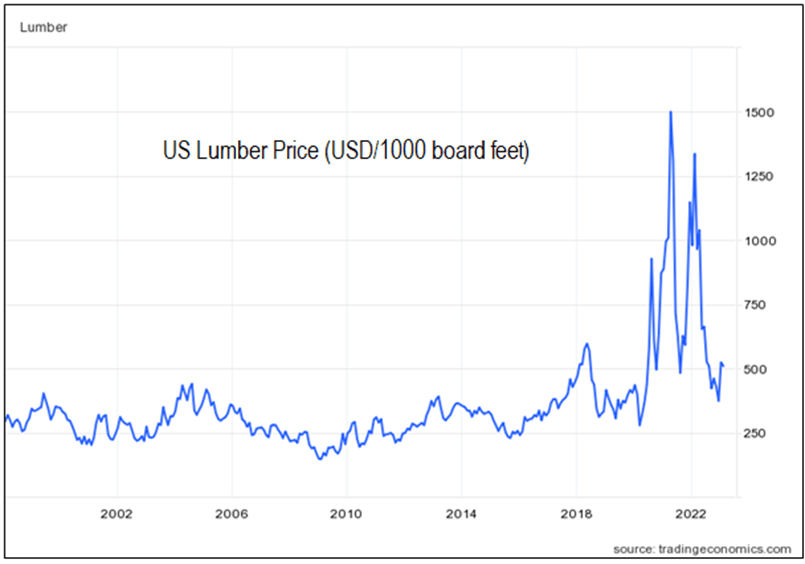
As such, I washed out the growths in 2021/22 that were due to price changes. The result is shown in Chart 3.
The resultant revenue in 2022 then became USD 17.1 billion compared to the actual revenue of USD 22.7 billion. I believe this USD 17.1 billion better represents the “size” of BLDR in the long run.
Chart 3: Revenue trends by components without the 2021/22 price growths (Author)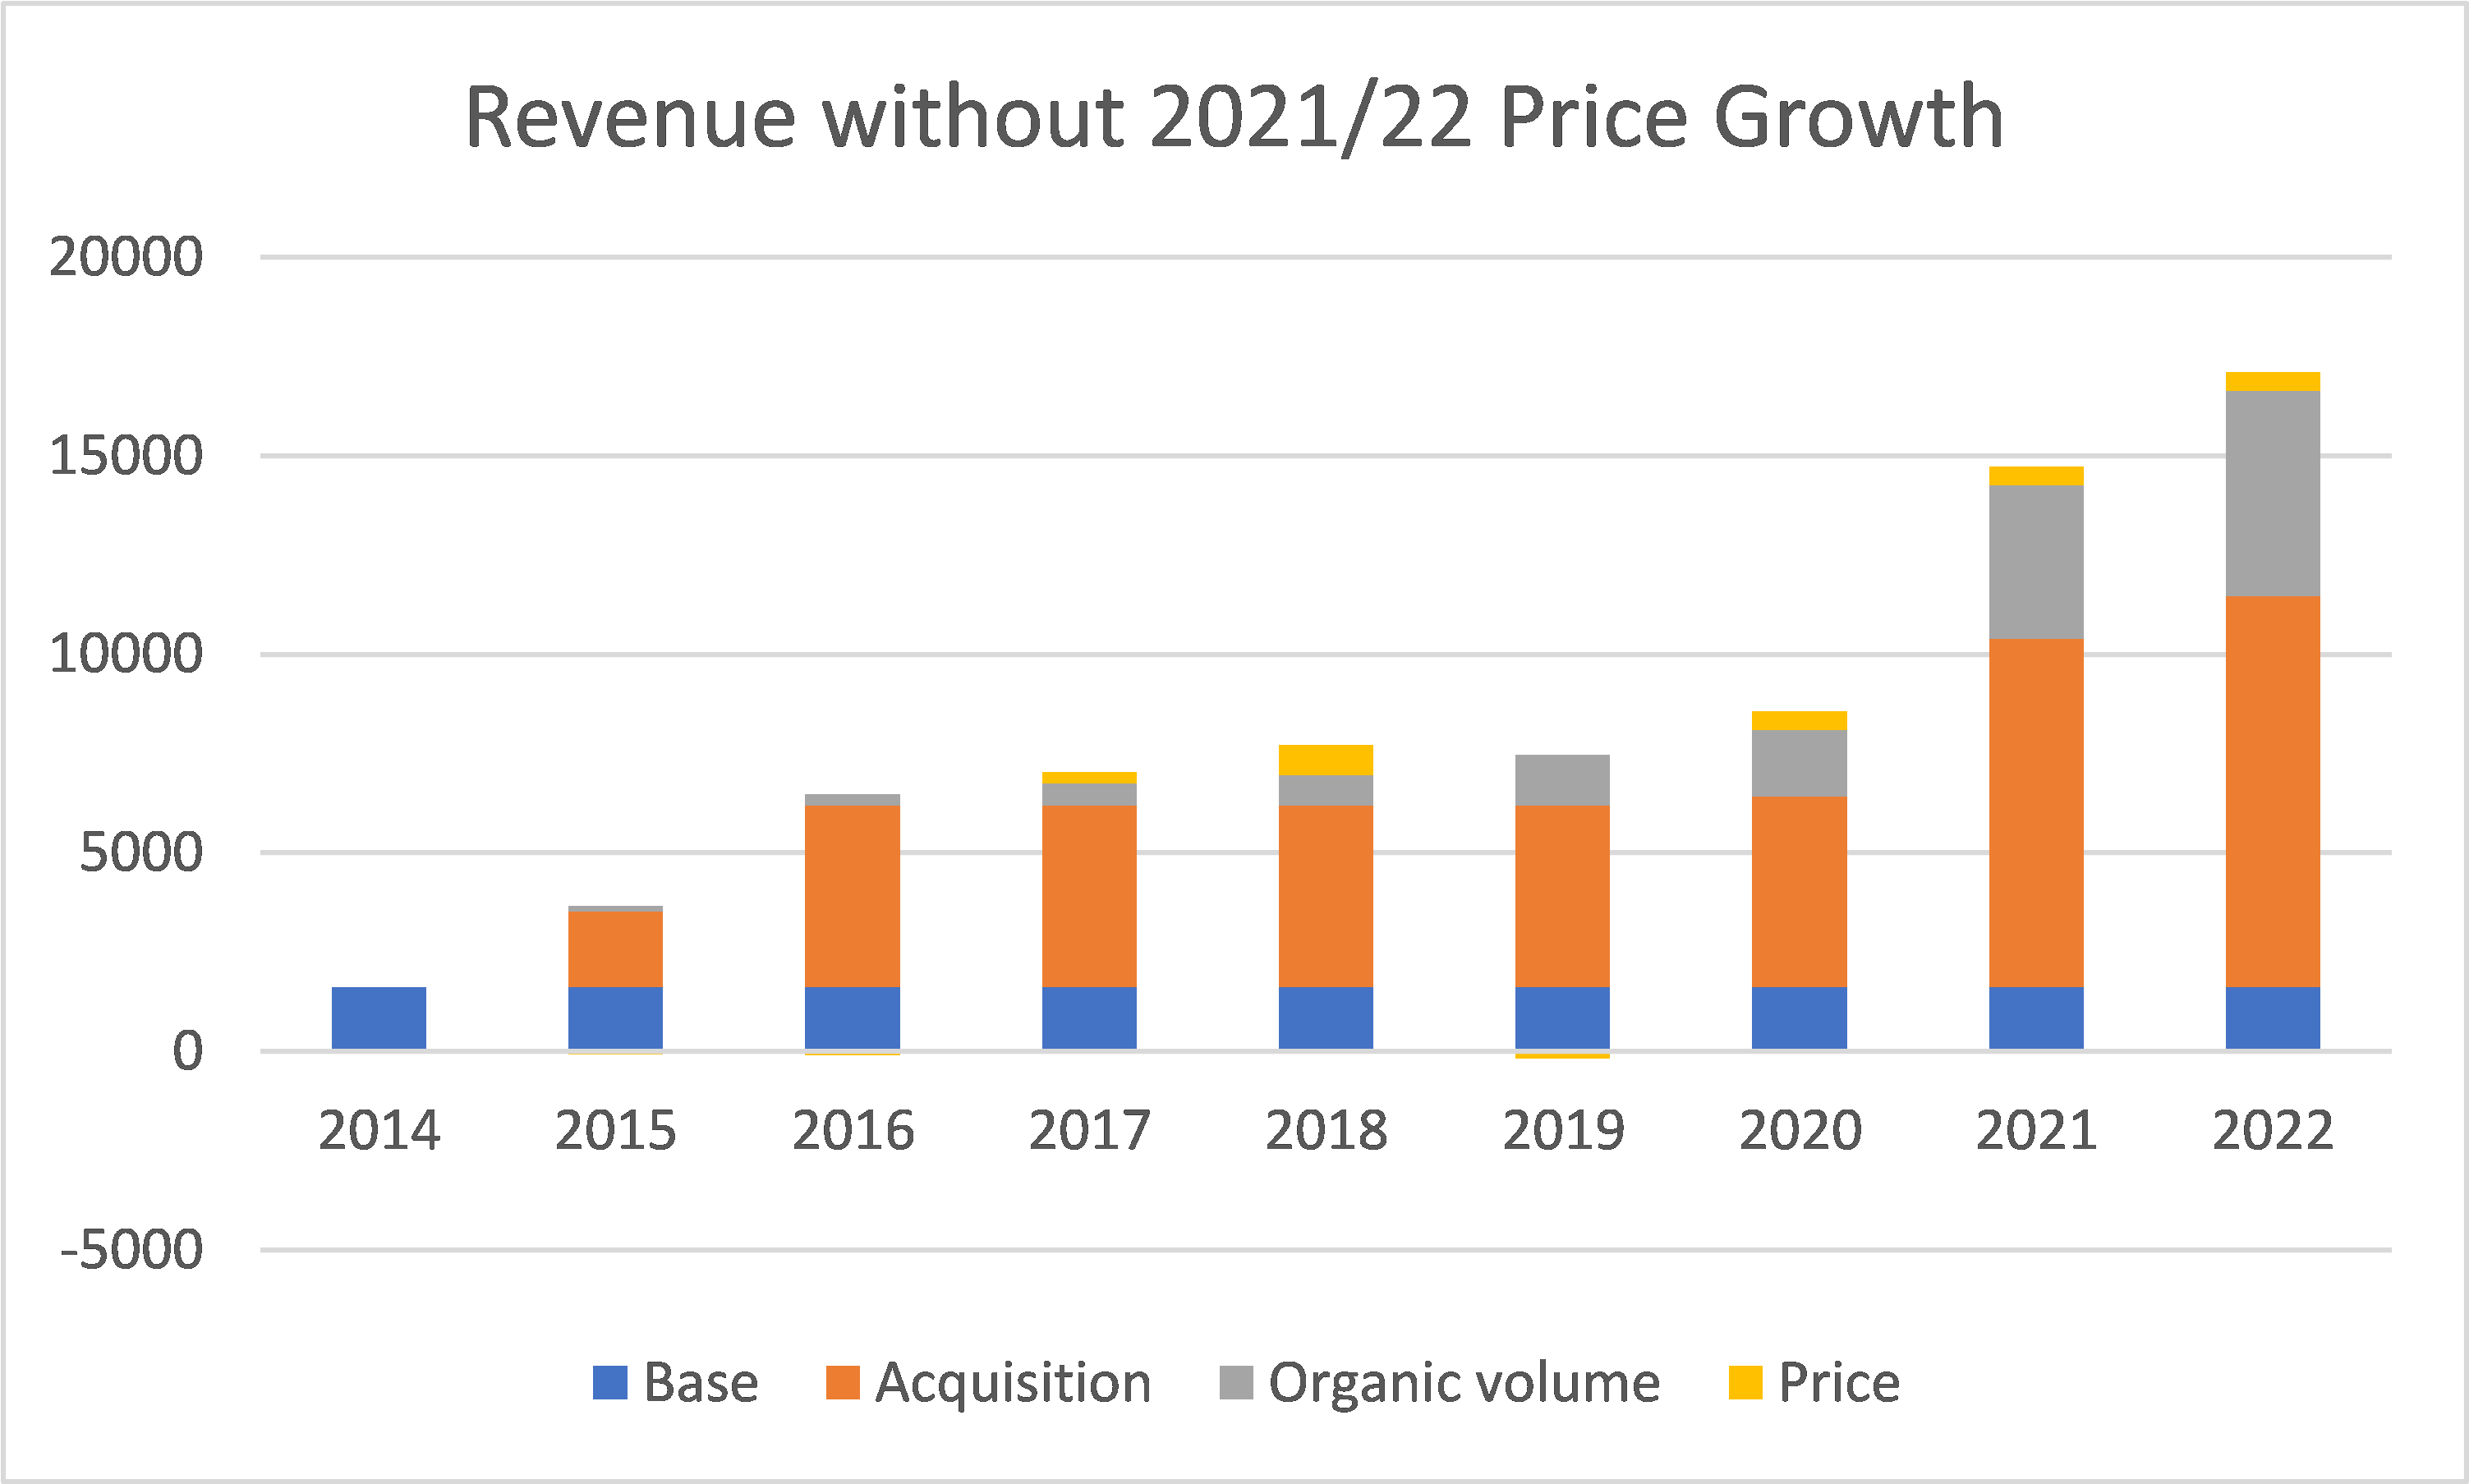
Note to Chart 3: Units are in USD million. I assumed that the acquisitions in 2021/22 also reflected the price growth. As such, I washed out the price growth in the acquisitions for these years. This was achieved by reducing the acquisition growth with the price growth for the respective years.
Funding the growth
Growth needs to be funded. The best is that the growth is funded from internally generated sources.
I used the Reinvestment rate to assess this internal funding.
Reinvestment rate = Reinvestment / EBIT(1-t)
Reinvestment = CAPEX + Acquisitions – Depreciation & Amortization + Net increase in Working Capital.
The CAPEX and Acquisitions are nets of sales of PPE and divestitures.
From 2015 to 2022, BLDR incurred USD 3.2 billion in Reinvestments. The corresponding EBIT(1-t) was USD 7.6 billion with the bulk from 2021 and 2022.
We thus have a Reinvestment rate of 3.2 / 7.6 = 42 %.
A number less than 100% meant that its internally generated funds were sufficient to fund its growth.
If I excluded the 2021 and 2022 years, the Reinvestment rate = 60 %. This rate excluded the major acquisitions in the past 2 years as well as the earnings from the price spike.
If BLDR wants to maintain its current DE ratio, then future acquisitions have to be pegged to its earnings. In other words, for a quantum leap in growth as in 2021, it will require another price spike to generate quantum leap in internally generated funds.
If there was no price spike to generate the massive earnings, BLDR would have to fund any large acquisitions via Debt as it did in 2015.
My point is that funding is not going to be a constraint for BLDR to continue to grow via acquisitions. At the same time, there are no constraints in finding acquisitions as acknowledged by the company in its 2022 Form 10k.
“…the industry remains highly fragmented…As such, the industry presents significant opportunities for growth and several potential acquisitions…”
If BLDR can continue to grow revenue, does it automatically mean that growth with create value?
I will make the case that over the cycle, BLDR performance did not improve. While earnings will be large due to larger revenue, it does not mean that returns will improve.
Did its operations improve?
One of the critiques of my previous article was that BLDR had become more efficient over the past few years. The implication was that the margins or even asset turnover are better than those in the past.
Charts 4 to 6 compared BLDR performance with those of several companies in the wood-based sector. Note that in my previous article, I had identified the peak-to-peak cycle to be 2005 to 2022.
Looking at Chart 4, you can see that BLDR’s gross profit margins were cyclical. While there were uptrends from 2010/11, we see similar patterns for all the other companies. Also, the gross profit margins of all companies improved in 2021/22 when the lumber price spiked.
Excluding the price spike years, BLDR’s gross profit margins in 2020 were just slightly better than its margin in 2006. But the other companies showed similar patterns. BLDR did not gain a competitive advantage.
You could argue that BLDR margins were among the best. But this does not benefit BLDR as its SGA margins were exceptionally higher than the peers.
Chart 4: Peer Gross Profit Margins (Author)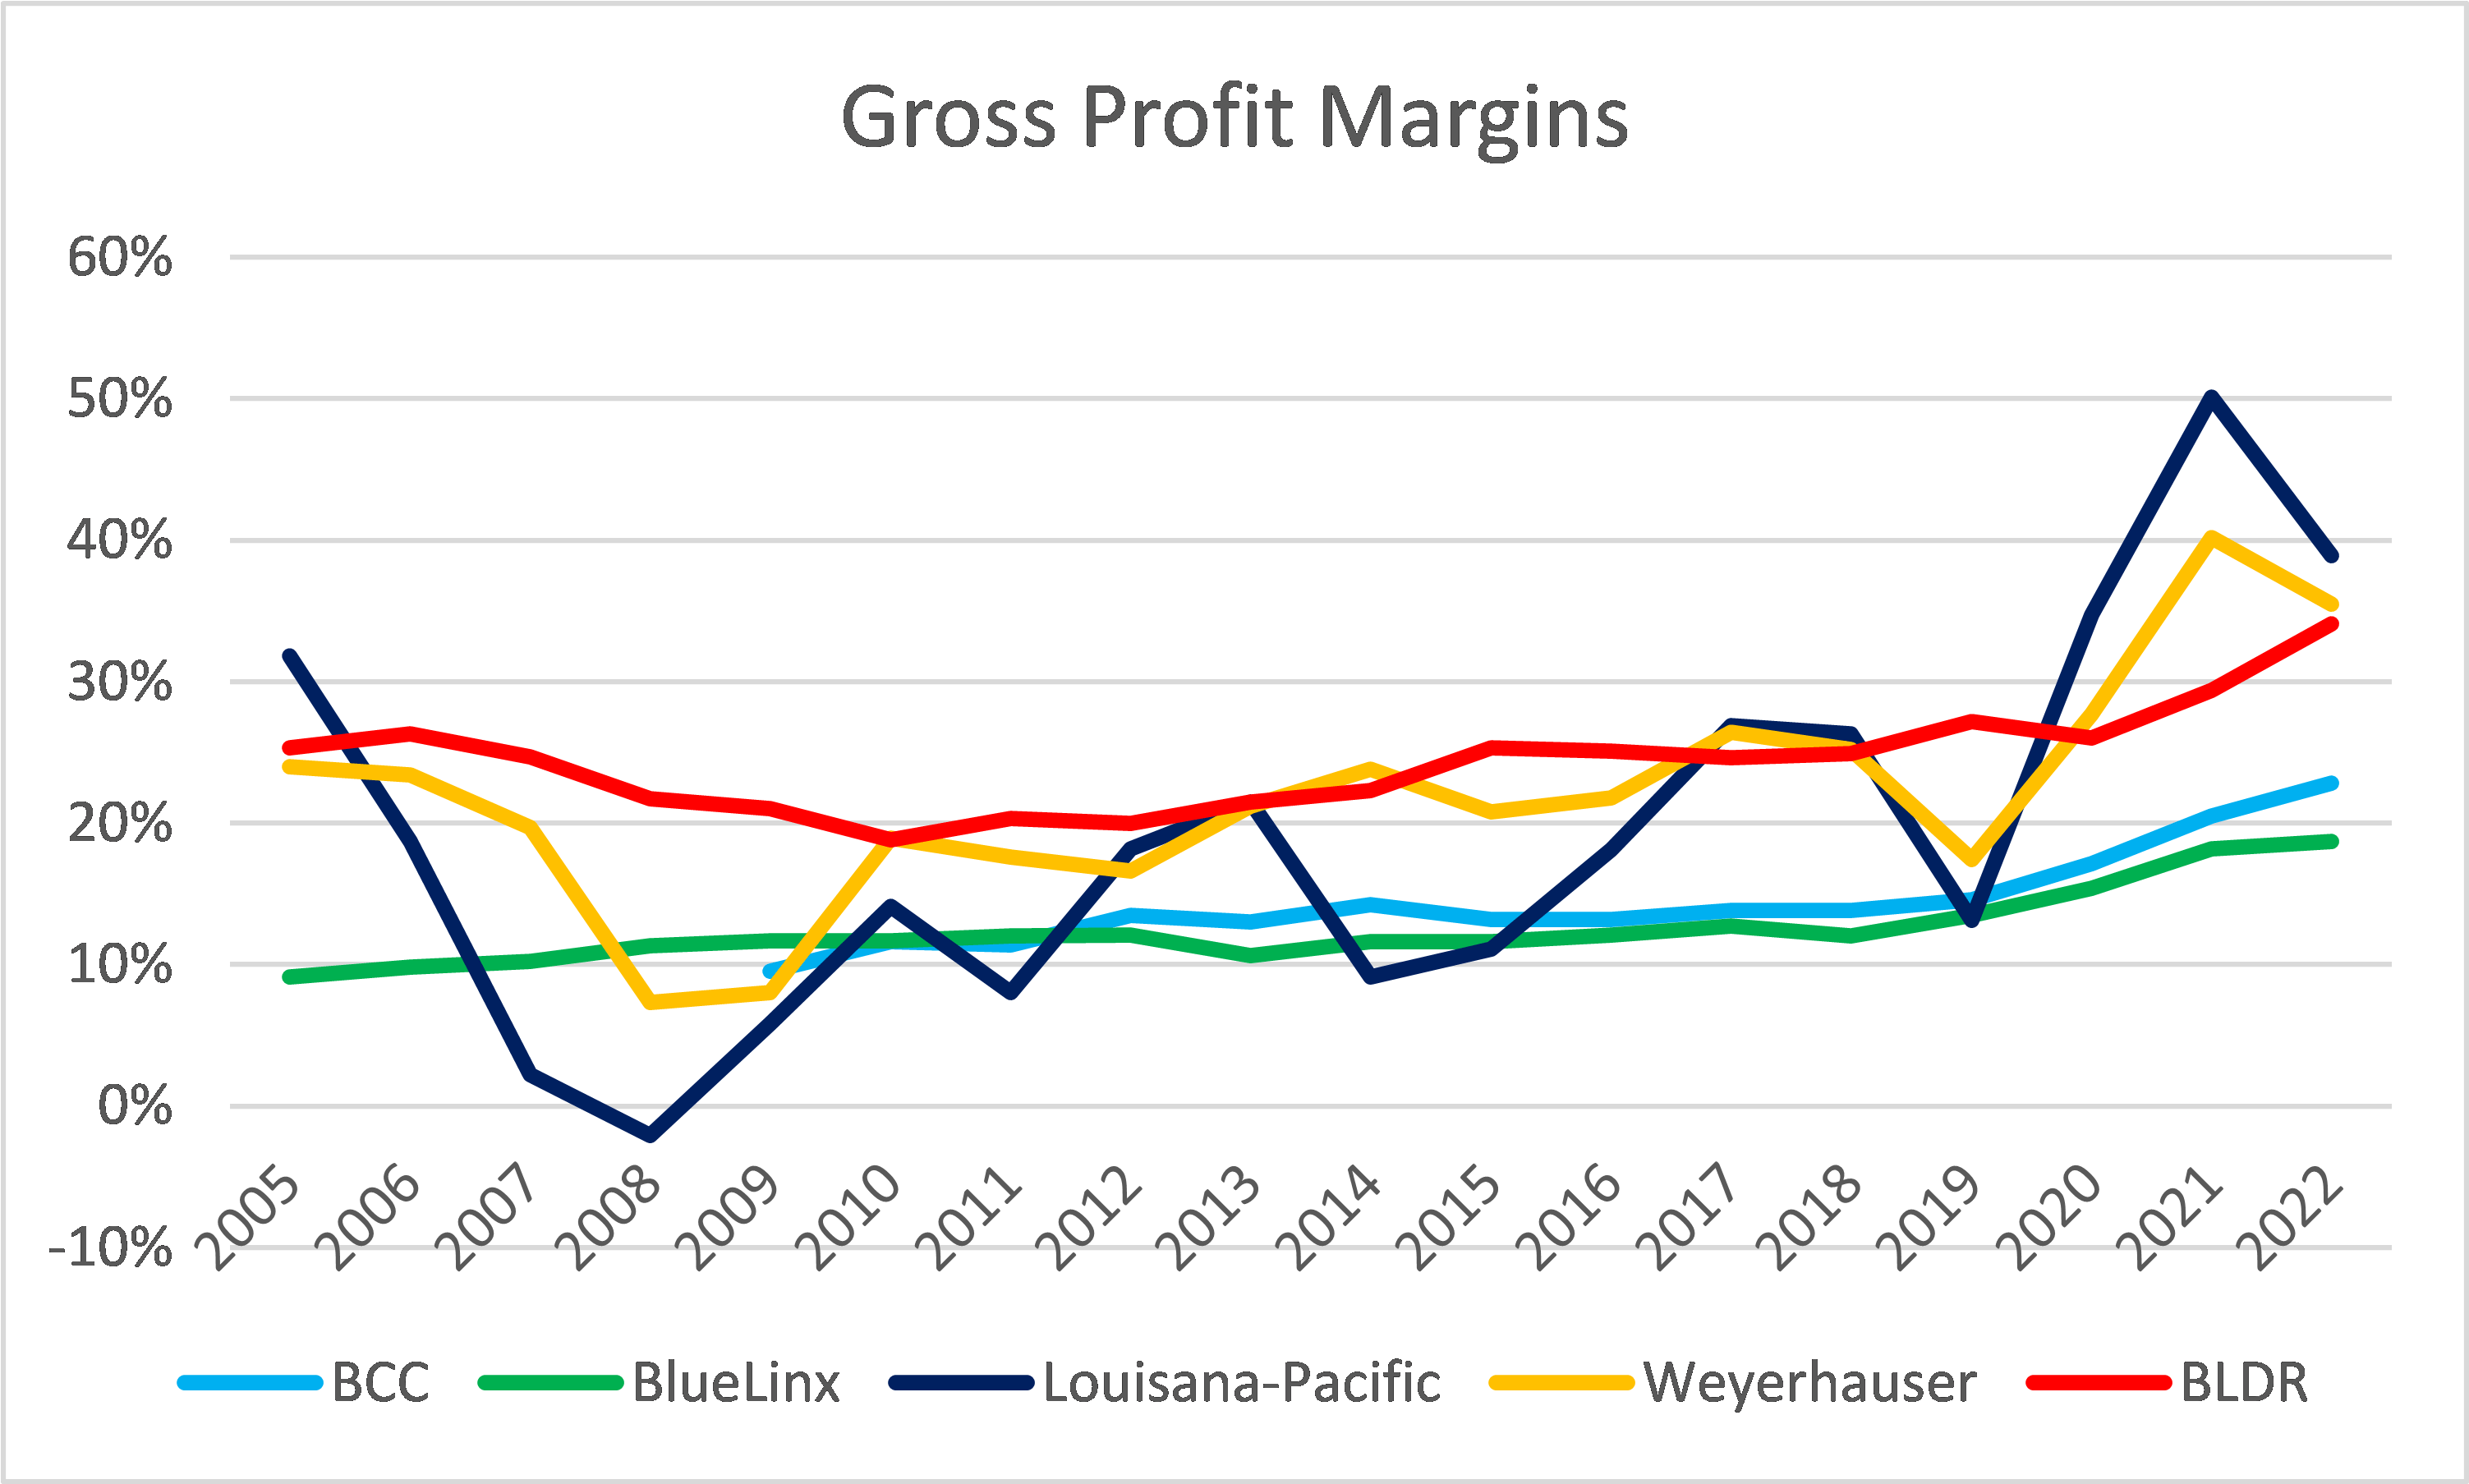
When you consider SGA margins, BLDR had much higher margins than the other companies. Refer to Chart 5.
BLDR SGA margins were cyclical and its 2020 margin was about the same as that for 2005. You can see a significant improvement in 2021/22 in line with the lumber price spike. But then the other companies had similar patterns.
Looking at the level and pattern of the SGA margins, I am not sure whether you can conclude that BLDR had any competitive advantage.
Chart 5: Peer SGA margins (Author)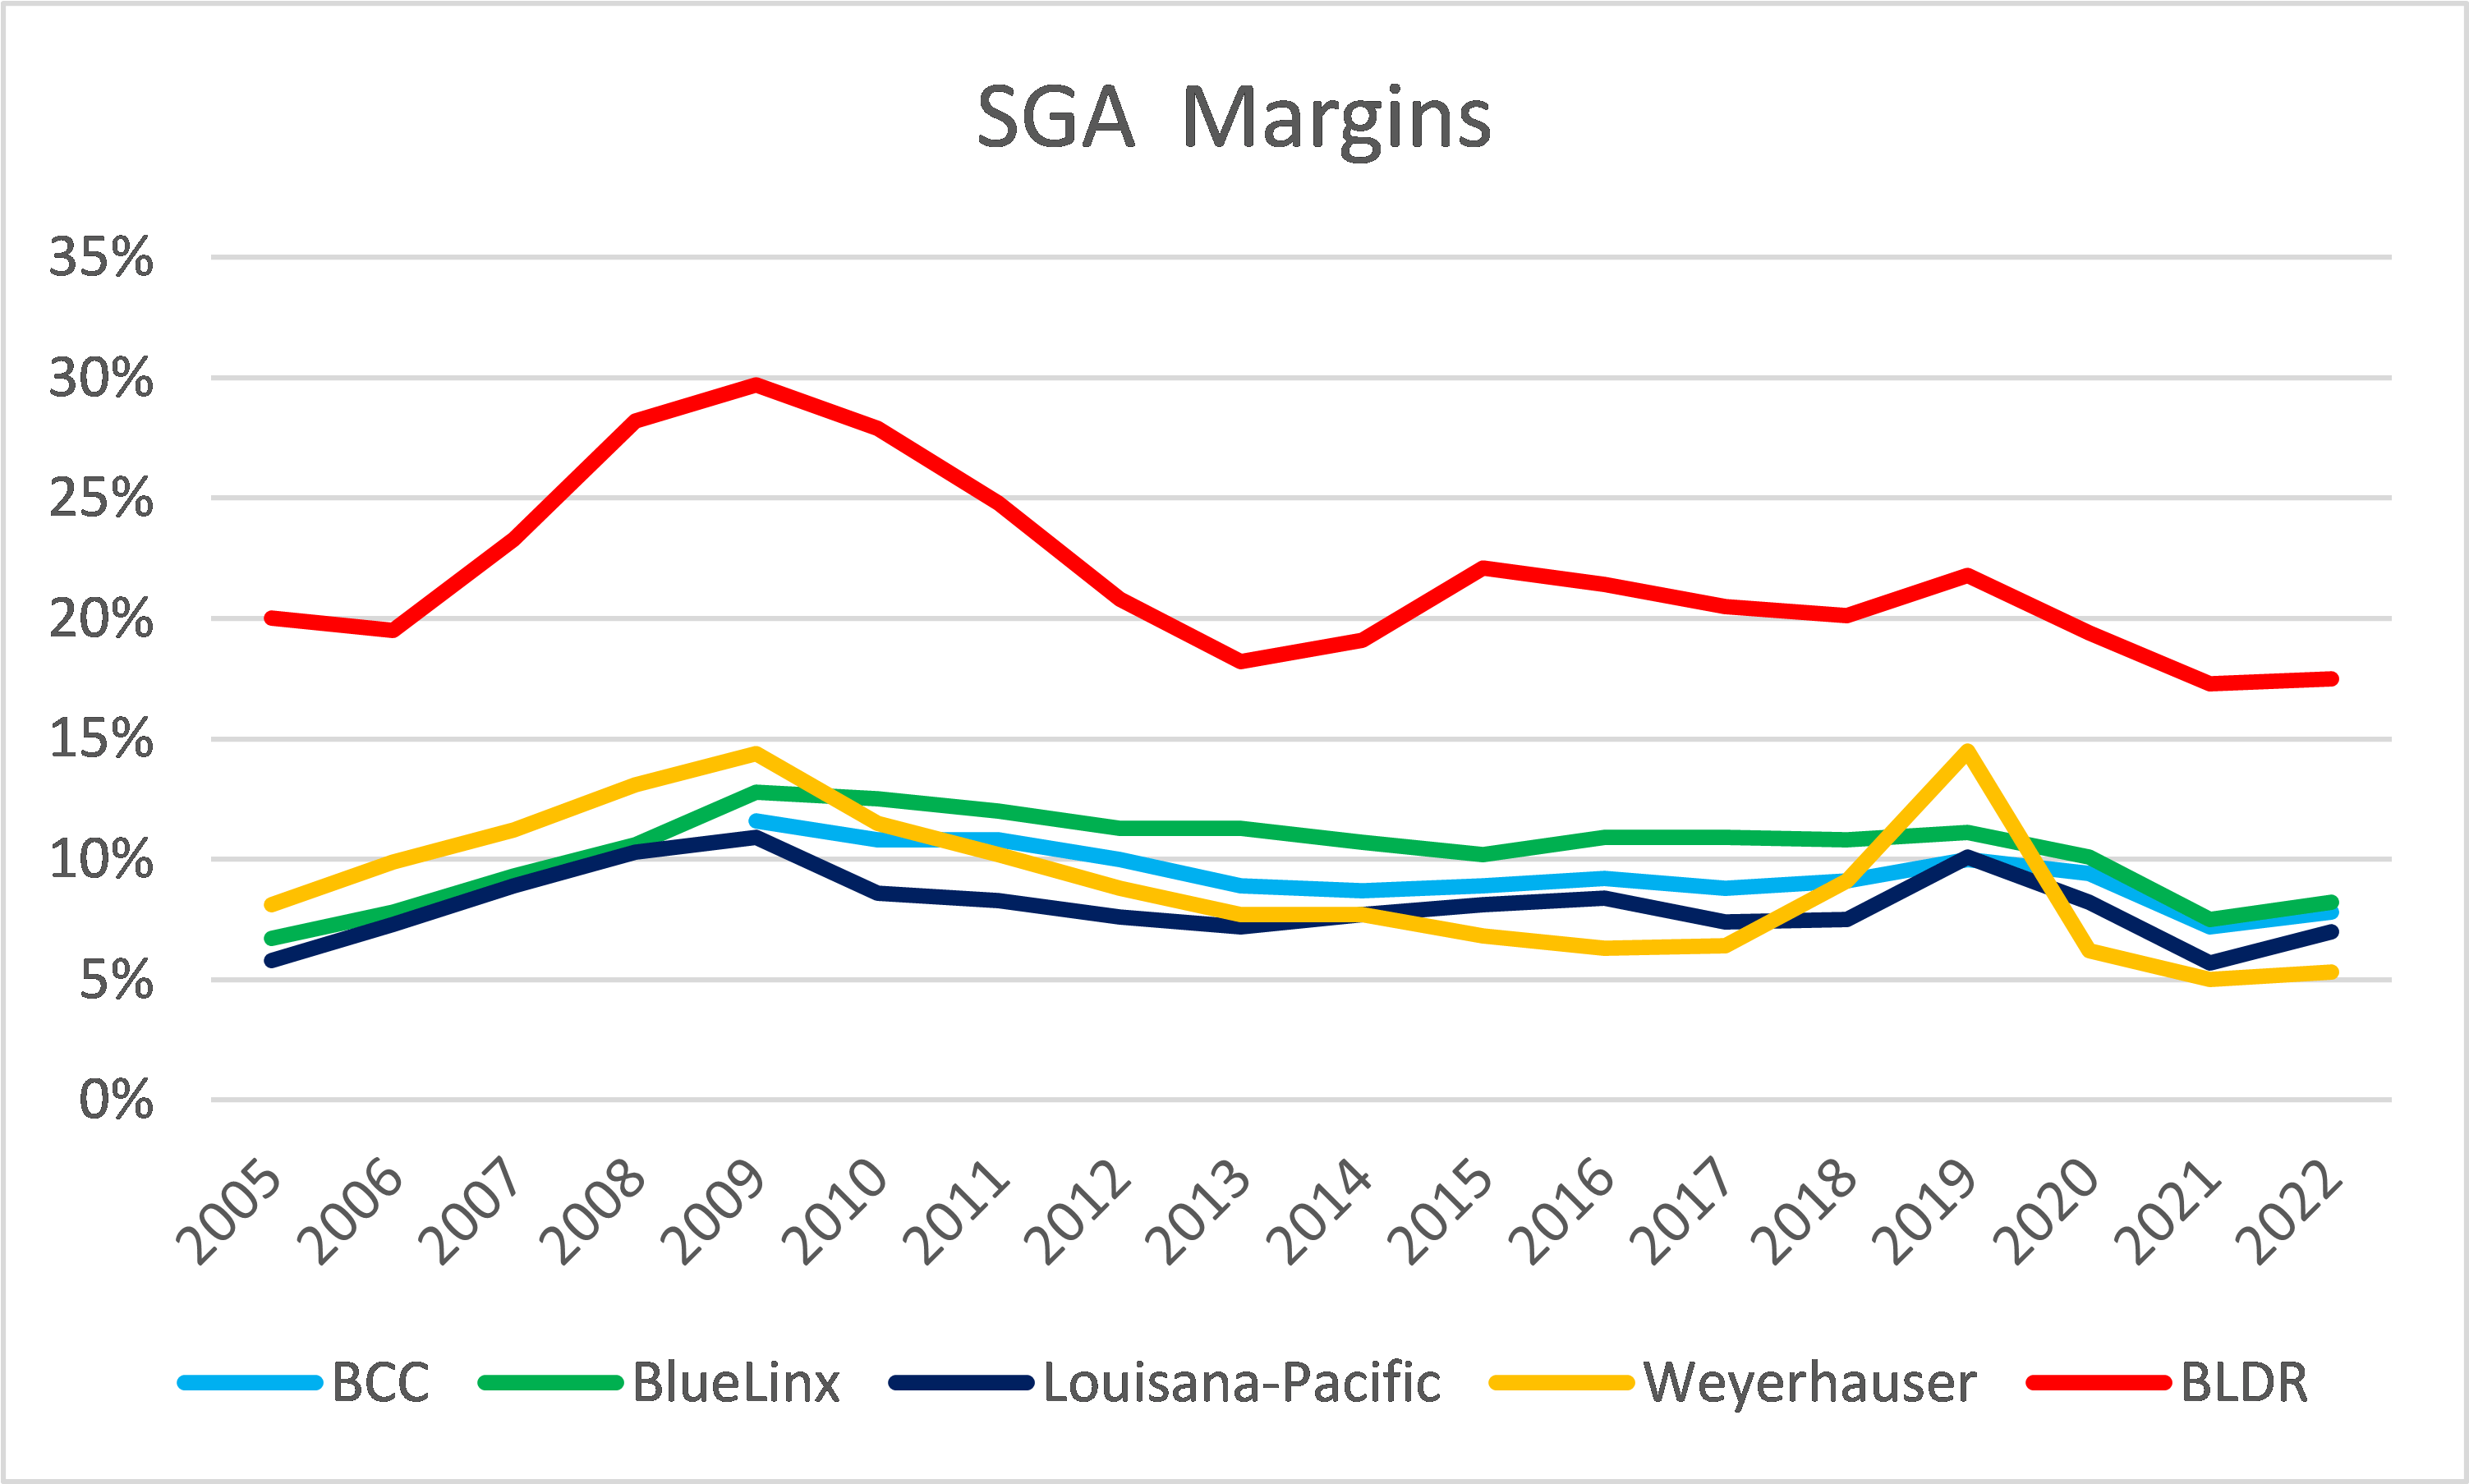
In terms of Asset Turnover, BLDR performance had declined. Its Asset Turnover seemed to have declined from 2005. This could be because the increase in revenue from the acquisitions did not match the investments.
BLDR Asset Turnover lies in between its peers. However in terms of trends, 2 of the peers were “stable”, one declined and the other improved.
Again, I would conclude that BLDR did not gain any competitive advantage.
Chart 6: Peer Asset Turnover (Author)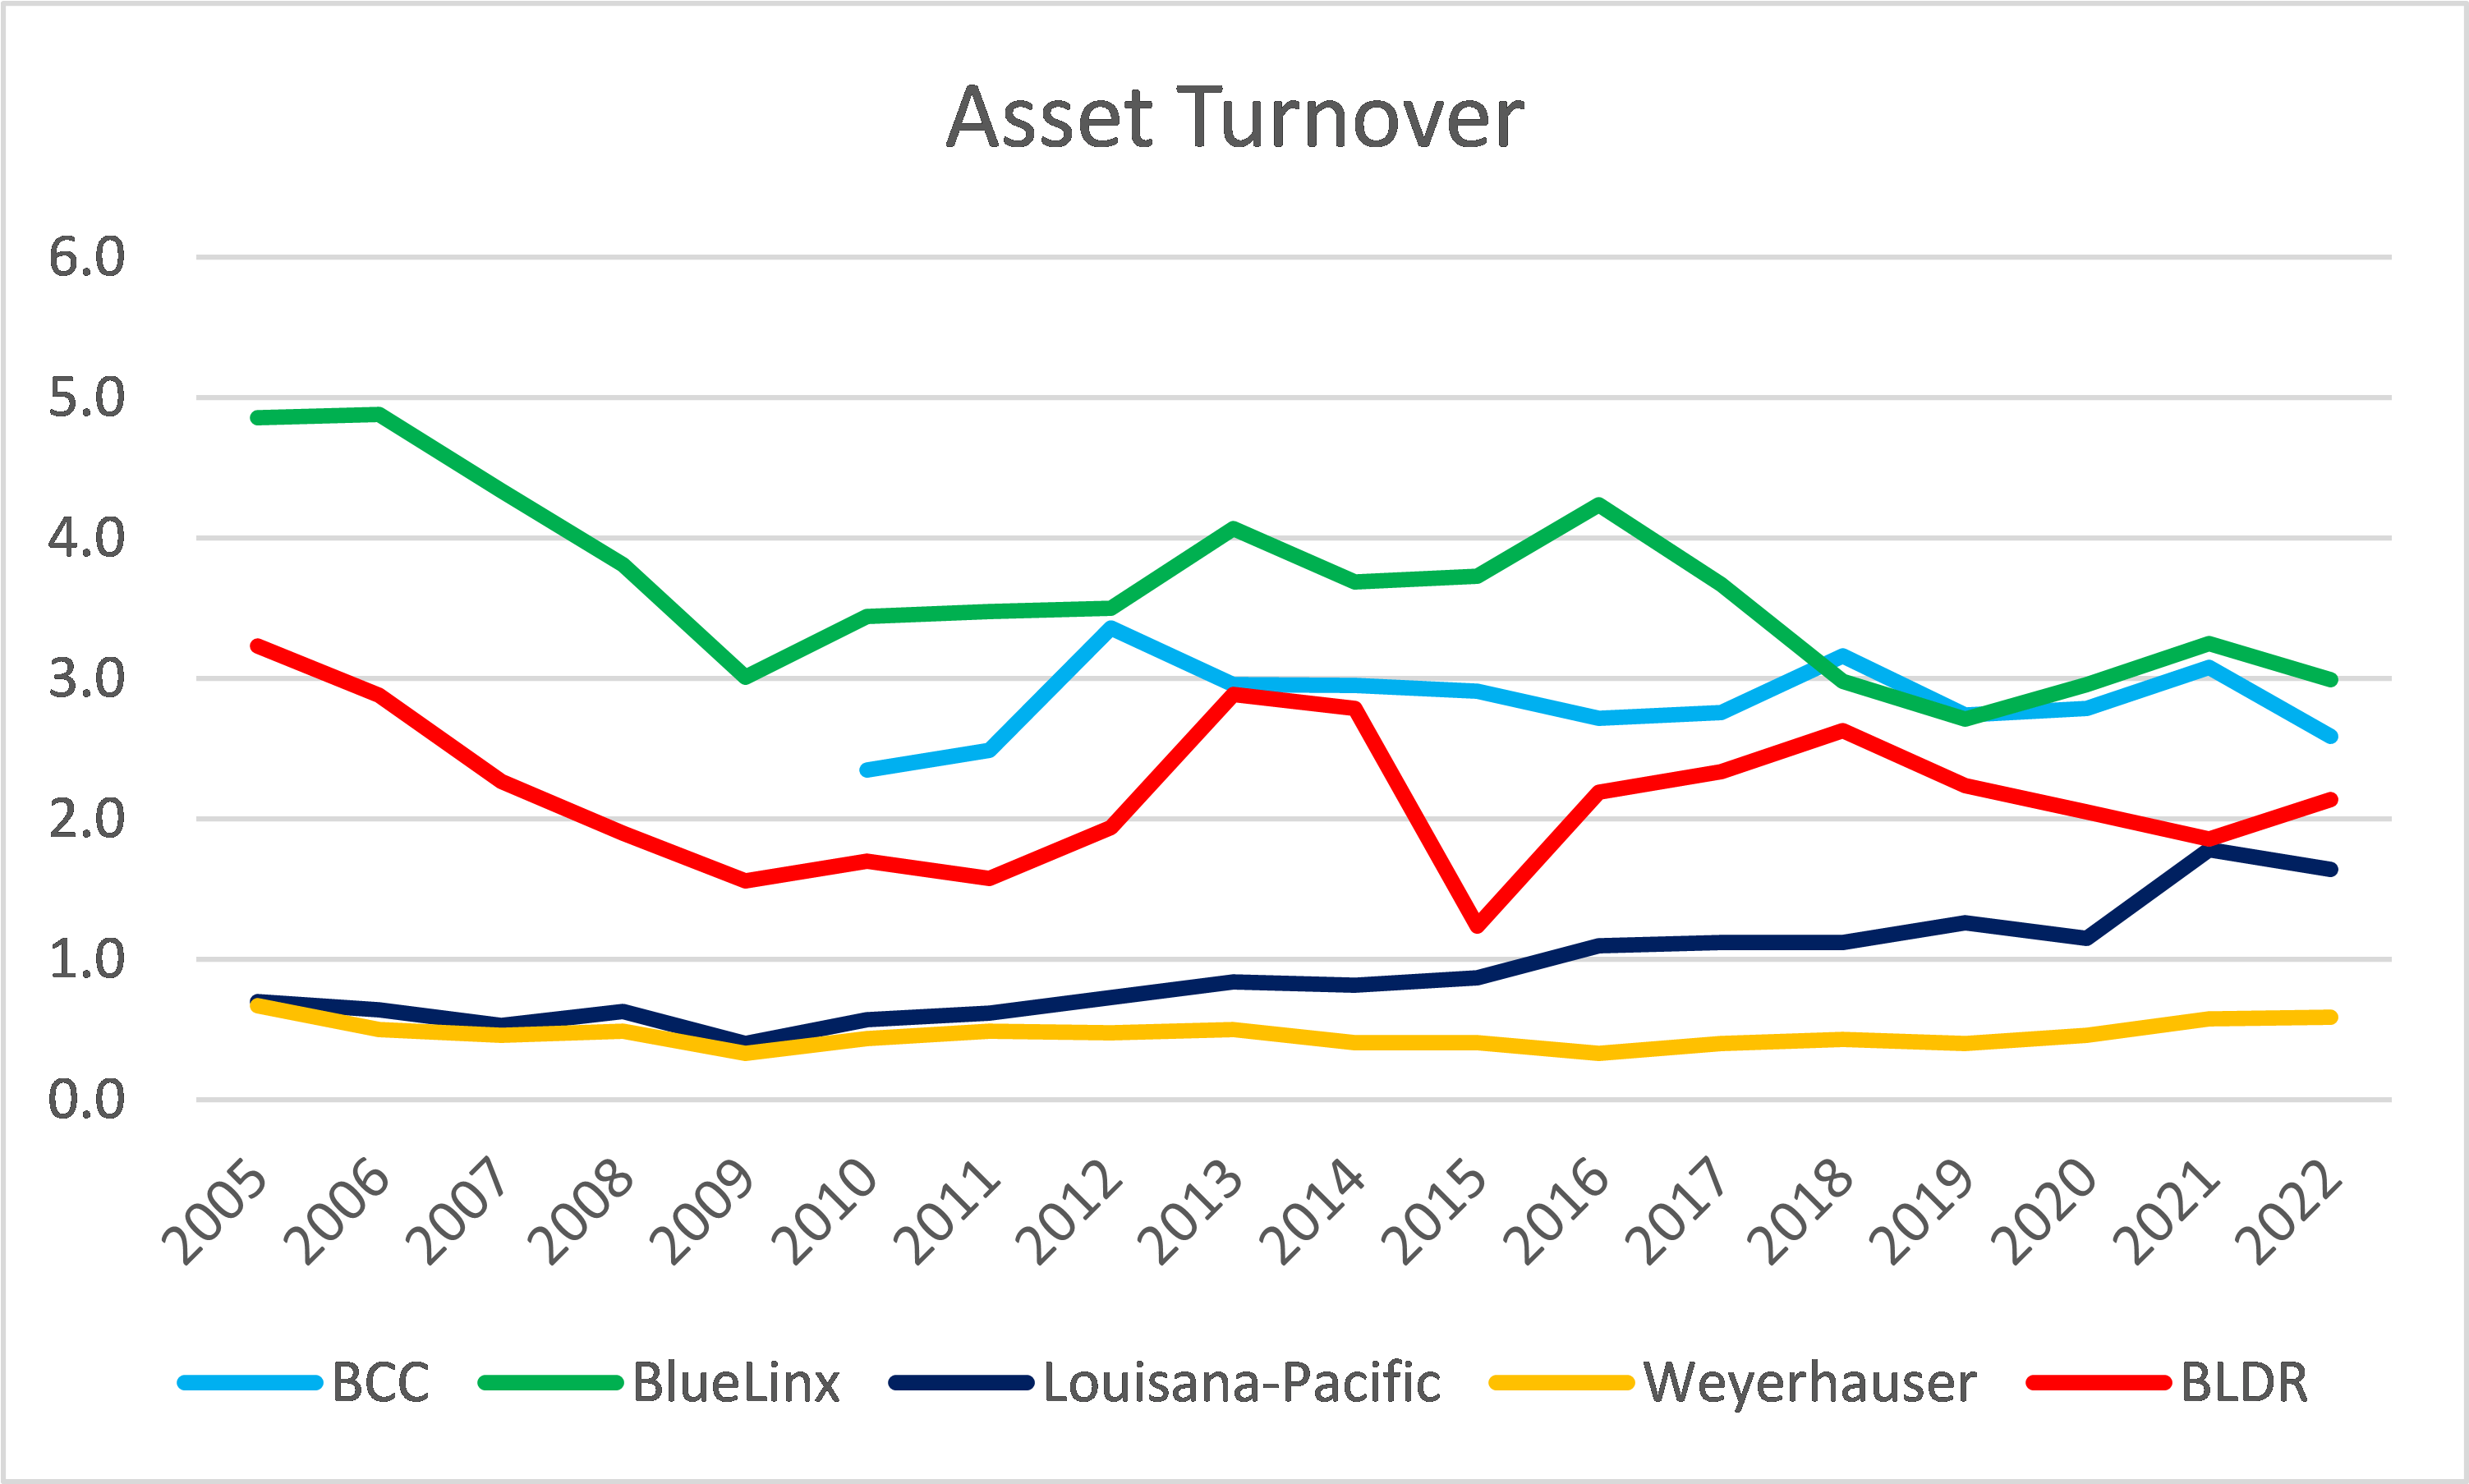
AV-EPV Comparison
To determine whether BLDR is a growth company I used the Greenwald AV and EPV analysis.
Table 2 summarizes the results for the 2 Scenarios. Note that Greenwald uses the Reproduction Value as the AV. For simplicity, I used the Book Value.
You can see that based on the normalized situation we have AV = EPV. But if you believe that the past 2 years’ performance is a better representation of the future, you will have EPV > AV.
Table 2: Greenwald AV-EPV analysis for BLDR (Author)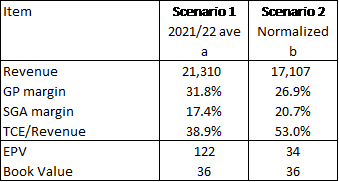
Notes to Table 2:
a) Based on the 2021 and 2022 average values.
b) The revenue is as derived earlier. The details of the other margins and TCE/Revenue are presented in the section titled “Estimating the EPV – Normalized Scenario.”
The AV-EPV analysis is the first step. I have shown that BLDR did not have any strong competitive advantages when it comes to operations. This is a highly competitive sector as acknowledged by BLDR in its 2022 Form 10k:
“…intense competition in the industry, including expansion and growth strategies by competitors…”
But when you looked into what BLDR considers competitive advantages, there do not seem to be any large barriers to entry. Whatever are cited by the company can be copied.
“…we have competitive advantages over our competitors due to our long-standing customer relationships, local market knowledge, competitive pricing, superior service, broad product offering, and large-scale procurement capabilities.”
I believe that Scenario 2 is more appropriate one to represent its future performance.
Estimating the EPV – Normalized Scenario
I derived the EPV based on the Free Cash Flow to the Firm model. It is the same model that I used in my previous article. Refer to it for details of the computation.
There are 4 key metrics in the valuation model:
- Revenue
- GP and SGA margins
- TCE/Revenue
The revenue of USD 17,017 million was derived after washing out the 2021 and 2022 price effects.
The GP margins, SGA margins, and TCE/Revenue were based on projecting the 2021/22 average into a cyclical one. I used a scaling factor as per Table 3.
The scaling factor was based on the average 2005/06 peak values divided by the average 2005 to 2022 cycle values. The average values were based on the 2005 to 2022 data from following companies.
- BLDR
- BlueLinx
- Louisiana-Pacific
- Weyerhaeuser
Table 3: Determining the cycle values (Author)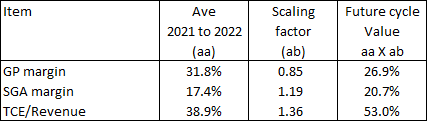
Note to Table 3:
a) TCE = Total Capital Employed = Equity + Debt – Cash and cash equivalents.
b) I did not include Boise Cascade in the Scaling factor as its data was only available from 2009.
Margins of safety
Under Greenwald approach, the margin of safety is based on comparing the returns with the cost of equity.
Table 4 summarizes the results. You can see that there is no margin of safety under the Normalized Scenario.
While I have presented the comparison for Scenario 1, this is for illustration purposes only. I have shown that this scenario does not reflect the future.
Table 4: Margins of safety (Author)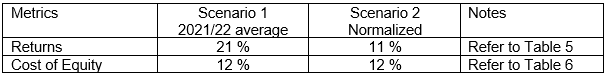
Note that in Greenwald approach, once the company is not a growth stock, there is no need to proceed with the return analysis. You take the EPV as the value of the company. However, I proceeded with the return analysis to illustrate the full approach.
Estimating the returns
The expected return is based on the Greenwald formula
return = b(E/P) + (1-b)(E/P)(ROE/r) + g.
Table 5 details the steps in the computation of the returns for the 2 Scenarios.
Table 5: Computing returns based on Greenwald formula (Author)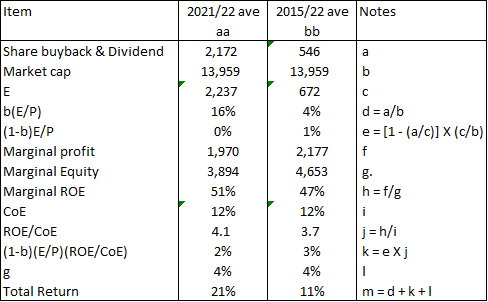
The cost of equity was based on the results of the first page of a Google search for the term “BLDR WACC”. I took the average values as per Table 6.
Table 6: Estimating the cost of equity (Various sources)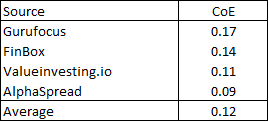
Conclusion
BLDR growth has resulted in its 2022 revenue being much larger than that of 2015. The company has grown bigger and in 10 years BLDR would likely be a much bigger company than it is in 2022.
But bigger does not automatically mean better operating margins or asset utilization. In the case of BLDR, excluding the price spike effect, there do not seem to be any efficiency improvements over the cycle.
A growth stock is not only about revenue growth. This growth must translate into better returns. Otherwise there is no value created for the shareholders.
Greenwald approach separates the analysis of growth stocks into 2 steps:
- First determine that there is an economic basis for the growth. This starts with the AV-EPV analysis and then digs into whether there are moats to sustain the growth.
- If there is growth, then look for the margins of safety in the return space.
An AV-EPV analysis showed that BLDR is not a high-growth company. Not surprisingly there is no margin of safety from the return analysis.
My conclusion hinges on viewing BLDR as a cyclical growth company. The numbers suggest that while it can have revenue growth, there are doubts about better efficiencies.
The company can earn more via bigger revenue, but this will not translate into additional value for the shareholders. Growth does not always create value. For growth to create value, we must have returns greater than the cost of funds. This is not the case with BLDR stock.
Be the first to comment