

BTCUSD: Double Bottom Pattern Above $36,200
Bitcoin continues its bullish momentum this week in the form of a rally, and touched a high of $45,387 in today’s European trading session.
Global buying pressure is observed in bitcoin, and support at lower levels which has managed to push up the prices of BTCUSD above the $44,000 handle.
BTCUSD touched an intraday low of $43,575 in the Asian trading session, and an intraday high of $45,387 today.
We can clearly see a double bottom pattern above $36,200, which is a bullish reversal pattern because it signifies the end of a downtrend and a shift towards an uptrend.
Both Stoch and Williams percent Rrange are indicating OVERBOUGHT levels which means that in the immediate short-term a decline in the prices is expected.
The relative strength index is at 60 indicating a STRONG demand for bitcoin at the current market level.
Bitcoin is now moving above its 100 hourly simple moving average and below its 200 hourly exponential moving averages.
The average true range is indicating lesser market volatility with a bullish zone formation.
- Bitcoin bullish momentum continues above $36,200
- Highs/Lows are indicating a NEUTRAL level
- The price is now trading just below its pivot level of $44,846
- All of the moving averages are giving a BUY market signal
Bitcoin Rally Seen Above $36,200
Bitcoin continues its strong bullish momentum, having crossed the $45,000 handle in today’s European trading session.
The immediate short-term outlook for bitcoin is bullish, the medium-term outlook is neutral, and the long-term outlook remains strongly bullish.
The daily RSI is printing at 64 which means that long-term investors have returned to the markets, which can push the prices of BTCUSD above the $50,000 handle.
All of the major technical indicators are giving a STRONG BUY signal, which means that in the immediate short-term we are expecting targets of $45,000 and $48,000.
The price of BTCUSD is now facing its classic resistance level of $45,033 and Fibonacci resistance level of $45,145, after which the path towards $48,000 will get cleared.
In the last 24hrs, BTCUSD has gone UP by 3.81% with a price change of $1,622, and has a 24hr trading volume of USD 31.862 billion. We can see an increase of 48.60% in the trading volume as compared to yesterday, due to increased buying pressure in global cryptocurrency markets.
The total market capitalization of bitcoin has now crossed the $800 billion mark and is currently at 838.161 billion USD.
The Week Ahead
The prices of bitcoin are at present moving in a contraction phase after touching the level of $45,000. We can see some short-selling which is the reason for a pullback to the current market level of $44,150.
We have detected MA5 and MA10 crossover patterns at $44,671 and $44,345, which signifies the visible contraction seen in the prices of bitcoin.
In the medium-term, bitcoin’s bullish momentum is expected to continue pushing past the $50,000 handle this week.
The prices of BTCUSD will need to remain above the important support level of $40,000 this week.
We can expect more upsides in the range of $45,000 to $48,000 in the next week.
Bitcoin’s Rally Mode
The prices of bitcoin continue to surge from their lowest level seen on 24th Jan when it touched a low of $33,503.
At the current market price of $44,140 we can see a gain of 31% which is why we can say that bitcoin is in a rally mode, and the prices can continue appreciating towards $50,000 and $55,000 in the coming weeks.
Historically, this is seen as the longest rally after Sept 2021, due to increased global investor sentiments.
Technical Indicators:
- Commodity channel index (14-day): at 53.50 indicating a BUY
- Average directional change (14-day): at 45.17 indicating a BUY
- Rate of price change: at 0.495 indicating a BUY
- Moving averages convergence divergence (12,26): at 502.00 indicating a BUY
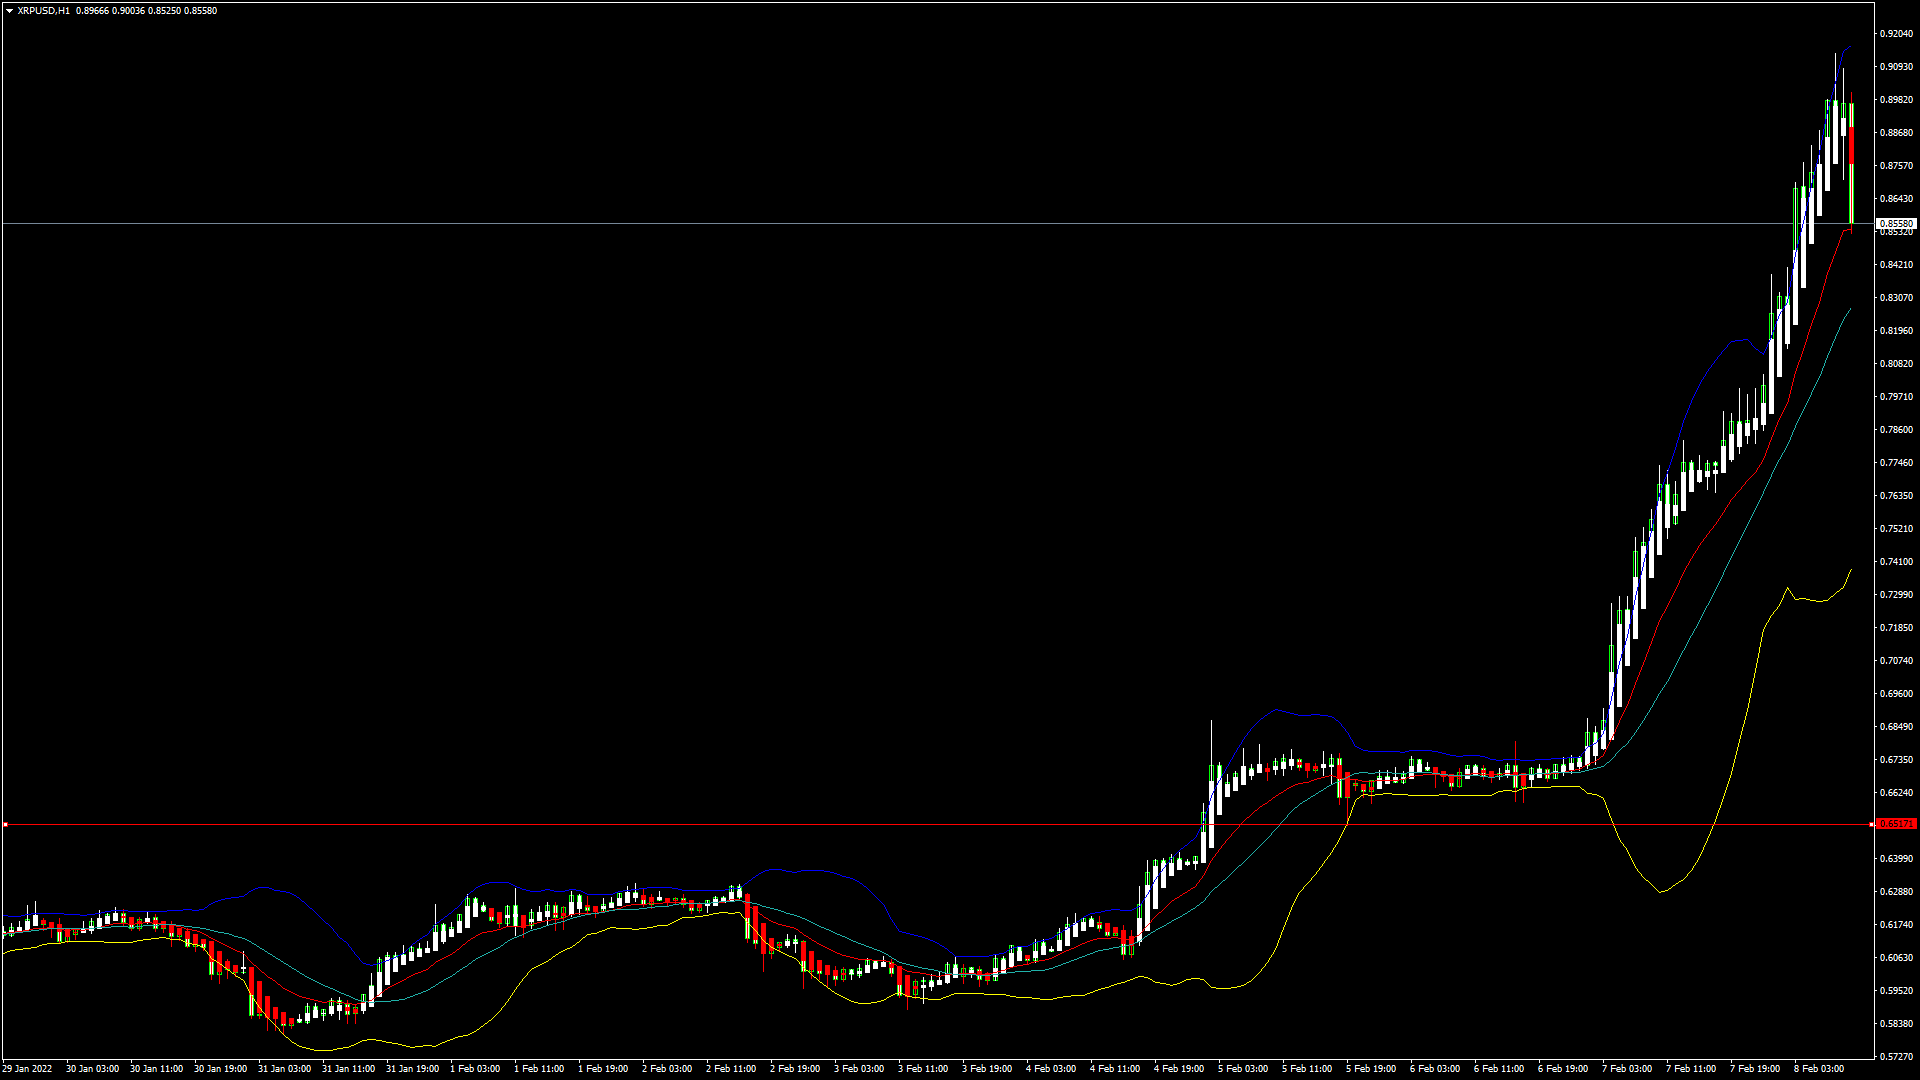
XRPUSD: Bullish Engulfing Pattern Above 0.6500
Ripple continues to gain momentum after its consolidation phase, and we can see a rally in the markets at levels above 0.6500.
Today Ripple touched an intraday high of 0.9123 in the European trading session, and an intraday low of 0.8157 in the Asian Trading session.
We can clearly see a bullish engulfing pattern above 0.6500 because it signifies a rise in the buying pressure and a shift towards an uptrend.
The short-term outlook for Ripple remains bullish, the medium-term outlook remains neutral, and the long-term outlook is strongly bullish.
The relative strength index is at 68 which signifies a STRONG demand for Ripple at the current market prices.
All of the moving averages are giving a STRONG BUY signal at the current market level of 0.6208.
The 50-day simple moving average is also indicating a BUY at the levels above 0.7511.
Ripple is now trading just below its pivot level of 0.8919, facing its Classic resistance level of 0.9128 and Fibonacci resistance level of 0.9283 in the European trading session.
- All of the technical indicators are giving a STRONG BUY signal
- Ripple continues bullish momentum above 0.6500
- Williams percent range is giving an OVERBOUGHT signal
- The average true range indicates HIGH market volatility
Ripple: Rally Seen Above 0.6500
In today’s European trading session, Ripple is now moving with a strong bullish momentum above the 0.8000 handle.
The price of Ripple continues surging, crossing all the major resistance levels and is now moving towards the 1.000 handle. The gain that we see in Ripple is expected to continue into next week which can push its price in the range of 1.0500 to 1.1500.
The daily RSI is printing at 71 which has created a very strong demand for Ripple in the long-time frame, and is the reason why its prices continue to surge.
The price of XRPUSD has gone UP by 11.44% with a price change of $0.08786 in the past 24hrs, and has a trading volume of 5.595 billion USD.
We can see a 140.67% increase in the trading volume of Ripple in the last 24 hours due to the heavy buying pressure seen across global cryptocurrency markets.
This Week Ahead
The prices of XRPUSD are now expected to enter into a consolidation channel below the 0.9000 handle, which may continue for some time.
After the phase of consolidation is over, a fresh buying pressure will be seen pushing the prices of Ripple towards 0.9500 and 1.0500.
This week, the price of Ripple needs to remain above the crucial support level of $0.8000, after which we can see a progression of the bullish momentum.
The weekly outlook for Ripple is projected at 0.8200 with a consolidation zone of 0.8500
Ripple’s SEC Case
The ongoing court battle of the Ripple Labs vs the US Securities and Exchange Commission may be in the favor of the Ripple Labs, as the judge has granted Ripple permission to respond to the SEC’s Memorandum of Law.
This is a bullish moment for Ripple, and have already seen the prices rise by more than 30% in less than a week.
Many leading crypto analysts are predicting a favorable outcome to the US SEC case with a target of $1.0700 to $1.0900.
Technical Indicators:
- Moving averages convergence divergence (12,26): at 0.001 indicating a BUY
- Ultimate oscillator: at 68.26 indicating a BUY
- Average directional change (14-day): at 38.00 indicating a BUY
- Rate of price change: at 38.66 indicating a BUY
Be the first to comment