

ersler/iStock via Getty Images
The investment thesis
The thesis of this article is twofold:
- Under the current conditions, both British American Tobacco (NYSE:BTI) and Altria (NYSE:MO) provide far superior returns for long-term investors than the overall market. The key argument is built on the following chart. This chart is also the roadmap that we use in our marketplace service to pick our tactical holdings. You will see from the following chart, both are projected to provide about 16% annual return (“ROI”) in the long term, while the overall market is only about 5% to 6%. The fundamental reason is both BTI and MO enjoy far superior ROCE (return on capital employed) over the market average, which gives it the ability to grow without the need for too much capital and subsequently can return most of the earnings to shareholders (either as dividends or share buybacks).
- Then we will detail the reasons why we only own BTI even though we like both. As you will see, the primary reason is that BTI offers better geographical diversification of our portfolio relative to our other holdings. As a secondary reason, we like BTI better because its current owners’ earning yield plays a larger role in its long-term return projection, making BTI more of a conservative investment and MO more of a growth investment – in relative terms against each other.
Source: author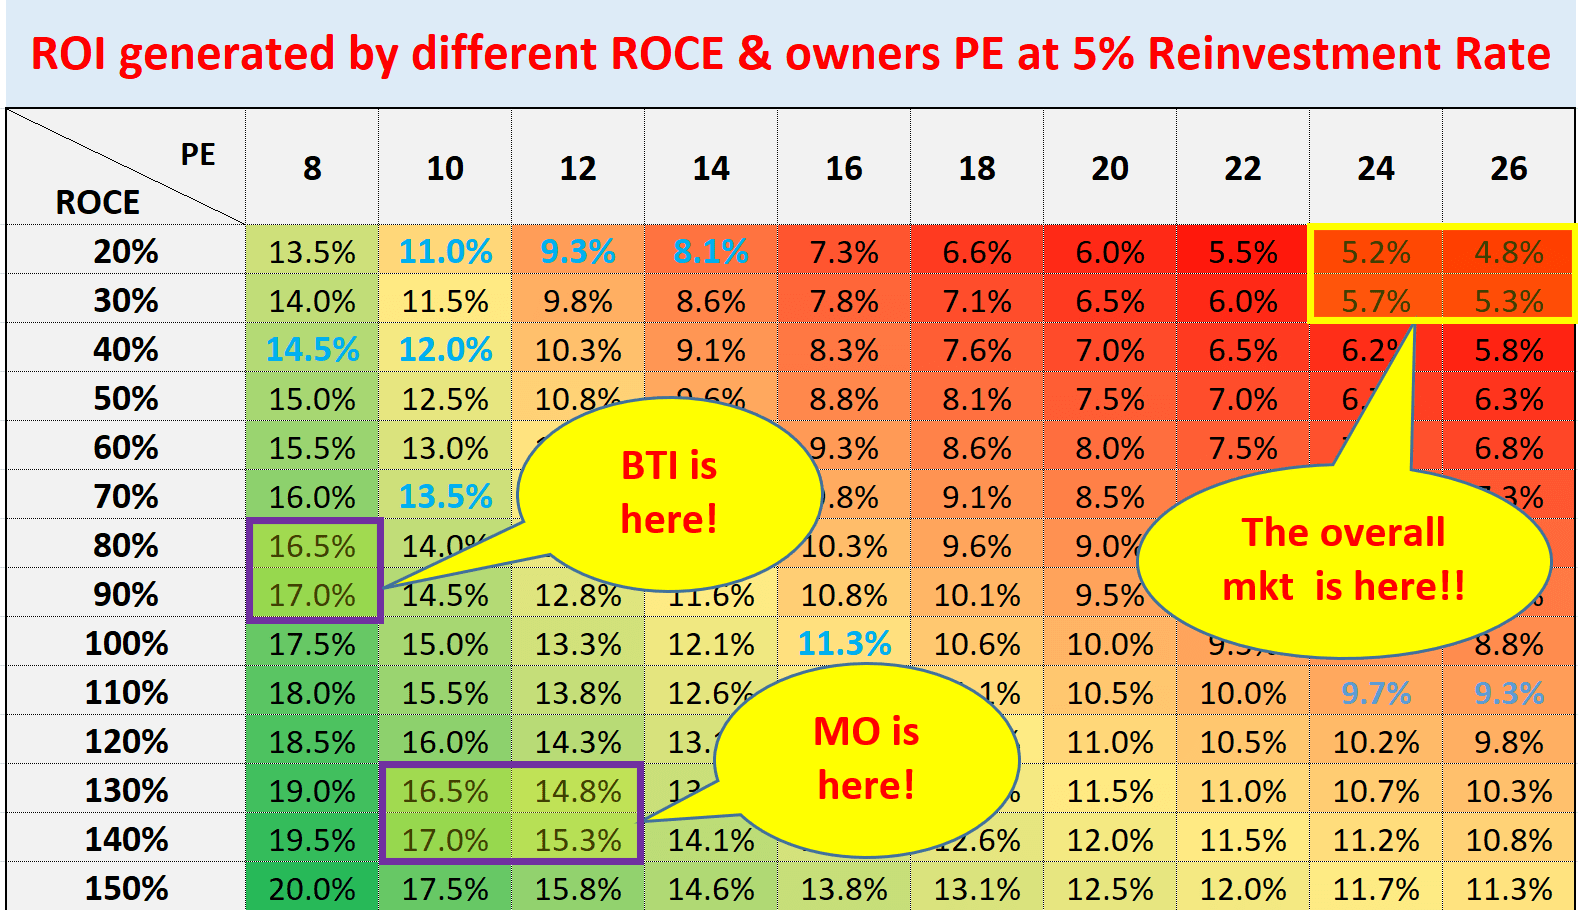
How did we build our roadmap?
The key in building this road is to think like a business owner, not a stock trader. As detailed in our earlier article:
- The long-term ROI for a business owner is simply determined by two things: A) the price paid to buy the business and B) the quality of the business. More specifically, part A is determined by the owner’s earning yield (“OEY”) when we purchased the business. And that is why PE is the first dimension in our roadmap. Part B is determined by the quality of the business and that is why ROCE, the most important metric for profitability, is the second dimension in our roadmap.
- Now, the long-term growth rate is governed by ROCE and the Reinvestment Rate. These are the two most important growth engines, and they mutually enhance each other. High ROCE means every $1 reinvested can lead to a higher growth rate, which leads to more future profits and more flexible capital allocation to fuel further growth, and so on. So to summarize:
- Longer-Term ROI = valuation + quality = OEY + Growth Rate = OEY + ROCE*Reinvestment Rate
The remainder of this article will show how the above roadmap applies to BTI and MO.
How did our roadmap perform?
Before going into further details, you must be wondering if it really works. So let me provide a bit of background of our investment philosophy and history. My family is in the final stage of retirement (after about 15 years of work). We have been applying this method consistently since 2012 (we started developing it around 2007 and it took us a few years to mature it). We hold a rather concentrated portfolio with about a dozen tickers diversified across different asset classes. Our own journey has shown that sticking to FEWER but well-understood holdings not only generated higher returns but also at LOWER risks despite the fact that we consistently applied leverage.
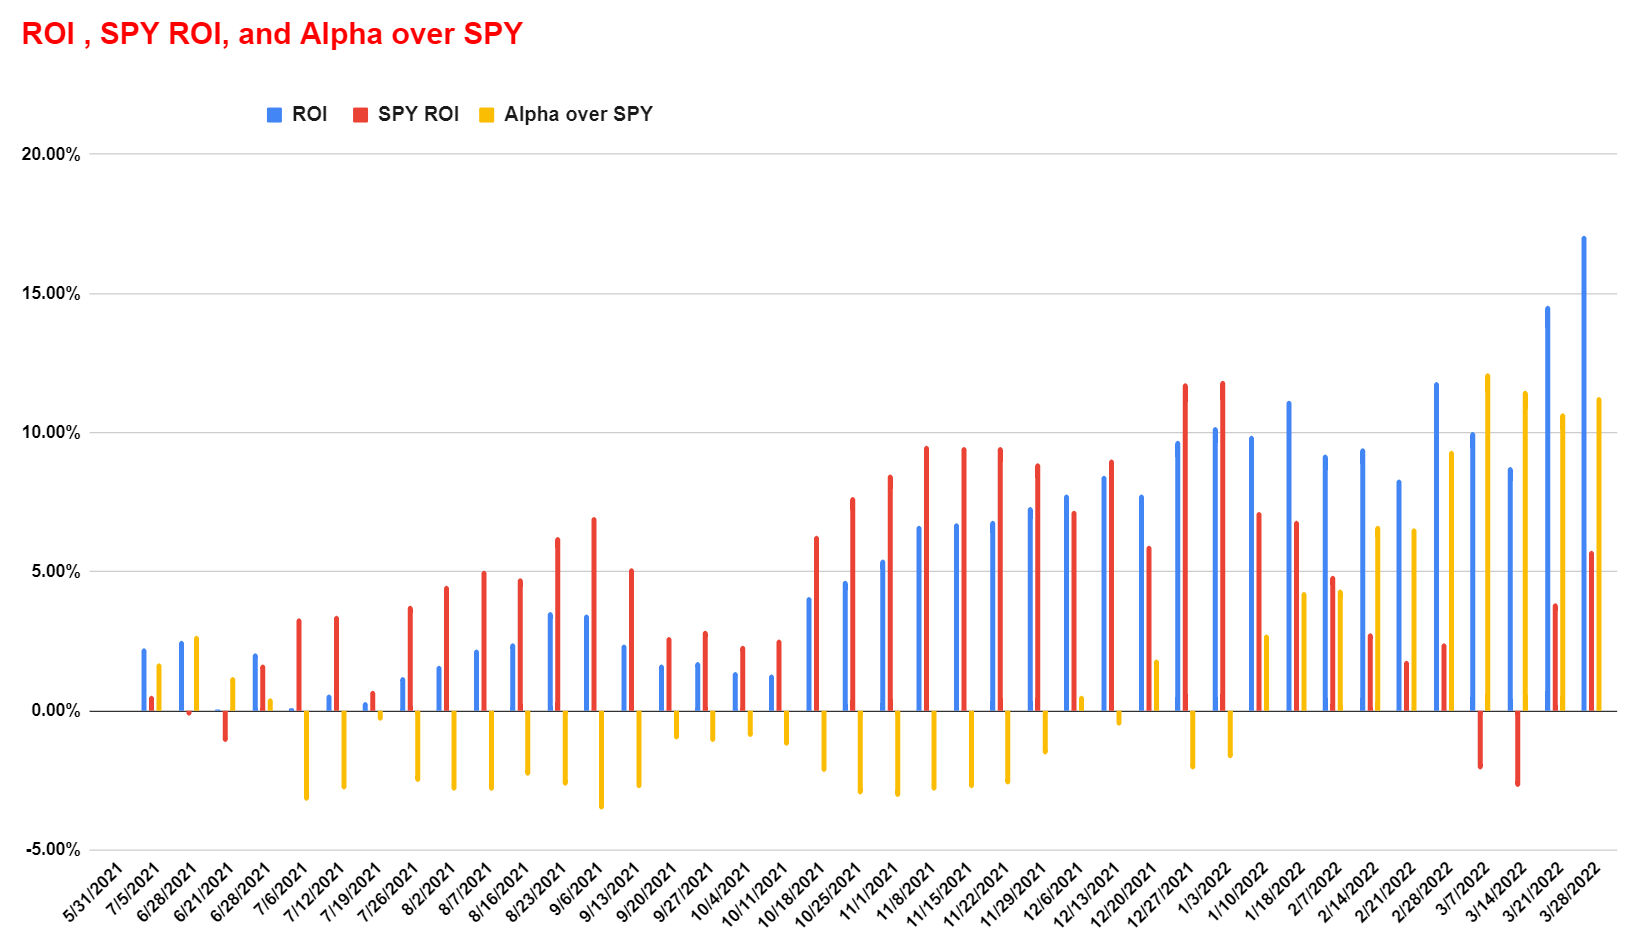
Currently, our stock portfolio holdings are shown in the next chart. Using the date I first published it on 5/31/2021 as the inception date, its performance relative to the S&P 500 (represented by SPY) is shown below, and also plotted on a weekly basis in the second chart. The chart plots a really short timeframe compared to our horizon and there is no need to read too much into the specific numbers. At its current level (about 11% ahead of SPY), it can all change within a few days of random market fluctuations. Note that AAPL has been a legacy holding and its returns are not included in these charts (otherwise, it will completely dominate the picture). Also note that these returns did not include dividends, so the actual returns from our holdings are slightly better than reported here.
And cells highlighted in blue put these holdings on the roadmap. As you can see, they all tend to be stocks with a good combination of quality and valuation – and that is how we achieve a superior return in a consistent and relaxed way with only a handful of holdings.
As you can also see the primary reason that we like BTI better. It offers better geographical diversification of our portfolio relative to our other holdings. We always tell our members and our friends that no holding is bad or good by itself. It has to be always discussed under the context of what else is already in the portfolio.
Source: author. Source: author.
BTI and MO: superb return on capital employed (“ROCE”)
We start with their profitability. As aforementioned, the most important profitability metric in my opinion is ROCE because it measures the return of capital ACTUALLY employed in a business. Details of BTI and MO’s ROCE analyses have been provided in our early articles already and here we will just directly quote the result as shown below.
Also, you can see, both have been maintaining a remarkably high level of ROCE, on average about 150% in recent years for MO, and about 81% for BTI. And these calculations considered the following items capital employed A) Working capital, including payables, receivables, inventory, B) Gross Property, Plant, and Equipment, and C) Research and development expenses are also capitalized. To put things under perspective, these levels of ROCE are not only spectacular on an absolute basis, they are also substantially higher than the FAAMG group, whose average ROCE is about 60% in recent years.
Source: author and Seeking Alpha.
Looking forward, both companies are actively addressing their traditional products (more on this in the risk section) and also aggressively pursuing new product mixes.
For example, BTI has been very actively developing new products (such as smoke-free products) and transforming its business model. Its multi-category strategy is working effectively in my view and is accelerating tobacco consumer acquisition. And some of these new products are showing promising signs already, such as VUSE, glo, and VELO. VUSE has been gaining momentum in key global markets, especially in its top markets (US, Canada, U.K, France, and Germany). In particular, Vuse’s value share rose to 31.4% in September YTD in the US market, compared to 30.0% in May YTD and 24.9% in 2020. Management commented that 2021 is a pivotal year for the accelerated growth of new category revenue. BTI is transforming the business rapidly: 12% of its revenue is now in Non-Combustibles and there are many other further opportunities beyond nicotine. All told, the business aims to grow new category revenue to $6.5B by 2025 from the current level of $2.2B. To put things under perspective, $6.5B would be about 18% of its 2021 total sales.
BTI investor presentation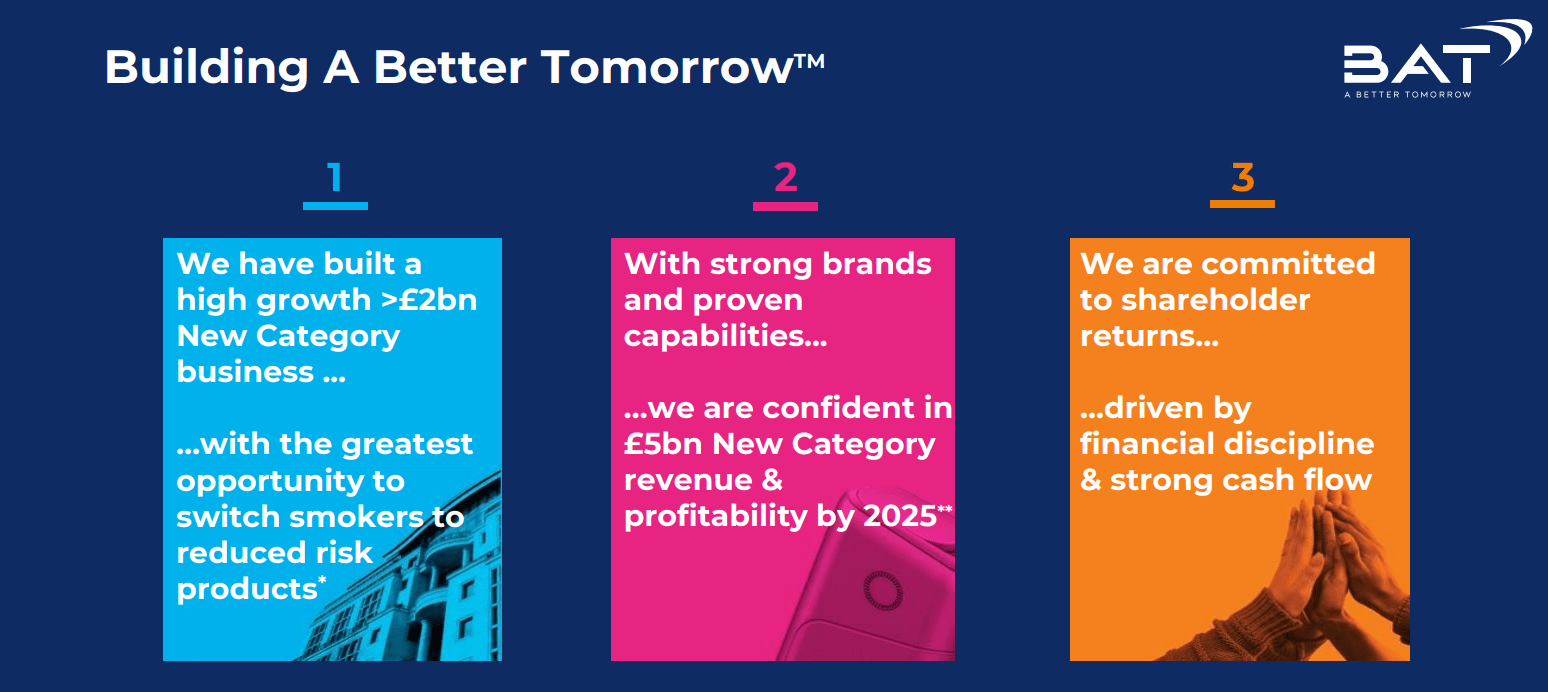
MO is also very aware of the secular decline of its traditional products and have been pursuing similar new product opportunities. It has been taking initiatives to reduce the health impact of their products and are developing new smokeless products. Notably, the market share of its oral tobacco category has been growing very rapidly. And also, its E-vapor category volume has seen steady growth also. In the most recent quarter, the E-vapor category volume has reached 0.52 billion units (in terms of equalized volume). In relative terms, this represents a 2% quarter to quarter volume increase, or quite impressively, 17% growth rate year over year. All told, as you can see from the following chart, its oral tobacco and E-vapor have been contribution more and more into the total sales, rising from about 16% of the equivalent volume in 2016 to about 24% in 2021, a 50% rise.
MO investor presentation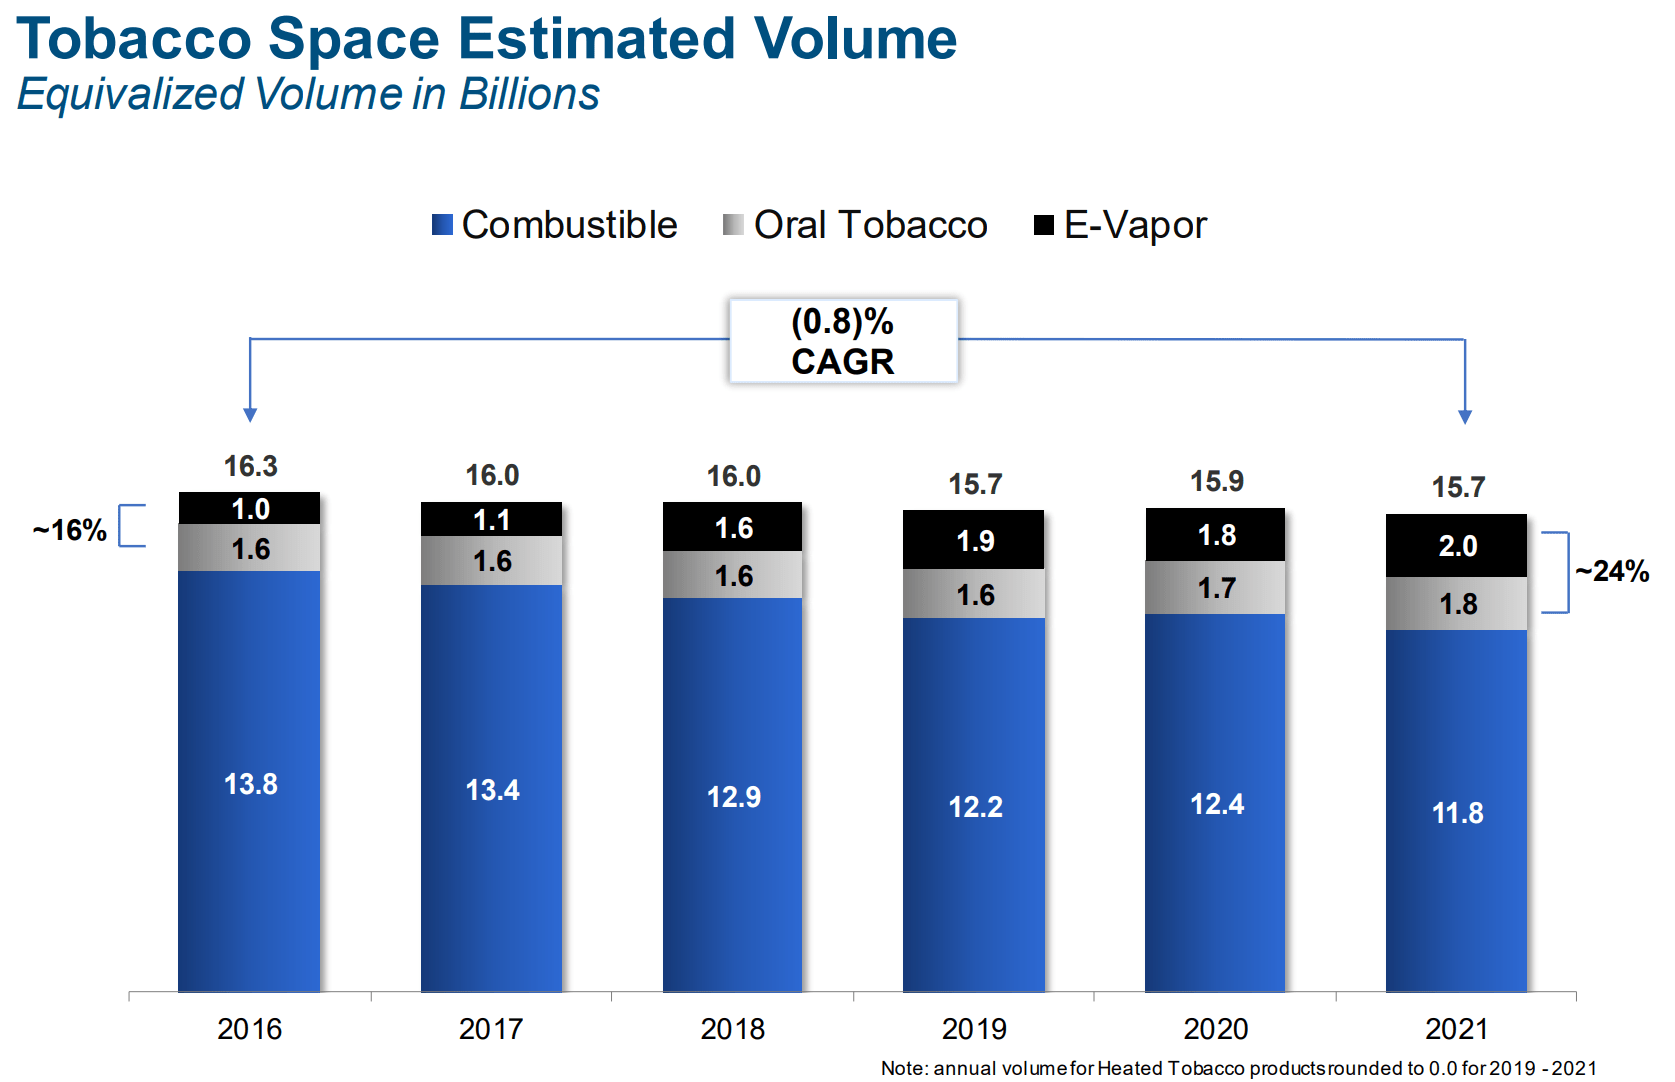
BTI and MO: capital allocation flexibility and reinvestment rate
Next, let’s see the reinvestment part. The following quote from Buffett probably paints a better picture of their capital allocation than what I am about to say:
“I’ll tell you why I like the cigarette business. It costs a penny to make. Sell it for a dollar. It’s addictive. And there’s fantastic brand loyalty.”
Buffett said these words in 1987, and they are still valid today. In recent years, the following chart shows how BTI has been allocating its operation cash (“OPC”). BTI has been using on average ~64% of the OPC as maintenance CAPEX and dividends. So these two “mandatory” have been on average costing only 2/3 of BTI’s operation cash in recent years. The quotation mark means even though the dividend is usually considered an optional cost. But for a dividend stock with BTI’s status, management probably won’t cut it unless they really have to.
For the remaining 1/3, the company does have a choice. It can use it for a variety of things: reinvest to fuel further growth, retain it to strengthen the balance sheet, pay an extra special dividend, pay down debt, buy back shares, et al. It obviously makes total sense to reinvest all of it to fuel further growth given its 80%+ ROCE. But the problem is that for businesses at this scale, there are just not that many opportunities to reinvest the earnings. As a result, BTI has been retaining a good part of the earnings, paying down debt, and also buying back shares.
All told, BTI has been reinvesting only about 5% of its earnings to expand the capital employed in recent years. So it could maintain a 4.1% long-term growth rate (ROCE * reinvestment rate = 81% * 5% = 4.1%).
Author
MO’s capital allocation picture is different on the surface as shown below, but the essence is similar.
As seen, MO has been using on average ~4% of the OPC as maintenance CAPEx – even lower than BTI. And it uses ~87% as dividends – considerably higher than BTI. So these two “mandatory” have been on average costing 91% of MO’s operation cash in recent years.
Despite these differences, the essence of the capital allocation picture is similar for both – both can afford to return pretty much all the OPC to shareholders after because of the very lower requirement of maintenance CAPEX. It is just that MO chooses to do so, and BTI does not.
All told, MO has also been reinvesting only about 5% of its earnings to expand the capital employed in recent years. So it could maintain a 7.5% long-term growth rate (ROCE * reinvestment rate = 150% * 5% = 7.5%).
Now we have all the pieces of the puzzle in place, and we can go back to the roadmap again.
Author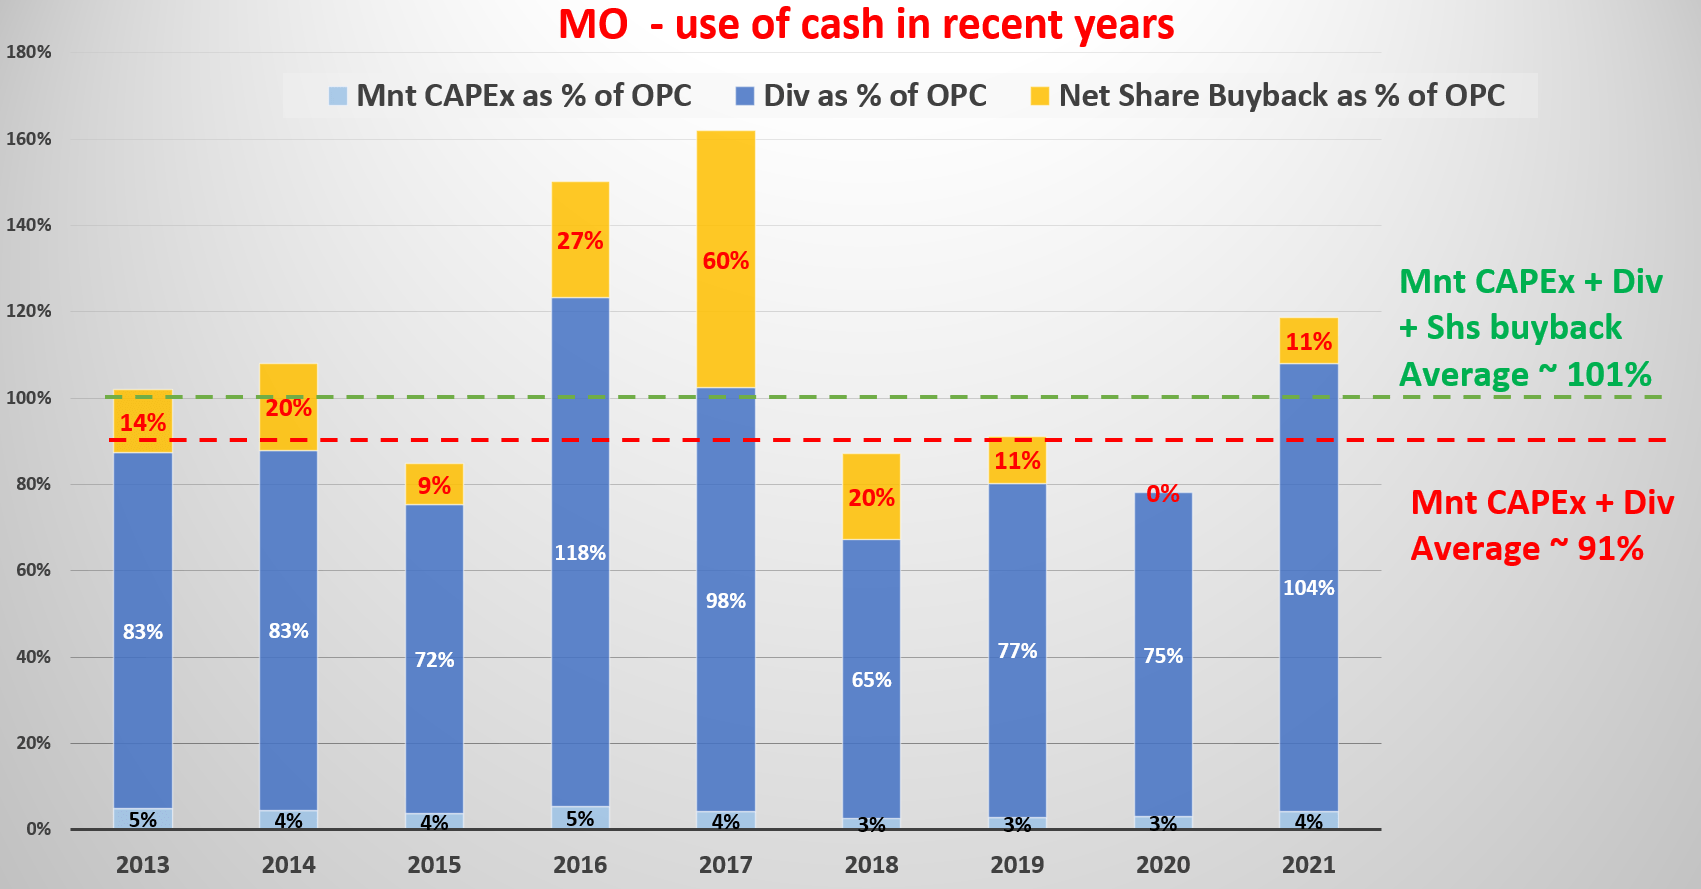
Back to the roadmap
At its current price levels, the OEY (owners earning yield) is ~12.2% for BTI and about 9.2% for MO. Note that here I used the free cash flow (“FCF”) as an approximation for the owners’ earnings. It is a conservative estimation in the sense that the owners’ earnings should be FCF plus the portion of CAPEX that is used to fuel the growth (i.e., the growth CAPEX).
As aforementioned, the growth rate is projected to be about 4.1% for BTI and about 7.5% for MO. As a result, the total return is projected to be about 16% for both – quite close. And this brings us back to the roadmap that opened the article. The overall market is currently valued at about 26.5x PE, resulting in an OEY of about 3.8%. Moreover, the overall market’s ROCE is on the order of 20% or so. And with a 5% reinvestment rate (or even 10%), the growth rate would be about 1~2%, leading to a long-term ROI of about 5~6% per year.
This also brings us to the reason (and also a secondary reason) that we like BTI better, even though their total returns are about the same 16%. But in BTI’s case, a large portion of the total return comes from the current owners’ earning yield and a smaller part from future growth. This difference, therefore, makes BTI more of a conservative investment and MO more of a growth investment – but only in relative terms against each other.
Source: author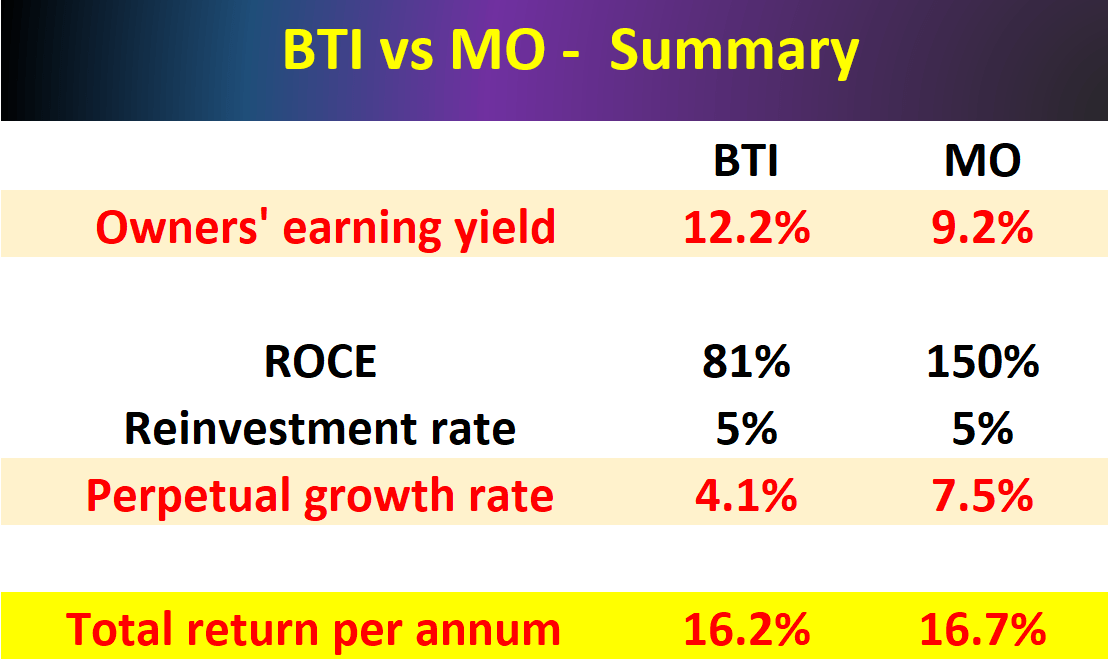
Risks
Both face some macroeconomic risks. The pace and degree of the post-COVID economic recovery are uncertain and can impact both. The current Russian/Ukraine geopolitical issues pose another risk. Even though MO is a U.S. player, the conflict could impact the global financial market in unforeseeable ways and thus MO indirectly. In BTI’s case, it has announced its intention to relinquish ownership of its business in Russia. Details remain unclear, but the impact should be limited as Russia and Ukraine account for about 3% of the company’s total sales.
Both also face the secular decline of their smokable products. Both have been constantly facing regulatory pressure in the form of product taxes and advertisement restrictions. And such pressure constantly poses risks. Both have been taking proactive measures to diversify their product offerings. Both have been aggressively investing in noncombustible and more healthy new products. I have no doubt that as sector leaders, they will definitely play a role in these new future products. However, the path can be tortuous (and the MO’s failed JUUL investment is a good example) and the timeline of success remains uncertain at this point.
Conclusion and final thought
When we invest like a business owner, not a stock trader, our long-term ROI is simply the sum of two things: A) the price paid to buy the business and B) the quality of the business. As such, both BTI and MO feature far more attractive return potentials for long-term investors than the overall market because of A) their lower valuation and B) their superior ROCE over the market average.
Although we like both and our analysis shows both offer about the same long-term return potentials (about 16%), we only hold BTI for the following considerations tailored to our own investment style and risk profile:
- The primary reason is that BTI offers better geographical diversification of our portfolio relative to our other holdings. We always tell our members and our friends that no holding is bad or good by itself. It has to be always discussed under the context of what else is already in the portfolio.
- The secondary reason is that BTI is more a value investment compared to MO. Even though their total return potentials are about the same 16%, the compositions are different. In BTI’s case, a larger portion (about 12%) comes from the current owners’ earning yield and a much smaller part from future growth (only about 4%). Therefore, BTI is more of a conservative investment and MO more of a growth investment – in relative terms against each other. We do not see bad choices here. Only choices that investors need to make to suit their own situations.
- Finally, in case you want to ask why not own both. You certainly can. But as aforementioned, we ourselves like holding a concentrated portfolio (with about a dozen stocks and a few funds) and usually limit our exposure to 1 stock per sector.
Be the first to comment