

Imgorthand
Investment Thesis
An investment into a stock should rationally be done when we can evaluate the projected future cash flows of the company we are going to invest. Growth stocks, having a big variance in their future results, are by nature more risky than those that have a high degree of predictability. As an extreme example, US 10 year treasury are currently yielding 4%. An investor can lock-in today a 4% nominal yield over the next decade with complete certainty. Some value stocks offer a high degree of cash flow certainty and we can rationally see through their financials to establish if an investment can generate a desired investment objective.
British American Tobacco p.l.c (NYSE:BTI) is a value investment with a long track record, 7.25% dividend payout and low financial performance variance. By analysing 10 year of financial data and conservatively estimating future performance we can conclude that it’s a highly positive cash flow generating business with attractive dividends that will grow over the coming years.
In this article we will analyse the past 10 years of financial data, focusing on:
- free cash flow
- debt situation (debt/EBITDA)
- topline revenue growth
With these metrics we are in the position to establish the status quo and estimate a conservative projection for the future financial performance of this mature business. We will be addressing the question and concern of dividend investors: Is the high dividend of BTI sustainable and can it growth in the future?
Risk
We have identified three key industry specific risks.
a) ESG exclusion. Global equity managers underweight tobacco industry which leads to a decreased demand in the stock. This investor behaviour leads to a valuation discount and at the same time offers an opportunity to investors that demand a margin on safety on the intrinsic valuation of a company.
b) Consumer habits. Global cigarette consumption has peaked in 2009 and is since then falling at a constant pace of 1% per year. Cigarette companies have been able to counter these effects by increasing prices at a faster pace than demand reduction and by expanding into different business units.
c) Unsuccessful M&A activity to fuel growth. Tobacco companies have done acquisitions in the smoke-free tobacco sector and are looking to enter the cannabis business. These two sectors do have sizable growth opportunity which could turn around stagnating revenue growth rates of tobacco companies. For example, Altria (MO) wrote down value of Juul Labs investment to 450 Mio from 12.8 Bio in the past years. We do see the enticement to foster growth via M&A as a considerable risk in the tobacco industry. Management should focused rather on share buybacks in order to grow EPS instead of trying to grow topline revenue growth at all costs.
Point a) and b) being obvious facts, are obviously priced-in the current valuations. As such we evaluate these risks to have unfolded already in the stock price. For point c), BTI has announced at the begging of the year a stock buyback program, de-risking our investment on the un-predictability of future acquisition outcomes.
Cash Flow
The most important metric in evaluating a mature business is the generation of cash flow. How much cash is the business producing and how much is free to be distributed to shareholders. After all, investors are buying the future strips of free cash flow to equity holders. BTI, having a very stable cash flow is providing a high grade of predictability and certainty.
Historic cash flow metrics:
CFO: Cash flow from operations has been growing at 5.5% over the past 10 years. Most of the growth can be attributed to the acquisition of Reynolds made in 2017.
CAPEX: CAPEX is small and decreasing over the years. This is a characteristic of the tobacco industry.
FCF: Free cash flow has been growing, mostly because of the acquisition of Reynolds.
Yield: Free cash flow yield, was on average 9.1% over the past 10 years. Currently yielding over 13% due to the low stock price.
10 years Cash Flow / CAPEX / Free Cash Flow data (bat.com/)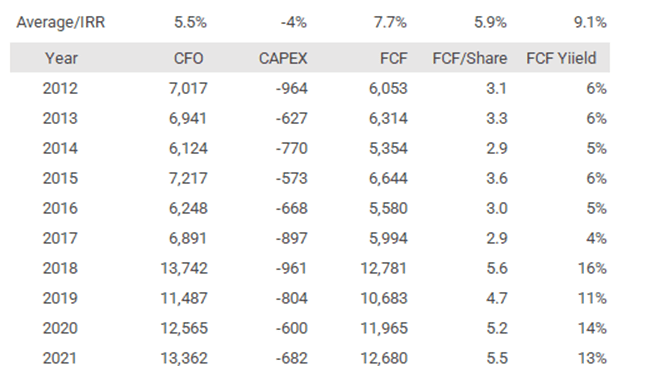
The overall theme is a lack in organic growth paired with strong cash flow. The growth has been fueled by the acquisition of Reynolds. It would be wrong to assume that BTI can grow in future unless further acquisitions are made. On a positive note, the CAPEX efficiency allows most of the cash to be distributed to shareholders.
Debt/EBITDA
Some companies fuel their growth and operating leverage by loading debt on their balance sheet. The cost of capital from debt is typically cheaper than the cost of equity. This is a normal procedure and fine for investors, but the outstanding debt needs to be in balance to the cash the company is producing, otherwise it becomes unsustainable. A good guideline for this is utilizing a ratio of 3X for debt/EBITDA.
During the acquisition of Reynolds, BTI did increase its debt level in 2017 to uncomfortable levels of 6 times Debt/EBITDA. Since then, it has managed to bring the ratio back in line with more appropriate levels of 3X Debt/EBITDA by:
a) increasing EBITDA and
b) paying back more than 10 Bio in debt thanks to strong free cash flow.
As can be observed in the chart below, BTI has peaked its debt/EBITDA ratio in 2017 during the Reynolds acquisition. Currently the company is not overleveraged and can sustain these debt levels. Management has declared the target of 2 to 3X Debt/EBITDA which we applaud (Page 40). That target can be hit in the next couple of years by paying back ~10 Bio of debt which the company is comfortably generating (even after accounting for dividend payments). Once debt targets have been hit the company will have additional cash on hand that can be distributed to shareholders.
Net Debt/EBITDA (bat.com/)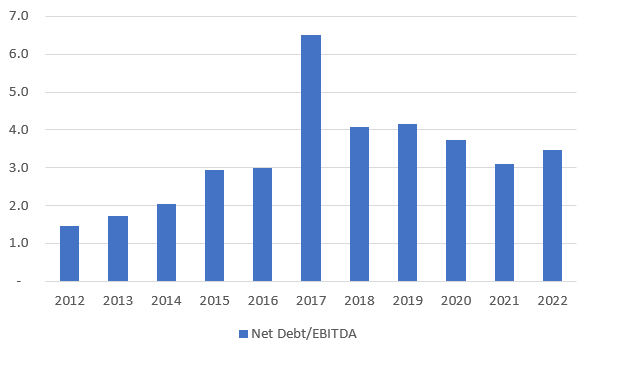
Topline revenue growth and projections
Historical Growth Data (seekingalpha.com/symbol/BTI/growth)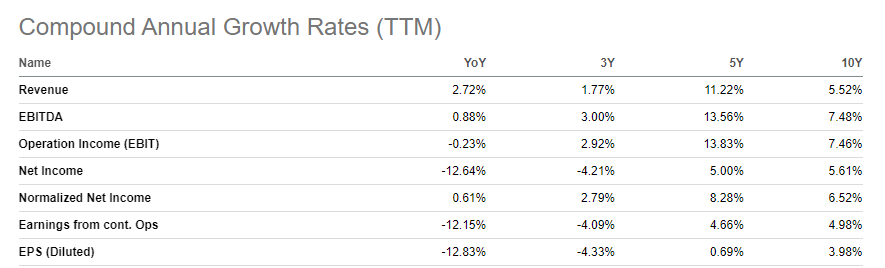
Topline revenue growth: It’s not a revelation that the tobacco industry is not a growth business. BTI has managed to grow revenue and EBITDA nicely over the years, but mainly via the acquisition of Reynolds. Going forward, we are taking this fact into account by growing their business at a conservative 2% rate, in line with long-term inflation expectations. Additionally, 2022 revenue expectations are down compared to 2021. Analyst expectations are for revenue to come in at 31.500, a contraction that needs to be accounted when looking at EBITDA and Operating cash flow. (table below: Projections)
CAPEX growth: BTI has managed to reduce CAPEX over the years even though the overall business was growing. This is typical for the tobacco industry and we will assume conservatively for the next 10 years that they can maintain CAPEX on a constant level, neither reducing it how they did in the past, nor increasing it. (table below: Projections )
FCF growth: The implications for free cash flow will in this environment is to grow steadily, on pace with our 2% inflation projection. (table below: Projections )
Did free cash flow sustain the high dividend payout during the past decade?
As we can see in the chart below, since the acquisition of Reynolds, BTI has been running a comfortable spread between free cash flow and the capital that is being returned to shareholders.
This excess cash has been utilized to service and payback debt the company issued in 2017 to finance the acquisition of Reynolds. They have now reached a debt level where they have the choice to consolidate their debt position (i.e. stop debt repayment). This will allow for higher cash distributions to shareholders via dividends and stock buybacks.
Capital Returned to Shareholders to Free Cash Flow (bat.com/)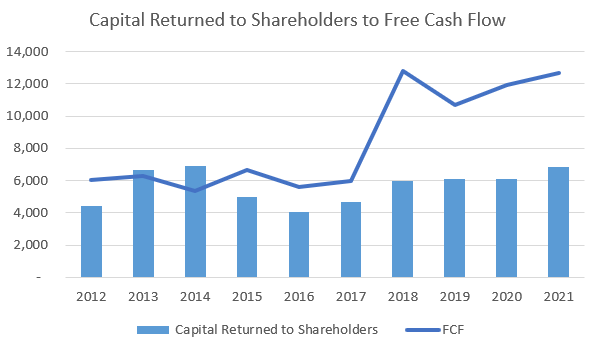
Dividends for the next decade:
Historically, BTI has not done buybacks. This is changing but we will assume for the next 10 years that they will focus their shareholder distribution plan on dividends only to establish if the distributions are sustainable. The delta between free ash flow and dividends is currently at +4 Bio. BIT has been increase its dividend payout by an average of 4.5% each year. By simulating the same dividend increase in the coming decade the delta between free cash flow and shareholder payouts will still be positive by 2.6 Bio in 2032. Additionally, during this next decade (Bar chart below: Difference between free cash flow and dividends) they will have accumulated an excess cash of 38 Bio (sum of deltas) which they can use to:
a) repay debt (which we don’t think is necessary).
b) buy back stock (which we think could be a great initiative).
c) increase dividend pay-out at an accelerating pace beyond 4.5% growth (a real possibility in a higher yield environment).
d) merger and acquisition to foster growth.
10y Free Cash Flow Projections (Vittorio Bertolini Projections)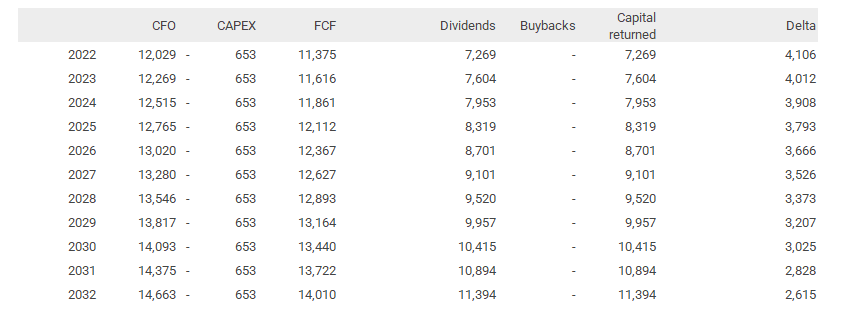
Difference between Free Cash Flow and Dividends (Vittorio Bertolini Projections)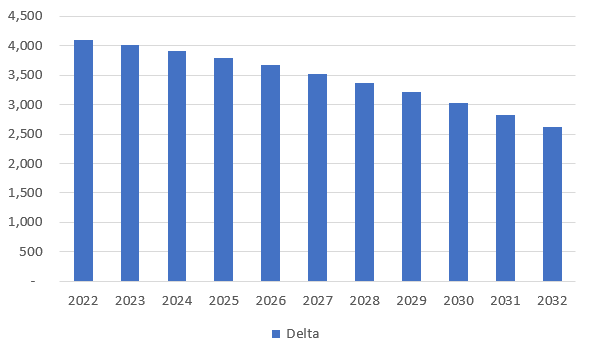
Conclusions
BTI is currently distributing 60% of its free cash flow to shareholders through their dividends. The deflated debt level enables them to increase their distribution to shareholders at and beyond the historic growth rate of 4.5%. We believe that by growing on par with inflation BTI will be able to bump-up their dividends considerably and/or start a share buyback program.
Currently BTI is trading at a free cash flow yield of 13%, well below its historic mean of 9%. A return to its long term mean would imply a share price in the mid-50s. This is an extremely conservative stock with a very healthy cash flow component that should award its shareholders with healthy dividend income over the next decade.
Be the first to comment