

gustavofrazao/iStock via Getty Images
This is an update to our series of articles started in 2012 assessing market valuation and estimating forward stock market returns. The most recent previous update was March 2022 with end of February 2022 values.
The December 2021 update concluded that the then prevailing condition of overvaluation suggested zero real returns from stocks to the end of 2028 and the danger of an imminent major downturn for equities.
By end of February 2022 the S&P 500 was 5% down from the December 2021 average. Since then the index has declined further as predicted in the March 2022 update which showed that reverting to the long trend would entail a 43% decline, possibly over a short period.
The projections here are partly based on Estimating Forward 10-Year Stock Market Returns using the Shiller CAPE Ratio and its 35-Year Moving Average, which is referred to as the “referenced article” further down.
What short-term stock market returns can be expected?
Nobody knows, and the best one can do is to use the historic data (which is from Shiller’s S&P series) to guide us to make estimates for the future. From the real price of the S&P-Composite with dividends re-invested (S&P-real) one finds that the best-fit line from 1871 onward is a straight line when plotted to a semi-log scale. There is no reason to believe that this long-term trend of S&P-real will be interrupted. S&P-real, updated to end of May 2022 and the best fit line together with its 95% prediction band are shown in Figure-1. (See appendix for the equation.)
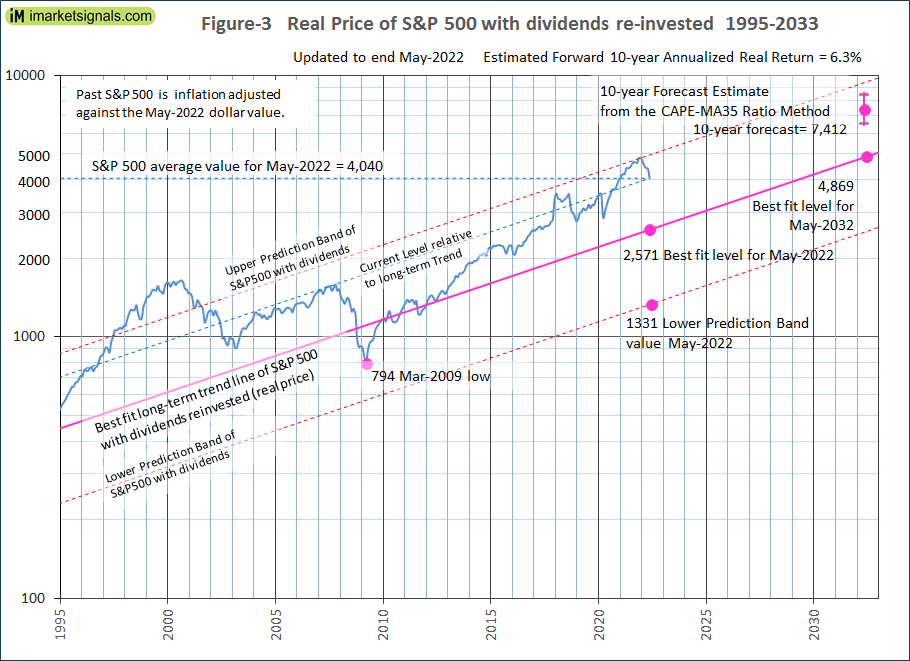
The average May level of 4,040 is 57% above the long-term trend line (Figure-3). Reverting to the mean trend would entail a 36% decline, possibly over a short period. (Note, that as of 6/14/2022 the S&P has already declined 7.5% to 3,740, thus reaching the mean trend would only require a 31% further decline from this level.)
iMarketSignals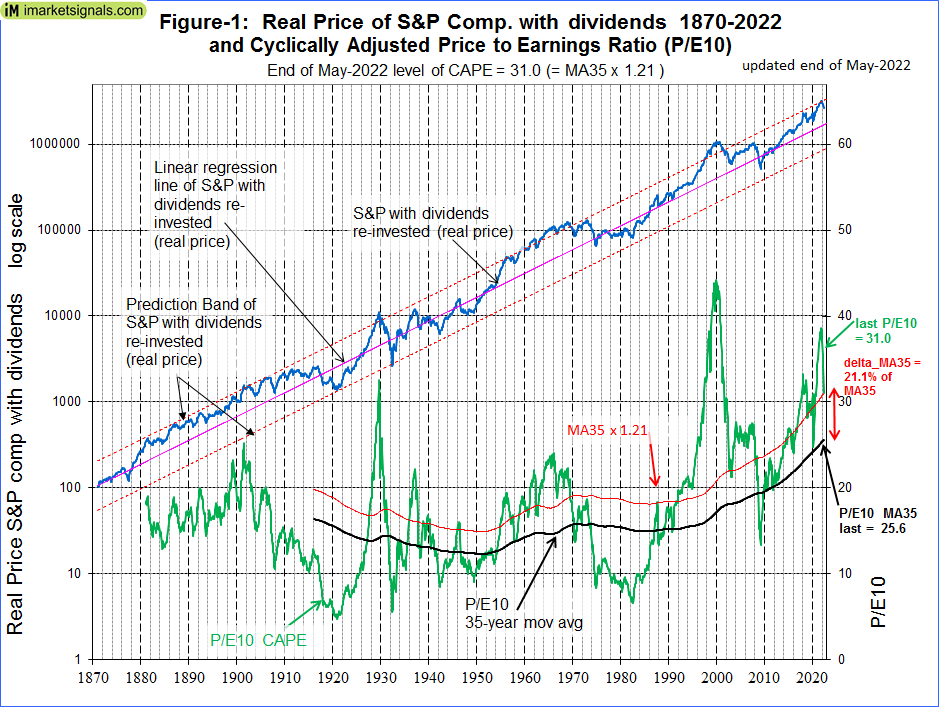
Forecasting stock market returns with the CAPE-MA35 Ratio
Also shown in Figure-1 are the CAPE (which is the S&P-real divided by the average of the real earnings over the preceding 10 years) and its 35-year moving average (MA35), having end of May 2022 values of 31.0 and 25.6, respectively. Thus the falling CAPE is 21% above the MA35 and the S&P-real has now sharply declined from the upper prediction band line where it was end of December 2021.
As shown in the referenced article, a superior method to the standard use of the Shiller CAPE-ratio is to predict 10-year real returns using the CAPE-MA35 ratio as a valuation measure. It is simply the value of the Shiller CAPE-ratio divided by the corresponding value of its 35-year moving average (31.0 / 25.6 = 1.21).
Currently the CAPE-MA35 ratio of 1.21 forecasts a probable 10-year annualized real return of about 6.3% to May 2032 (Figure-2). Based on the current S&P 500 value this would indicate an end of May 2032 value of 7,412 for S&P-real, with upper and lower confidence values of 8,420 and 6,520, respectively (Figure-3).
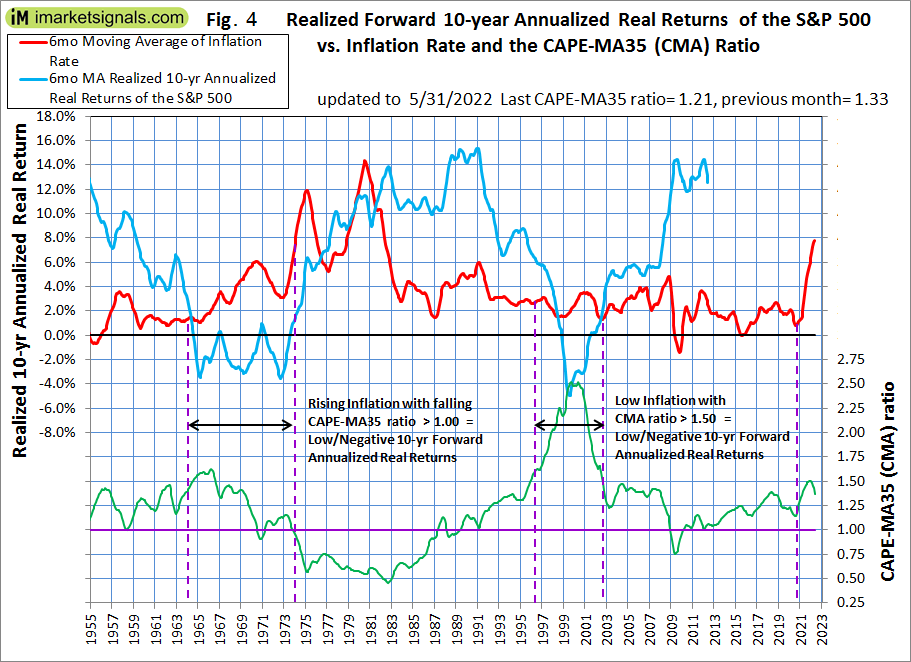
The forecast 10-year annualized real return of about 6.3% is based on regression analysis and may be optimistically high during periods of rising inflation. Figure-4 shows inflation, the CAPE-MA35 ratio and realized 10-year annualized real returns from 1955 onwards. One observes that very low or negative 10-year forward annualized real returns followed the period with rising inflation and a falling CAPE-MA35 ratio, 1964-1973.
Also in Figure-3 the current level of the S&P 500 relative to the long-term trend is indicated by the line parallel to the long-term trend line. Note that this relative level is now the same as it was at the end of 2007 prior to the 55% decline to the March 2009 low.
iMarketSignals iMarketSignals iMarketSignals.com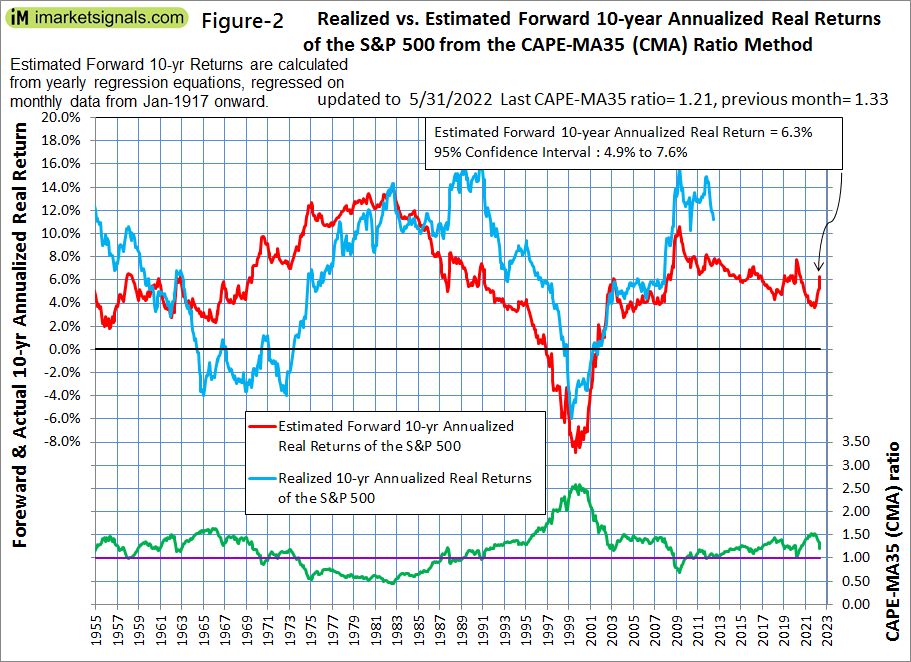
Forecasting returns to 2032 with the long-term trend
When extending the best fit line and the prediction bands (Figure-3), then the S&P-real end of May 2032 value would be 4,869.
Thus the historic trend forecasts a probable total gain of only about 20% (or an annualized return of 1.9%) for S&P-real from its May 2022 level of 4,040 to the end of February 2032 best fit level of 4,869.
Conclusion
- The current elevated level of the S&P 500 relative to the current long-term trend level warns that stocks are overvalued; and
- The current CAPE-MA35 ratio of 1.21 forecasts a relatively high 6.3% real 10-year forward return for the S&P 500, while the long-term trend indicates a forward return of only 1.9%; and
- Current high/rising inflation and a falling CAPE-MA35 ratio may indicate very low, or negative 10-year forward returns for equities, similar to what followed the period 1964-1973.
- The current condition of overvaluation suggests the possibility of a major downturn for equities.
Updates of the estimated 10-year forward returns of the S&P 500 (Figure-2) are posted monthly at imarketsignals.com.
Appendix
The best fit line and prediction band
The best fit line and prediction band were calculated from monthly data from Jan-1871 to July-2012. The SP-real values for the period after July-2012 are “out of sample” and were not included in the regression analysis.
The equation of the best fit line is y = 10(ax+b)
y = is the dependent variable of the best fit line. x = are the number of months from January 1871 onwards. a = 0.0023112648b = 2.02423522
Be the first to comment