

Mike_Pellinni/iStock via Getty Images
Bristol Myers Squibb (NYSE:BMY) is one of the biggest pharmaceutical companies in the world, with a current market capitalization of around $173 billion and an enterprise value of around $202 billion. The company as we know it today was founded in 1989 through a merger between Bristol Myers Co. and Squibb Corp., both originally dating back to the second half of the nineteenth century. In 2019, BMY acquired Celgene in what was arguably a very bold move in the company’s history, at a price tag of $74 billion (or $95 billion including the debt assumed in the process) and somehow reminiscent of AbbVie (ABBV), which acquired Allergan in 2020 in a $63 billion deal. Investors apparently did not believe in either acquisition, and the share prices of both companies fell significantly. Although both transactions appeared very risky due to the amount of debt, the companies performed very well, and shares of BMY and ABBV have rallied significantly as investors increasingly put aside the patent cliffs of both companies. Still, BMY’s shares have not risen nearly as much as ABBV’s, which are up more than 130% since mid-2019.
In this article, I want to share with you my view on BMY’s current portfolio and pipeline, its financial stability and profitability and why I believe the shares offer far more compelling value than those of AbbVie.
Bristol Myers Current Portfolio And Pipeline
BMY is probably best known for its anticoagulant Eliquis (apixaban), which is used to treat and prevent blood clots and to prevent stroke in patients with nonvalvular atrial fibrillation. The drug, which was BMY’s top seller before the acquisition of Celgene is expected to go off-patent in 2026 and generated $10.8 billion in sales in 2021 (23% of total sales). Eliquis is marketed jointly with Pfizer (PFE) and still grows strongly, at a YoY growth rate of 17%. Sales are split roughly 60/40 between the U.S. and the rest of the world (ROW).
Revlimid (lenalidomide, treatment of multiple myeloma and myelodysplastic syndromes), which was developed by Celgene, is BMY’s current top-selling drug with 2021 worldwide sales of roughly $12.8 billion (28% of total sales). The drug goes off-patent this year but BMY still benefits from volume-limiting licenses granted to generics manufacturers. Sales of Revlimid, which grew 6% YoY, are split roughly 68/32 between the U.S. and the ROW.
Opdivo (nivolumab), BMY’s third-best selling drug, generated sales of $7.5 billion in 2021 (16% of total sales), up 8% YoY, and split roughly 56/44 between the U.S. and the ROW. It is a checkpoint inhibitor and thus used as a treatment of, e.g., melanoma, lung cancer, malignant pleural mesothelioma, renal cell carcinoma and Hodgkin lymphoma. Therefore, it can be seen as a rival of Merck’s (MRK) blockbuster, Keytruda, which is set to be the top selling drug worldwide in 2026 with sales of almost $25 billion.
Other major drugs are Orencia (rheumatoid arthritis, 2021 sales of $3.3 billion, up 5% YoY) and Pomalyst/Imnovid (multiple myeloma, 2021 sales of $3.3 billion, up 9% YoY). Otezla (apremilast) is a small molecule phosphodiesterase 4 and TNF-α inhibitor used to treat certain types of psoriasis and psoriatic arthritis. The drug was originally developed by Celgene but not transferred to BMY due to concerns expressed by the Federal Trade Commission. Hence, Celgene entered into a purchase agreement with Amgen (AMGN) in mid-2019, which acquired the drug for $13.4 billion and generated $2.25 billion in product-related sales in 2021 (p. 58, AMGN 2021 10-K).
Besides Revlimid, Celgene also brought a strong oncology pipeline (Reblozyl, Abecma, Onureg and Breyanzi) and a promising multiple sclerosis treatment (Zeposia) to the table (slide 13, investor presentation). Together, these five drugs are expected to deliver peak sales of over $10 billion. Additionally, BMY expects Mavacamten (hypertrophic cardiomyopathy) to significantly add to its top-line, at estimated peak sales of $4 billion. The drug, which is still in trials, was acquired as part of BMY’s acquisition of MyoKardia for $13.1 billion in 2021. A recent phase 3 trial met all primary and secondary endpoints and patients receiving Mavacamten demonstrated improvement in key cardiac measures after 16 weeks of treatment.
Clearly, these assets are of paramount importance to BMY as Revlimid sales are about to decline, as the first generics are being brought to market. In addition to Revlimid, Sprycel, Pomalyst, and Abraxane are also expected to decline due to their impending loss of exclusivity (LOEs); Opdivo, Yervoy, and Eliquis will follow in the second half of the decade (slide 10, investor presentation). Taken together, BMY’s pipeline – much of which has been acquired – is expected to have sales potential in excess of $25 billion and the company will likely grow its top-line at a low to mid-single digit compound annual rate until 2025, more than offsetting the $12 to $14 billion in LOE-associated decline in sales and diversifying the revenue stream away from few key assets.
BMY’s $45 Billion Challenge
Similar to AbbVie, investors shied away from BMY when the Celgene acquisition was announced, in part due to fears from the impending LOEs and the substantial amount of debt that was taken on to fund the acquisition.
However, not only ABBV, but also BMY reported a strong increase in free cash flow (FCF) in the years following the acquisition, suggesting that the companies’ debt levels may be very manageable after all. Based on my own estimates, I arrived at normalized FCF of $10.3 billion for 2020 and $14.9 billion for 2021. I have deducted stock-based compensation expenses from FCF, as well as impairment charges and normalized working capital movements. Going forward, I expect BMY to generate a normalized FCF of at least $15 billion per year, which is the low end of management’s guidance of $45 to $50 billion between 2021 and 2023 (slide 124 , investor presentation).
When comparing BMY to ABBV in terms of their upcoming debt maturities, BMY appears much more conservatively financed than ABBV, and more in line with competitors Merck and Gilead Sciences. Standard & Poor’s current long-term and short-term credit ratings for BMY are A+ and A-1, respectively, with a negative long-term credit outlook. S&P has downgraded AbbVie’s long-term debt to BBB+ from A- following the acquisition of Allergan in 2020 (p. 43, 2021 10-K).
Figure 1: Upcoming debt maturities of BMY, ABBV, GILD and MRK (own work, based on each company’s 2021 10-K)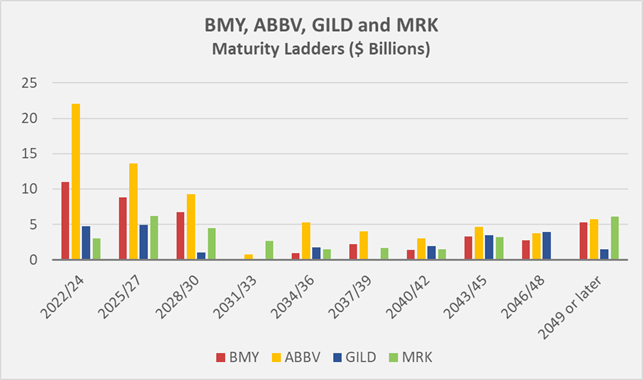
However, even though ABBV’s upcoming maturities appear more concerning, it should be emphasized that both companies would only need about 3.5 years to repay all of their debt if they were to suspend dividends and buybacks. BMY’s and ABBV’s debt ratios are in line with those of GILD and MRK, although the latter company would need another year to fully deleverage, likely due to its comparatively weaker cashflow conversion and typically much higher capital expenditures. (see my article from March).
Both BMY’s and ABBV’s interest coverage ratios are very acceptable at over ten times pre-interest normalized FCF and are in line with GILD and MRK. BMY’s historical interest coverage ratio is illustrated in Figure 2.
Figure 2: BMY’s historical interest coverage ratio in relation to pre-interest normalized FCF (own work, based on the company’s 2010 to 2021 10-Ks and own estimates)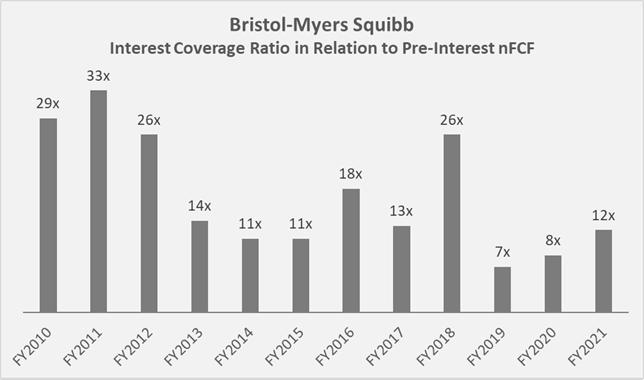
Profitability
Morningstar has rated BMY as a company with a wide economic moat. Its gross margin of 79% is higher than that of ABBV (69%). ABBV’s post-acquisition normalized FCF margin is around 40%, while BMY’s is just above 30%, likely due to the weaker cash flow conversion and working capital efficiency. In terms of cash return on invested capital (CROIC), both companies are similar at around 17%. Note that ROIC is based on net operating profit after taxes, which may not be particularly meaningful for pharmaceutical companies, while CROIC is based on FCF. BMY’s 2019 CROIC was well below its weighted average cost of capital due to the consolidation of Celgene that year. Since then, however, BMY’s profitability has risen strongly (Figure 3).
Figure 3: BMY’s historical cash return on invested capital (own work, based on the company’s 2010 to 2021 10-Ks and own estimates)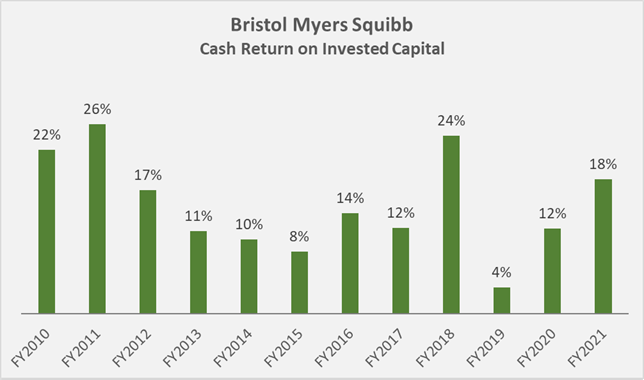
Compensation Of Shareholders And Executives
BMY pays a quarterly dividend of currently $0.54 per share, which was increased by 10% in December 2021. It seems as if BMY transformed into a dividend growth stock following the acquisition of Celgene, which itself did not even pay a dividend. BMY’s newly charted course is particularly evident in Figure 4. The payout ratio of around 30% of normalized FCF leaves ample room for dividend growth and still allows the company to significantly reduce its leverage. This suggests that the dividend is very safe, also in the event of rising interest rates. With a current yield of 2.8%, the stock is less attractive than it was in December 2021, but it is still close to the long-term average dividend yield of 3.0%.
Also in December 2021, which marked the inflection point for BMY’s stock price (which has risen more than 40% since its low of $53), the company announced that its board of directors had authorized the repurchase of an additional $15 billion of the company’s common stock, bringing its total outstanding authorization to $15.2 billion. Obviously, the buybacks are much less efficient at the current share price, but still very acceptable considering that BMY is still far from being overvalued (see below).
Figure 4: BMY’s historical dividend growth rate, based on the cash dividends declared during each fiscal year (own work, based on the company’s 2010 to 2021 10-Ks)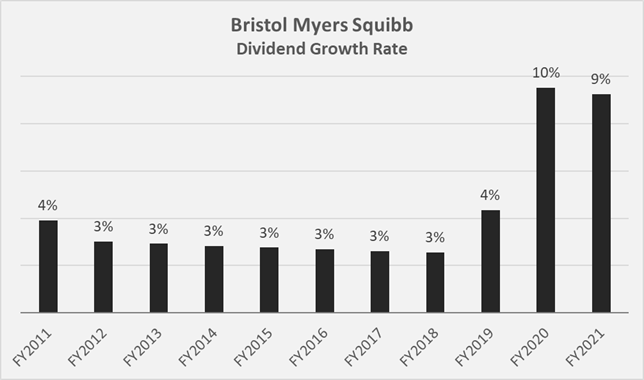
Compensation of BMY’s executives through company stock awards and options is moderate in my opinion and very much in line with its peers MRK and ABBV (Figure 5). Gilead is a notable outlier, as discussed in my article published a few weeks ago.
Figure 5: Three-year average stock-based compensation (SBC) expenses of BMY, ABBV, GILD and MRK, compared to each company’s normalized free cash flow (nFCF) and 2019 to 2021 average revenues (own work, based on each company’s 2019 to 2021 10-Ks and own estimates)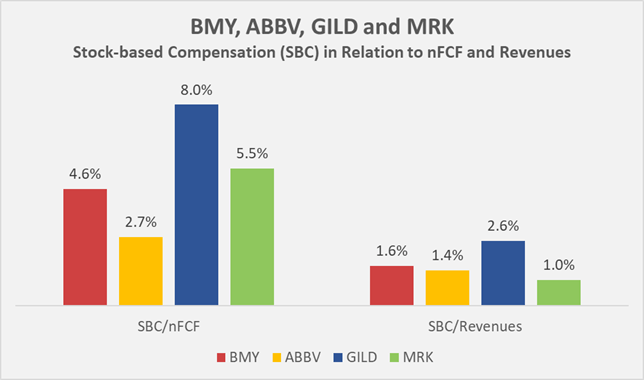
Conclusion – Why I Continue To Add To My Position
BMY’s FCF is very strong and management laid out a very convincing plan in its recent investor presentation, for how it expects to offset the decline in sales due to the LOEs of Revlimid, Sprycel, Pomalyst and later also Opdivo, Yervoy and Eliquis. The company’s debt appears concerning at first sight but is very manageable and the upcoming maturities are much more balanced than those of AbbVie. BMY’s lack of focus on a specific therapeutic area may be criticized, as the company has drugs marketed in many areas. However, I do not necessarily consider this a disadvantage and view BMY as a well-managed and properly diversified holding company of pharmaceutical assets. Frankly, I much prefer BMY’s diversification to, say, Merck’s current over-reliance on Keytruda. I expect that the upcoming drug price negotiation initiative will likely have an impact on BMY’s earnings power, although not a large one, as outlined in my previous article. Finally, from the perspective of an income-oriented investor, I very much welcome the recent more significant dividend increases and BMY’s apparent change of course in this regard.
I consider myself lucky that I opened my position in BMY at $55 and added to it at $58. However, even though the share price has risen significantly in recent months, I still consider the stock to be undervalued. This is for example illustrated by the comparison of BMY’s market capitalization to its annual normalized FCF in Figure 6.
Figure 6: BMY’s historical normalized free cash flow (nFCF) and market capitalization, as observed in the month the company announced each year’s earnings (own work, based on the company’s 2010 to 2021 10-Ks, corresponding share price data and own estimates)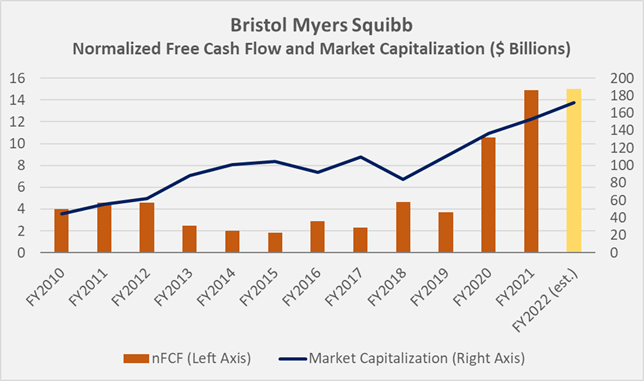
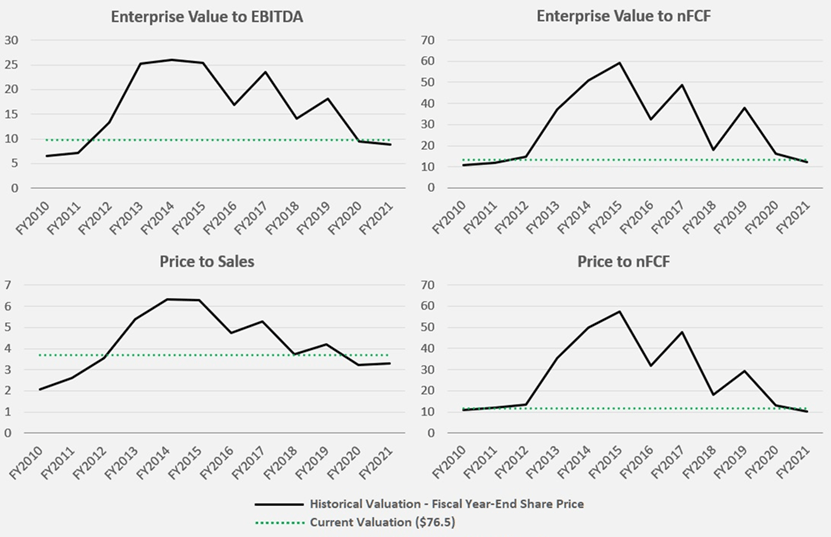
The FAST Graphs chart for BMY in Figure 7 also suggests that the stock still has a lot of catching up to do, and it should be remembered that analysts’ earnings forecasts have generally been met or exceeded in recent years. I would go so far as to suggest that either management has a tendency to under-promise and over-deliver, or that analysts are underestimating BMY’s earnings potential. Finally, I compared the historical EV/EBITDA, EV/normalized FCF, price-to-sales and price-normalized FCF multiples to their respective current valuations based on a share price of $76.5, all of which confirm that the stock is still favorably valued (Figure 8). A discounted cash flow analysis, based on my estimate of BMY’s normalized FCF of $15 billion and assuming a cost of equity of 10%, implies a cashflow growth rate of 1.3% per annum to justify the current share price. An FCF of $16.3 billion per year, which reflects the midpoint of management’s guidance, would reduce the expected growth rate to 0.6% per annum or increase the expectable return accordingly. In summary, investors continue to take a rather conservative view of BMY’s prospects, which is not justified in my opinion.
From a long-term perspective, I think BMY shares are still a solid value even after the strong rally. Consequently, I continue to add to my BMY position, albeit very slowly, while I would not add to my ABBV position, which I still consider overvalued even after the recent drop from $175 to $155.
Figure 7: FAST Graphs chart for BMY, based on adjusted operating earnings (obtained with permission from FAST Graphs) Figure 8: A comparison of various historical valuations to BMY’s current valuation in terms of EV/EBITDA, EV/nFCF, P/S and P/nFCF; note that I incorporated BMY’s share price as observed in the month the company announced each year’s earnings (own work, based on the company’s 2010 to 2021 10-Ks, corresponding share price data and own estimates)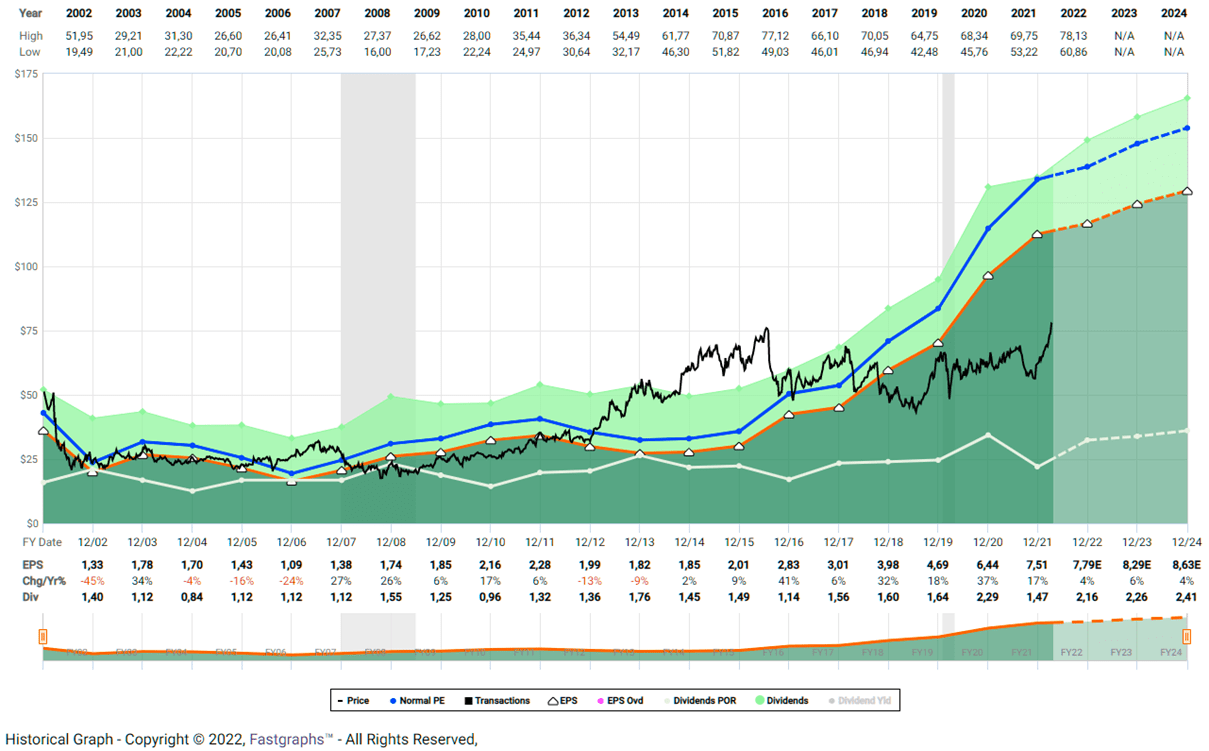
Thank you very much for taking the time to read my article. In case of any questions or comments, I’m very happy to read from you in the comments section below.
Be the first to comment