

Chachawal Prapai
A Quick Take On Brilliant Earth Group
Brilliant Earth Group (NASDAQ:BRLT) went public in September 2021, raising approximately $100 million in gross proceeds from an IPO that was priced at $12.00 per share.
The firm sells responsibly sourced jewelry products and accessories through online and offline channels.
While optimistic investors looking for a potential bargain may wish to put BRLT on a watch list for future consideration, I’m more cautious given a slowing economy.
For the near term, I’m therefore on Hold for BRLT, but it may soon have greater upside potential than downside risk.
Brilliant Earth Overview
San Francisco, California-based Brilliant was founded to create an omni-channel retailer of ethically sourced jewelry products aimed at Millennial and Gen Z consumers.
Management is headed by Chief Executive Officer Beth Gerstein, who has been with the firm since inception and received a B.S. in Biomedical and Electrical Engineering from Duke University.
The company’s primary offerings include:
-
Engagement and wedding rings
-
Gemstone rings
-
Other fine jewelry
The firm pursues customers via online direct-to-consumer [DTC] marketing as well as through its offline showrooms.
BRLT enables consumers to create their own ring design through its marketplace of over 100,000 natural and lab-grown diamonds.
Over 2/3 of the company’s ring collection is proprietary and exclusive to the firm’s online and offline stores.
Brilliant Earth’s Market & Competition
According to a 2020 market research report by Fortune Business Insights, the global market for jewelry was an estimated $330 billion in 2019 and is expected to grow at a compound annual growth rate [CAGR] of 3.7% through 2027.
The main drivers for this expected growth are an increase in disposable income, changing consumer tastes, and increasing adoption of digital media platforms and online sales.
Also, below is a pie chart showing the approximate market share by jewelry type in 2019:
Global Jewelry Market Share By Type (Fortune Business Insights)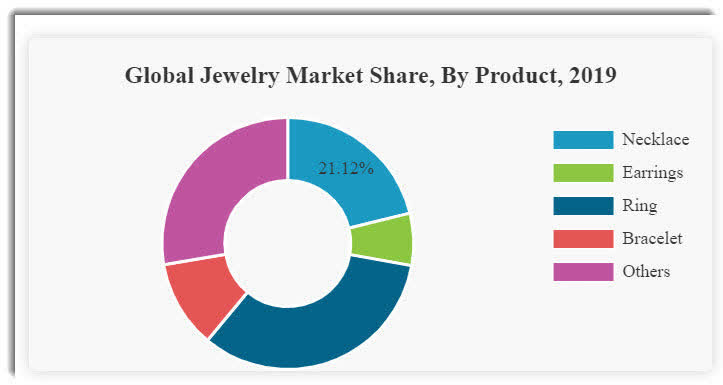
Major competitive or other industry participants by type include:
-
Jewelry retailers and brands
-
Department stores
-
Independent stores
Brilliant Earth’s Recent Financial Performance
-
Total revenue by quarter has risen substantially over the past 9-quarter period:
9 Quarter Total Revenue (Seeking Alpha)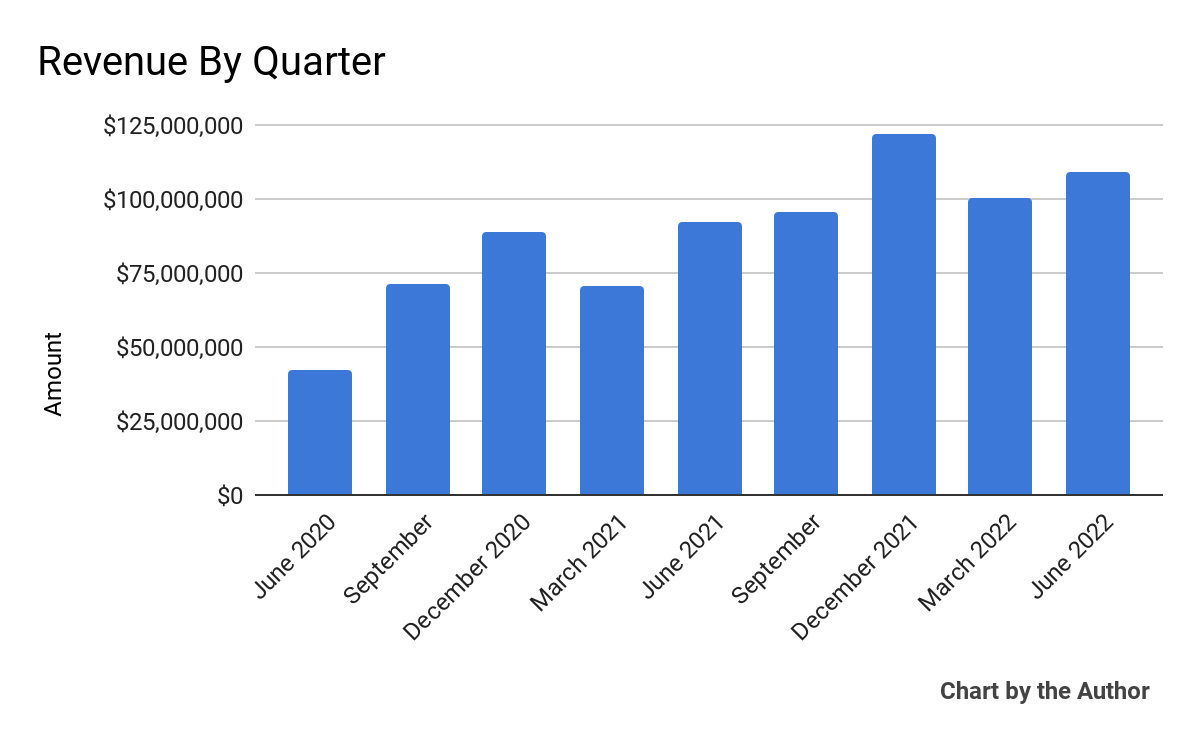
-
Gross profit by quarter has followed a similar growth trajectory as total revenue:
9 Quarter Gross Profit (Seeking Alpha)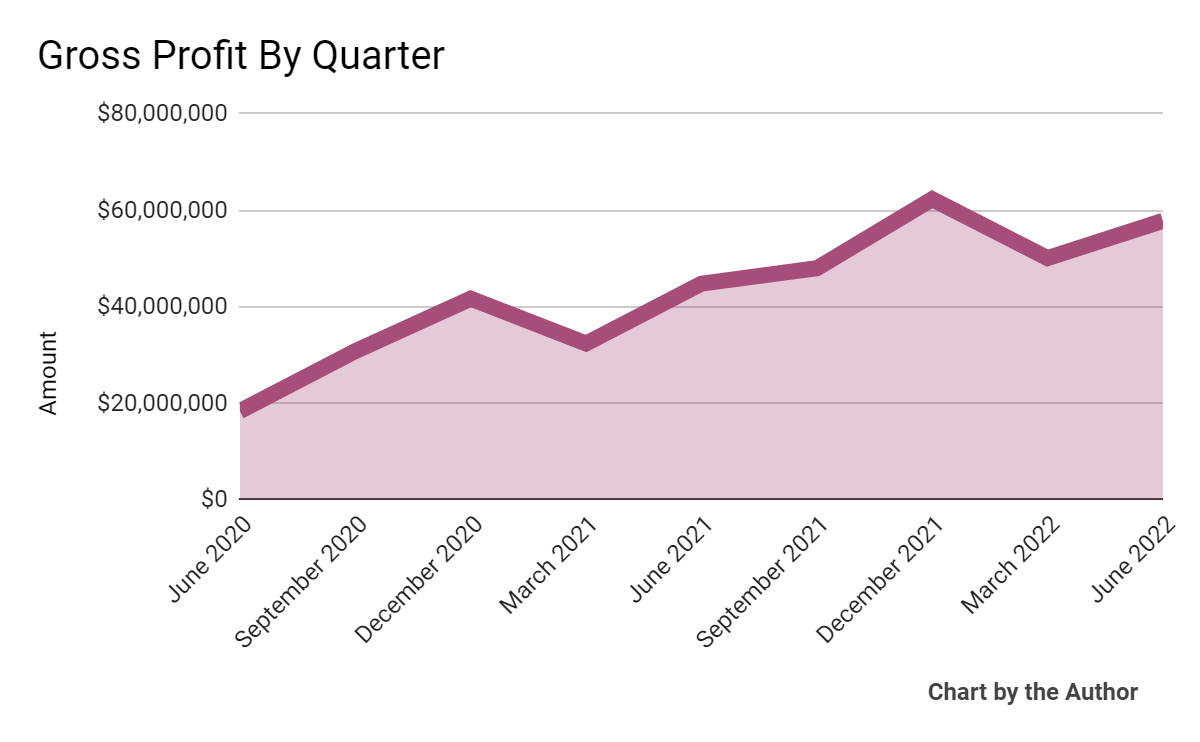
-
Selling, G&A expenses as a percentage of total revenue by quarter have risen as revenue has increased:
9 Quarter Selling, G&A % Of Revenue (Seeking Alpha)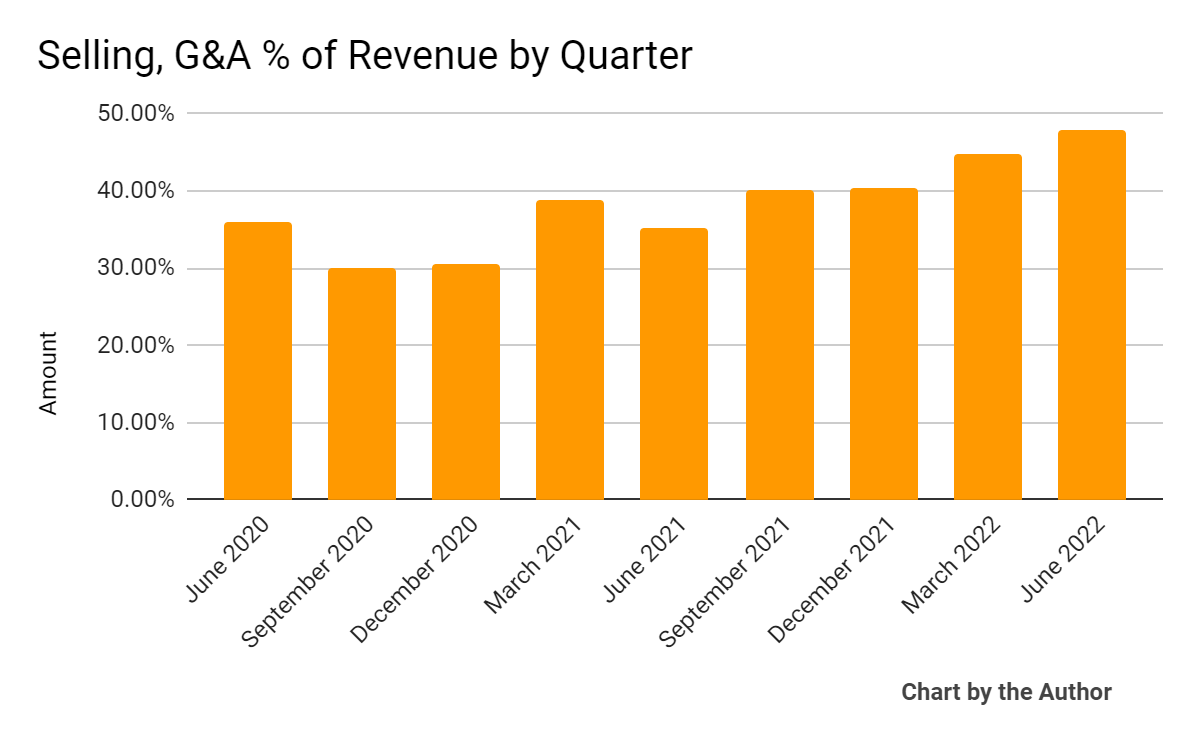
-
Operating income by quarter has dropped materially in recent quarters:
9 Quarter Operating Income (Seeking Alpha)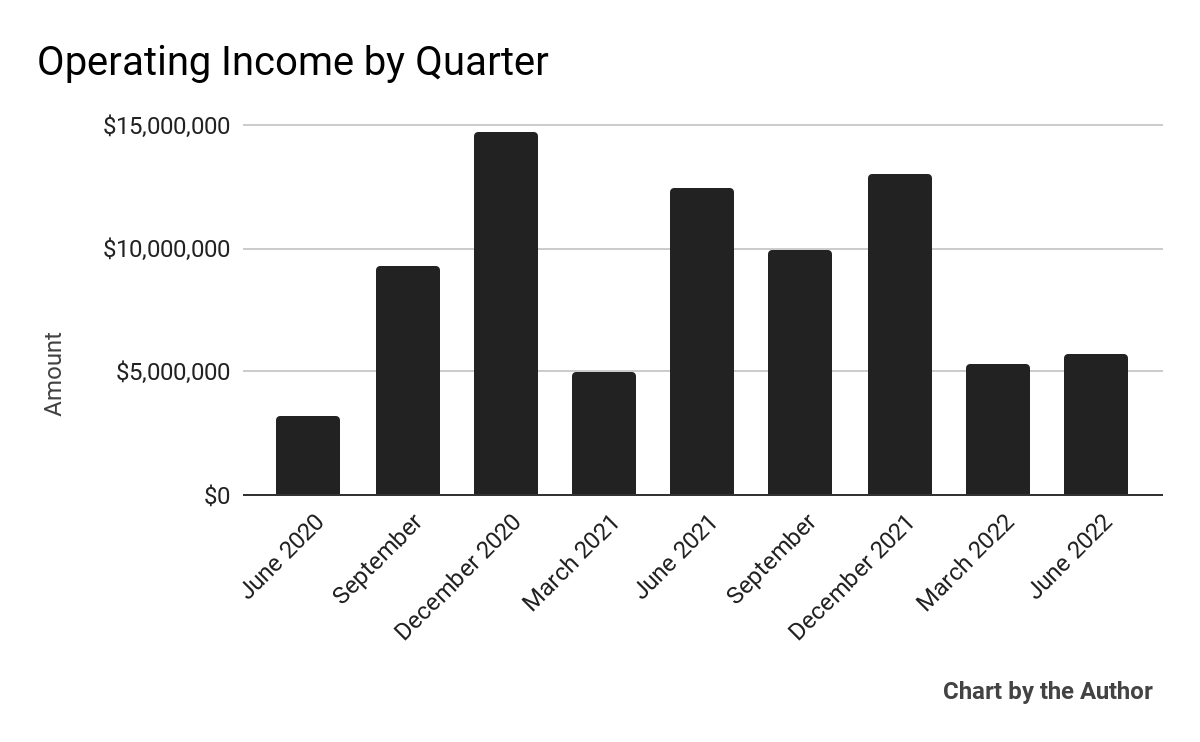
-
Earnings per share (Diluted) has varied since its IPO:
4 Quarter Earnings Per Share (Seeking Alpha)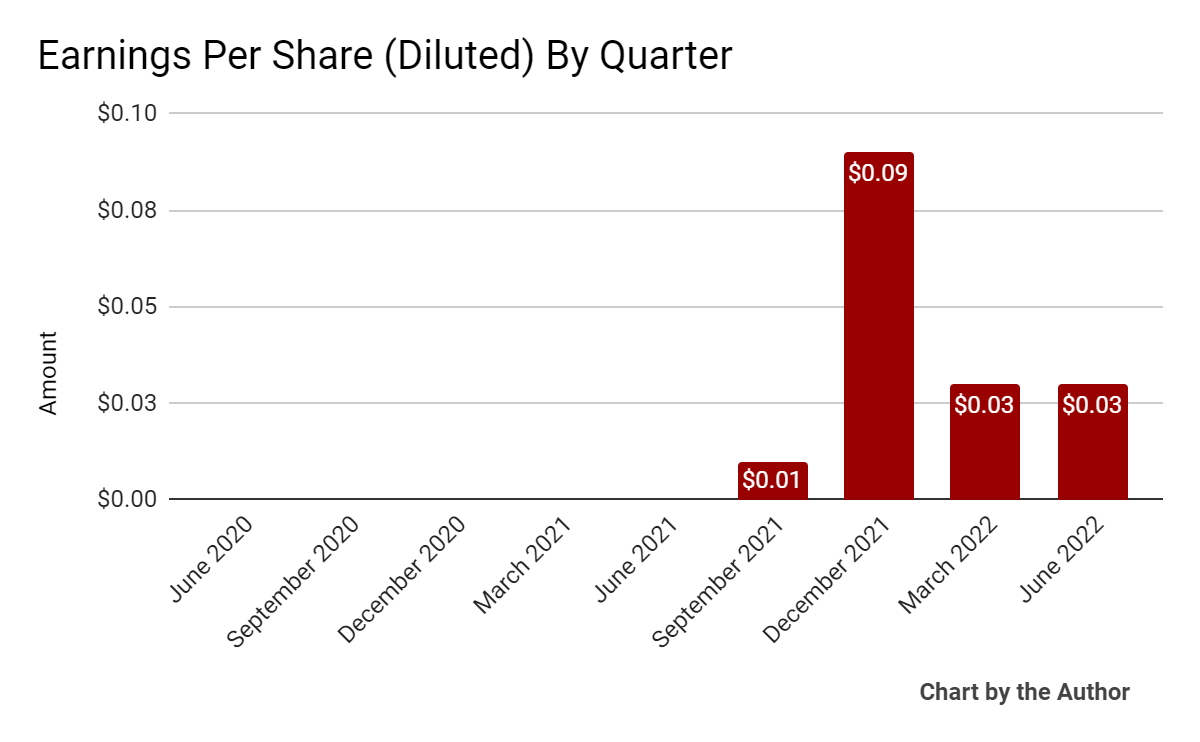
(All data in above charts is GAAP)
Since its IPO, BRLT’s stock price has dropped 53.8% vs. the U.S. S&P 500 index’ drop of around 13.8%, as the chart below indicates:
Stock Price Since IPO (Seeking Alpha)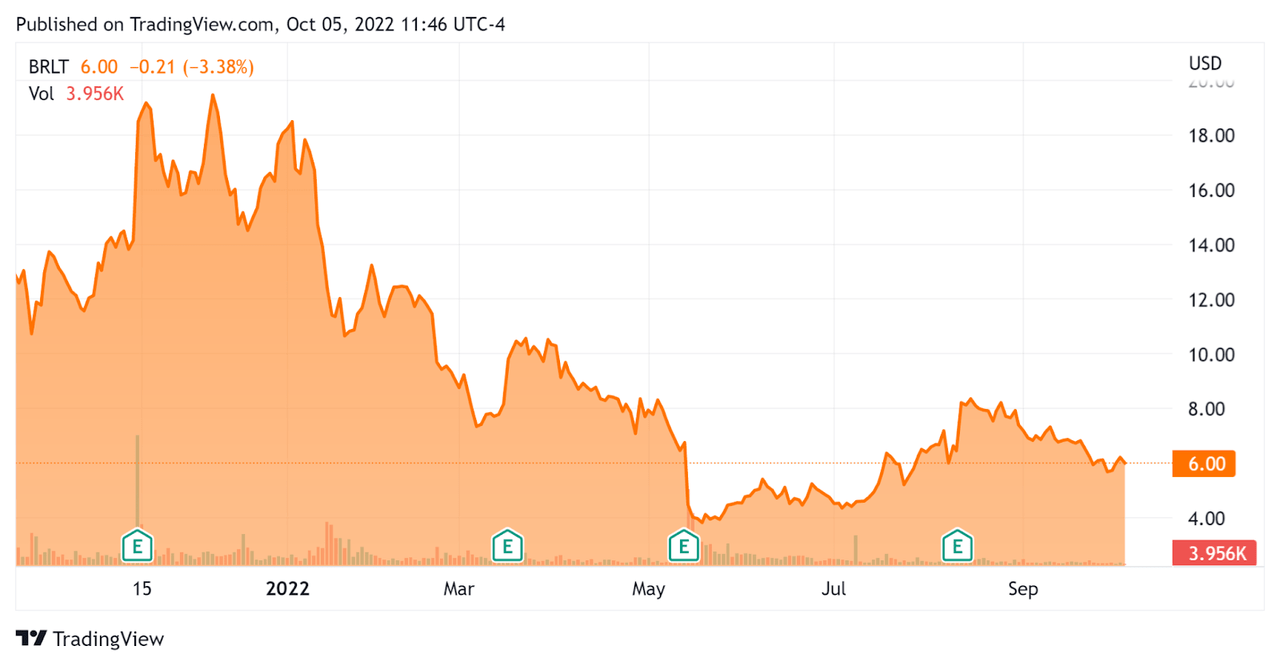
Valuation And Other Metrics For Brilliant Earth Group
Below is a table of relevant capitalization and valuation figures for the company:
|
Measure [TTM] |
Amount |
|
Enterprise Value / Sales |
0.16 |
|
Revenue Growth Rate |
31.9% |
|
Net Income Margin |
-2.0% |
|
GAAP EBITDA % |
8.2% |
|
Market Capitalization |
$568,320,000 |
|
Enterprise Value |
$68 |
|
Operating Cash Flow |
$30,740,000 |
|
Earnings Per Share (Fully Diluted) |
$0.16 |
(Source – Seeking Alpha)
Below is an estimated DCF (Discounted Cash Flow) analysis of the firm’s projected growth and earnings:
BRLT Discounted Cash Flow (GuruFocus)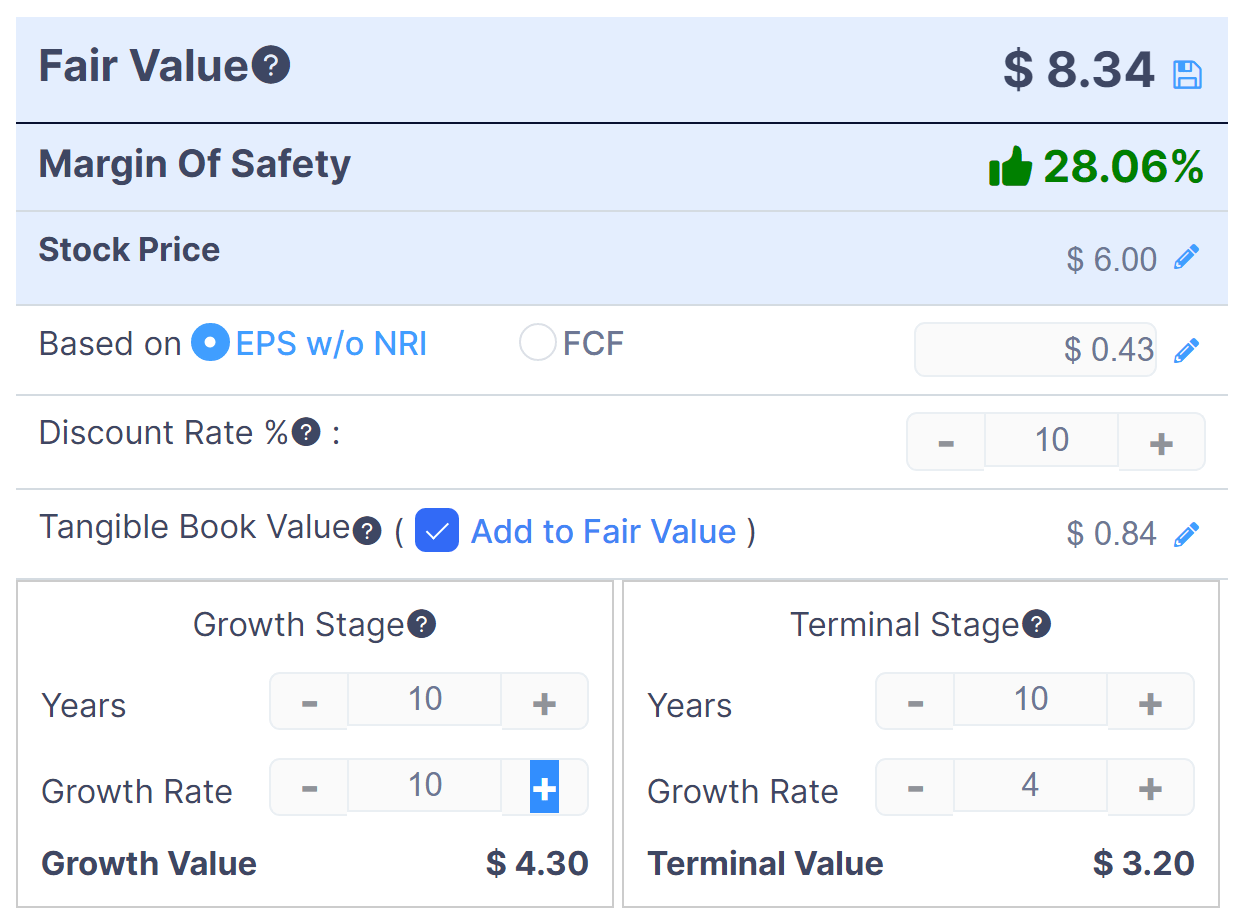
Assuming generous DCF parameters, the firm’s shares would be valued at approximately $8.34 versus the current price of $6.00, indicating they are potentially currently undervalued, with the given earnings, growth and discount rate assumptions of the DCF.
As a reference, a relevant partial public comparable would be retail competitor Signet Jewelers (SIG); shown below is a comparison of their primary valuation metrics:
|
Metric |
Signet Jewelers |
Brilliant Earth |
Variance |
|
Enterprise Value / Sales |
0.48 |
0.16 |
-66.7% |
|
Revenue Growth Rate |
14.1% |
31.9% |
126.7% |
|
Net Income Margin |
5.9% |
-2.0% |
–% |
|
Operating Cash Flow |
$683,900,000 |
$30,740,000 |
-95.5% |
(Source – Seeking Alpha)
A full comparison of the two companies’ performance metrics may be viewed here.
Commentary On Brilliant Earth
In its last earnings call (Source – Seeking Alpha), covering Q2 2022’s results, management highlighted the growth of its omni-channel approach, with six new retail locations bringing its total retail footprint to 21 showrooms.
The company is also focused on increasing its engagement through major social platforms such as TikTok.
Management sees 2022 as the ‘year of wedding’, due to couples having put off their weddings in 2020 and 2021 as a result of the pandemic.
As to its financial results, total revenue grew by 18% year-over-year and gross margin rose by 4.6% to reach a record 53.1%.
However, operating income dropped substantially year-over-year, from $12.4 million in Q2 2021 to $5.7 million in the same quarter of 2022.
The company continues to spend significantly on marketing efforts and is seeing higher headcount costs after the pandemic has waned.
For the balance sheet, the firm ended the quarter with $155.5 million in cash and $61.0 million in long-term debt.
Over the trailing twelve months, free cash flow was $23.7 million, including $7.0 million in CapEx.
Looking ahead, management reiterated previous guidance for revenue growth of 21% at the midpoint of the range, with improvement in gross margin and adjusted EBITDA of $35 million at the midpoint.
Adjusted figures typically exclude stock-based compensation and one-time items.
Regarding valuation, the market is valuing BRLT at a significantly lower revenue multiple than retail competitor Signet, even though BRLT is growing revenue faster.
Also, my discounted cash flow analysis indicates that BRLT may be undervalued at its current level of around $6.00 per share.
The primary risk to the company’s outlook is a macroeconomic slowdown, reducing discretionary spending by consumers on non-essential items. Also, getting past 2022’s ‘year of the wedding’ may indicate reduced revenue growth in 2023.
While optimistic investors looking for a potential bargain may wish to put BRLT on a watch list for future consideration, I’m more cautious given a slowing economy.
For the near term, I’m therefore on Hold for BRLT, but it may soon have greater upside potential than downside risk.
Be the first to comment