

jewhyte
Introduction
London-based BP p.l.c. (NYSE:BP) released its second quarter of 2022 results on August 2, 2022.
Note: I have followed BP quarterly since 2014 with 38 articles and counting. This new article is a quarterly update of my article published on June 8, 2022.
1 – 2Q22 results Snapshot
BP reported second-quarter adjusted earnings of $2.61 per American Depositary Share (“ADS”) on a replacement cost basis beating analysts’ expectations ($0.83 per share in the same period a year ago). The solid quarterly results were driven by higher commodity prices and a more substantial refining business. BP also posted strong refinery results.
Total revenues (including other investments) were $69.506 Billion, also beating analysts’ expectations. Here is a 2Q22 snapshot:
BP 2Q22 Underlying results (BP Presentation)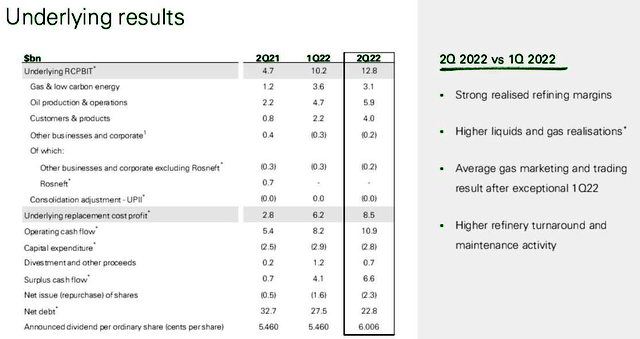
Hydrocarbon price per $/Boe was up 75% from last year and up 13.2% sequentially.
Note: The price of hydrocarbons received by BP this quarter was $73.24 per Boe, and the natural gas price was $8.31 per MMBtu.
2 – Stock performance
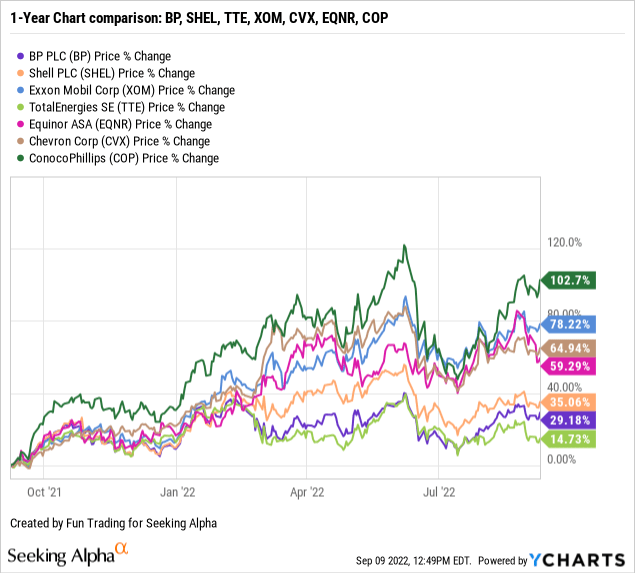
BP is part of my “seven oil majors” group, including Exxon Mobil (NYSE: XOM) and Shell Plc (SHEL), Equinor (NYSE: EQNR), TotalEnergies SE (NYSE: TTE), Chevron (NYSE: CVX), and the E&P ConocoPhillips (NYSE: COP). ConocoPhillips is not considered an oil supermajor, but I believe it’s a strong oil company that belongs to the group.
BP is up 24% on a one-year basis and has underperformed its peers significantly.
The company pays a quarterly dividend of $0.36036 per share, up 10% sequentially, and is back to a nearly 4% yield.
CEO Bernard Looney said in the conference call:
Today’s results show our portfolio doing what it is supposed to do, capturing the upside from higher prices. And as the first chart shows, over the decade, we expect our oil and gas EBITDA to remain highly leveraged to price as we high-grade our portfolio and reduce production. This is enabled by EBITDA growth coming from just six material regions.
3 – Investment thesis
BP is one of my long-term investments in the oil industry, but it has been a problematic stock to manage appropriately with technical issues and weaknesses. It is one of the world’s major oil companies that I consider safe to keep for the long term, but only if you combine a long-term investment with some short-term trading.
BP Dividend comparison (Fun Trading)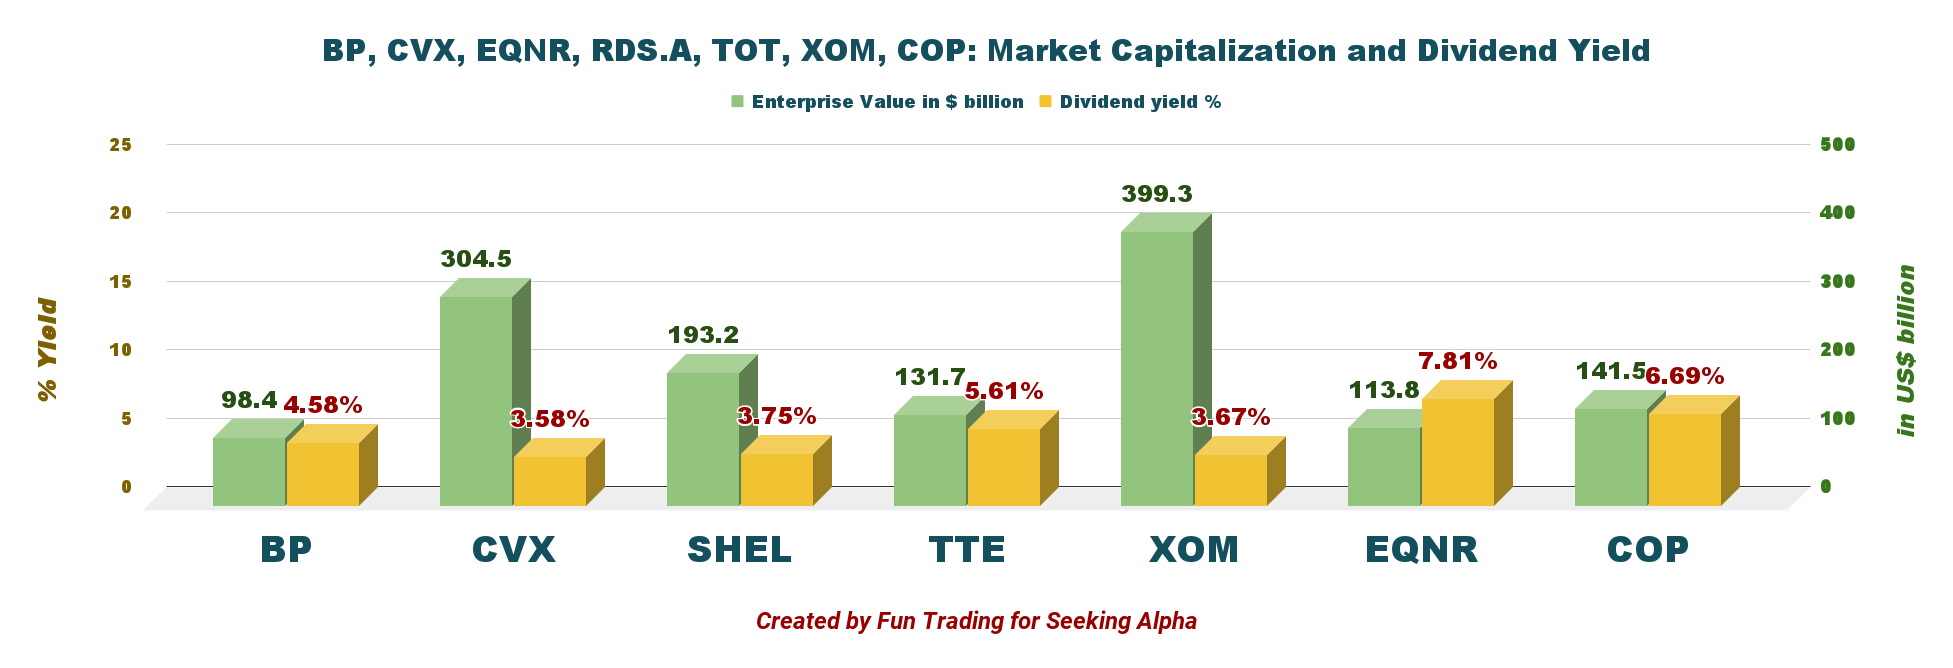
The stock performance has not been stellar compared to many of its peers, and if we look at the long term, BP is vastly underperforming the general market.
Thus, I believe long-term investors should continue accumulating this cyclical stock on any significant weakness. But, due to extreme volatility in the oil industry, I recommend short-term trading LIFO. About 30% to 40% should be allocated for this task to minimize the risks of a sudden severe retracement recurring like clockwork.
BP Plc – Financial Table 2Q22: The Raw Numbers
Note: Each BP ADS represents six “ordinary shares” of BP. Ordinary shares are the English equivalent of common stock in a U.S. corporation.
| BP | 2Q21 | 3Q21 | 4Q21 | 1Q22 | 2Q22 |
| Revenues in $ Billion | 36.47 | 36.17 | 50.55 | 49.26 | 67.87 |
| Total Revenues and others in $ Billion | 37.60 | 37.87 | 52.24 | 51.22 | 69.51 |
| Net income in $ Billion | 3.12 | -2.54 | 2.33 | -20.38 | 9.26 |
| EBITDA $ Billion | 9.48 | 4.17 | 8.40 | -13.20 | 18.21 |
| EPS diluted in $/share | 0.92 | -0.76 | 0.70 | -6.27 | 2.83 |
| Cash from operating activities in $ Billion | 5.41 | 5.98 | 6.12 | 8.21 | 10.86 |
| Capital Expenditure Quarterly in $ Billion |
2.44 |
2.67 |
2.77 |
2.60 |
2.67 |
| Free Cash Flow in $ Billion | 2.98 | 3.31 | 3.34 | 5.61 | 8.20 |
| Total cash (+other investments) $ Billion | 34.42 | 30.89 | 26.22 | 34.51 | 33.24 |
| Gross Debt in $ Billion (not including lease) | 68.25 | 63.21 | 61.18 | 60.61 | 52.87 |
| Dividend per share in $ | 0.3276 | 0.3276 | 0.3276 | 0.3276 | 0.36036 |
| Shares outstanding (diluted) in Billion | 3.394 | 3.358 | 3.327 | 3.252 | 3.270 |
| Oil Production detail and Renewable | 2Q21 | 3Q21 | 4Q21 | 1Q22 | 2Q22 |
| Oil Equivalent Production in K Boep/d | 2,120 | 2,202 | 2,332 | 2,252 | 2,198* |
| Production Rosneft in K Boep/d | 1,095 | 1,120 | 1,126 | 750 | 0 |
| Global liquid price ($/Boe) | 41.84 | 47.57 | 56.46 | 64.70 | 73.24 |
| Global Natural gas price ($/M BTU) | 4.08 | 5.35 | 7.41 | 8.24 | 8.31 |
| Total Developed renewables to FID and Renewables pipeline in net GW | – | – | 27.5 | 29.5 | 30.1 |
Sources: Company release
* The total equivalent Production represents the gas production operations for 924K Boep/d and oil production operations for 1,274K Boep/d.
Analysis: Revenues, Earnings Details, Free Cash Flow, And Upstream Production
1 – Quarterly total revenues and other investments were $69.51 billion in 2Q22
Note: The four quarters of 2020 have been restated, which is confusing historically.
BP Quarterly Revenues history (Fun Trading)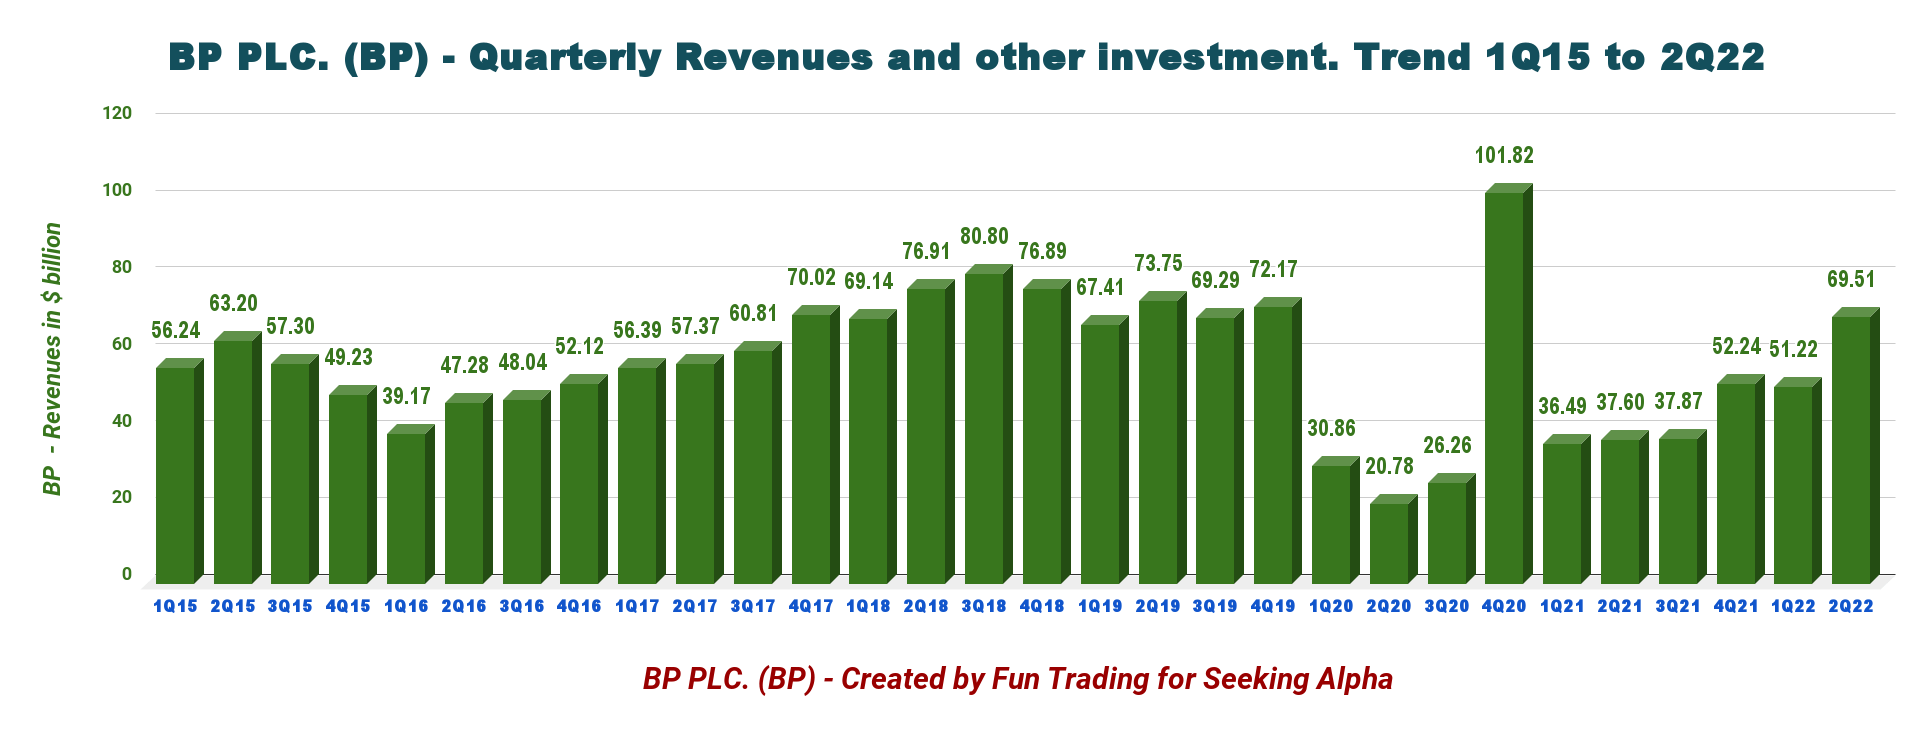
Note: In 2020, revenues from physically settled derivative contracts were reclassified as other operating revenues and were no longer presented with revenues from customers’ contracts. It explains the jump in revenues seen in 4Q20.
BP had total revenues of $69.51 billion for the quarter (oil revenues are $67.87 billion). CapEx in the second quarter of 2022 was $2.67 billion, compared with $2.44 billion in the second quarter of 2021.
The income attributable to BP’s shareholders in the second quarter was $9.257 billion compared to $3.116 billion last year.
Operating cash flow in the quarter of $10.863 billion includes $1.2 billion of Gulf of Mexico oil spill payments of $2.9 billion.
Total divestment and other proceeds for the second quarter were $0.7 billion, compared with $0.2 billion for the same period in 2021.
Note about the new tax levy:
On 11 July 2022 the UK government introduced legislation which imposes a new levy on the profits of UK oil and gas companies. The new levy will increase the headline rate of tax from 40% to 65% on profits from bp’s North Sea business made from 26 May 2022 until 31 December 2025.
2 – Free Cash Flow (not including divestitures)
BP Quarterly Free cash flow history (Fun Trading)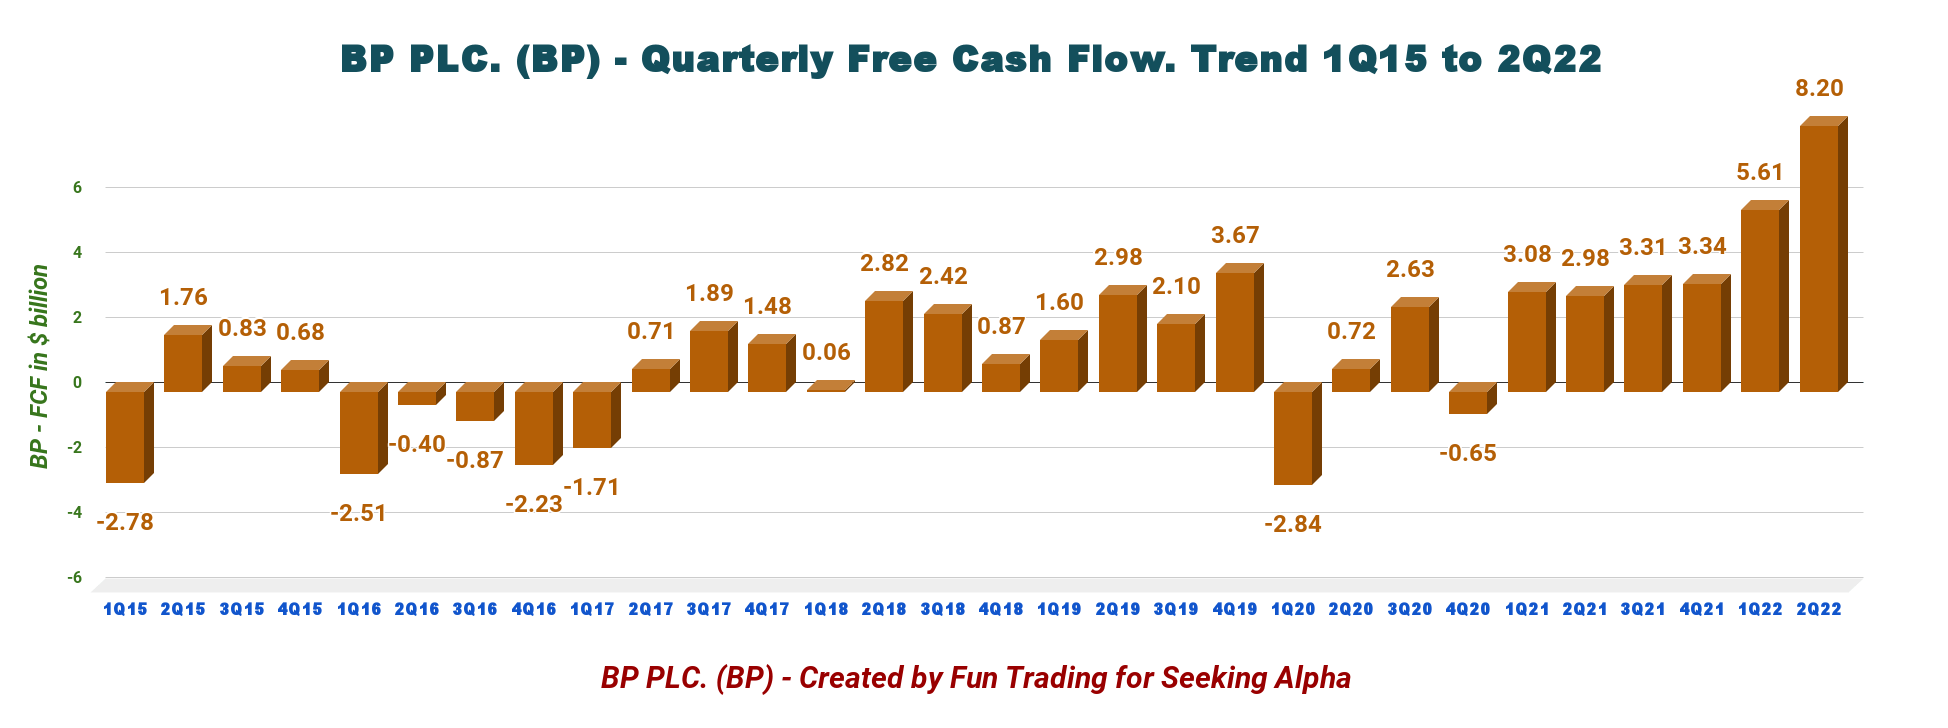
Trailing 12-month free cash flow (“ttm”) was $20.459 billion, with a second-quarter of 2022 of $8.197 billion.
Cash flow from operations increased sequentially to a record of $10.863 billion.
BP Quarterly Cash flow from operations history (Fun Trading)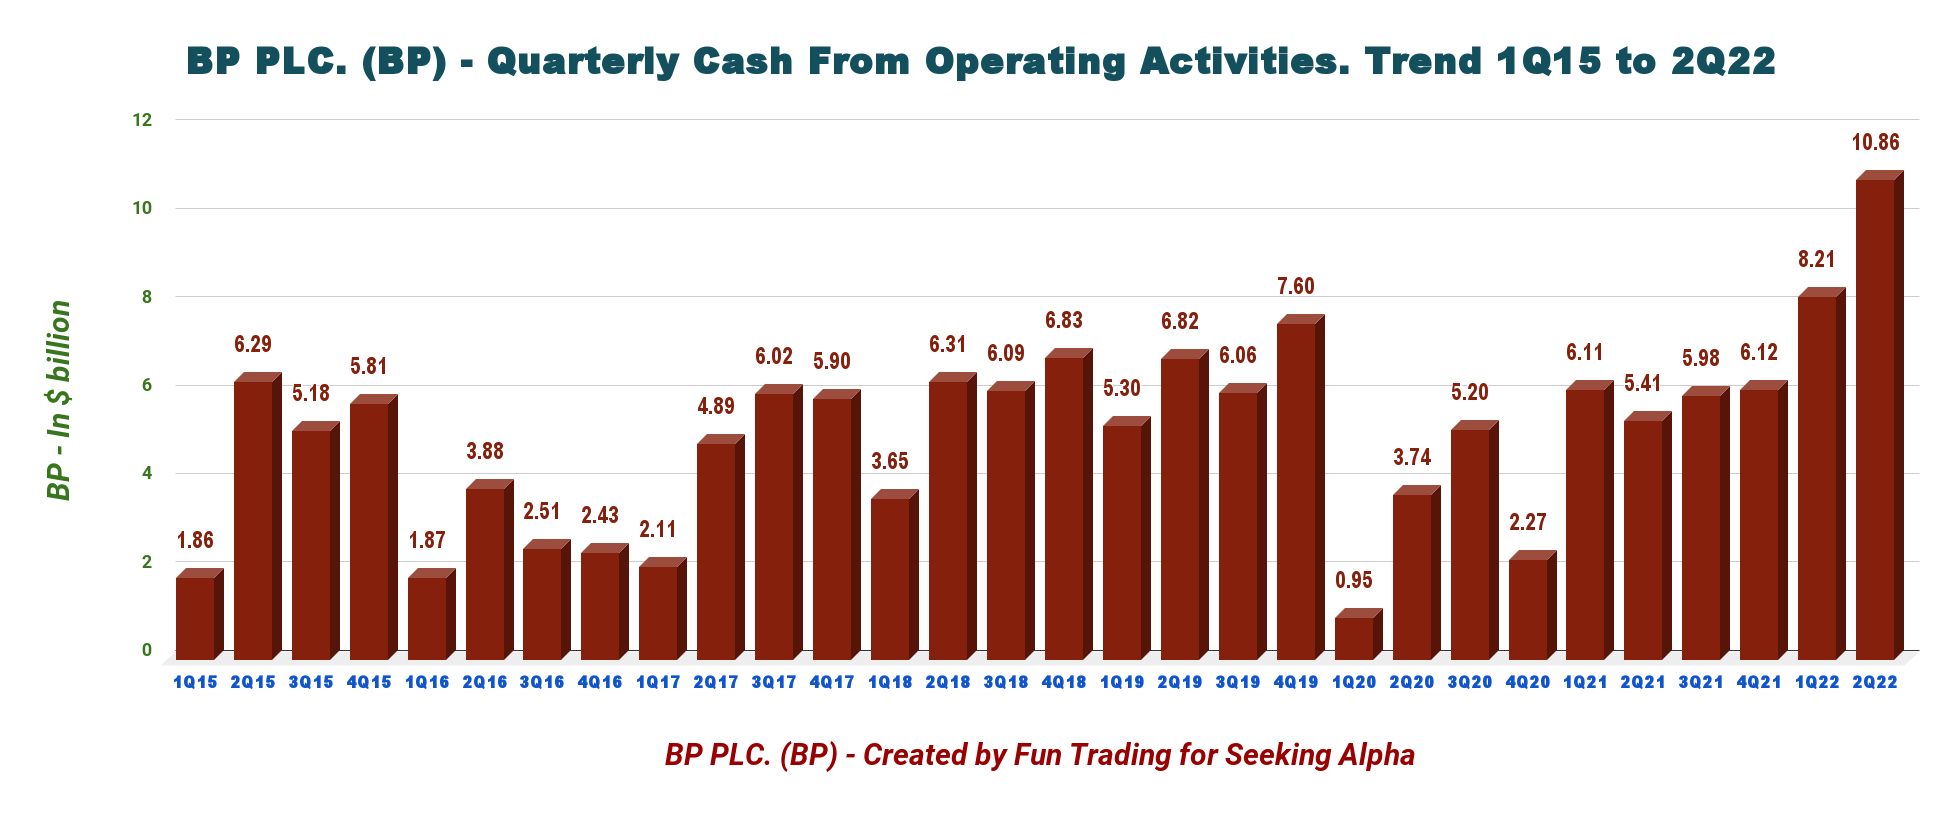
Moreover, the company revealed plans to execute a $3.5 billion share buyback, which is expected to be completed before reporting the third-quarter results. BP anticipates buying back $1 billion of shares every quarter, based on Brent crude price at $60 per barrel.
3 – Oil production (Upstream and now Rosneft out)
BP Quarterly oil equivalent production history (Fun Trading)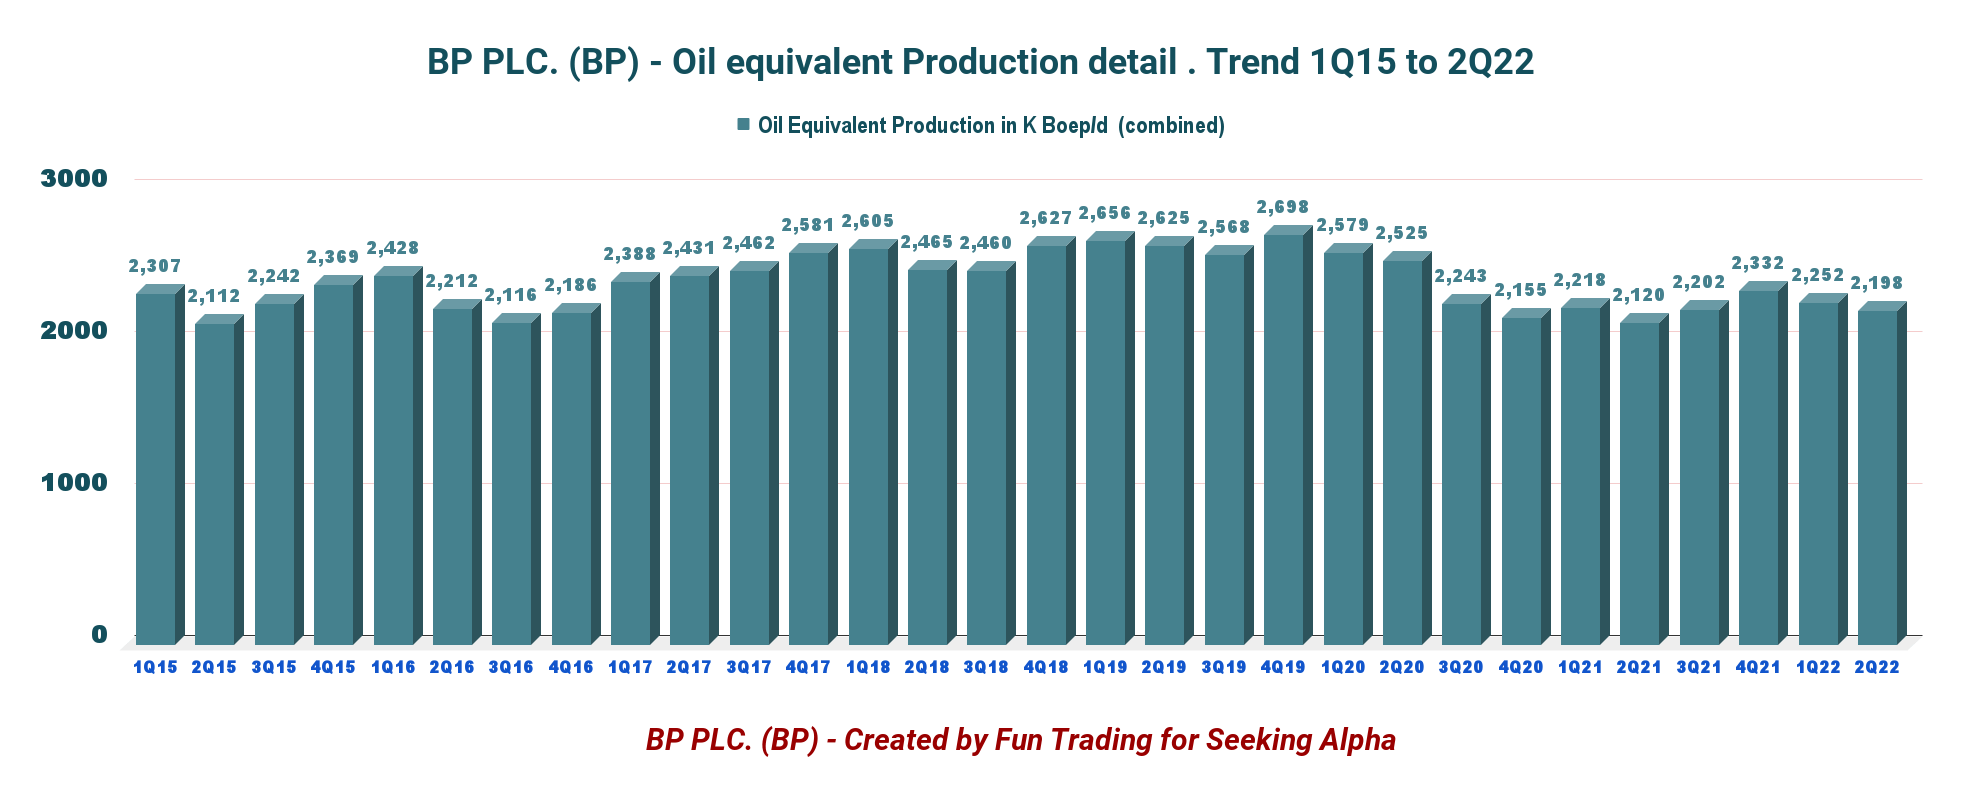
- Upstream: The quarter’s production was 2,198K Boep/d, up 3.7% compared to last year and down 2.4% sequentially. Oil production and operations represent 1,274K Boep/d, and gas and low carbon energy represent 935K Boep/d.
Prices for oil and natural gas are now at a multi-year high. The company sold its total hydrocarbon per Boe at $73.24 during the second quarter compared with $37.75 in the same period last year. The natural gas price was $8.24 per thousand cubic feet compared with $4.08 in the year-ago quarter.
BP Quarterly oil and NG prices history (Fun Trading)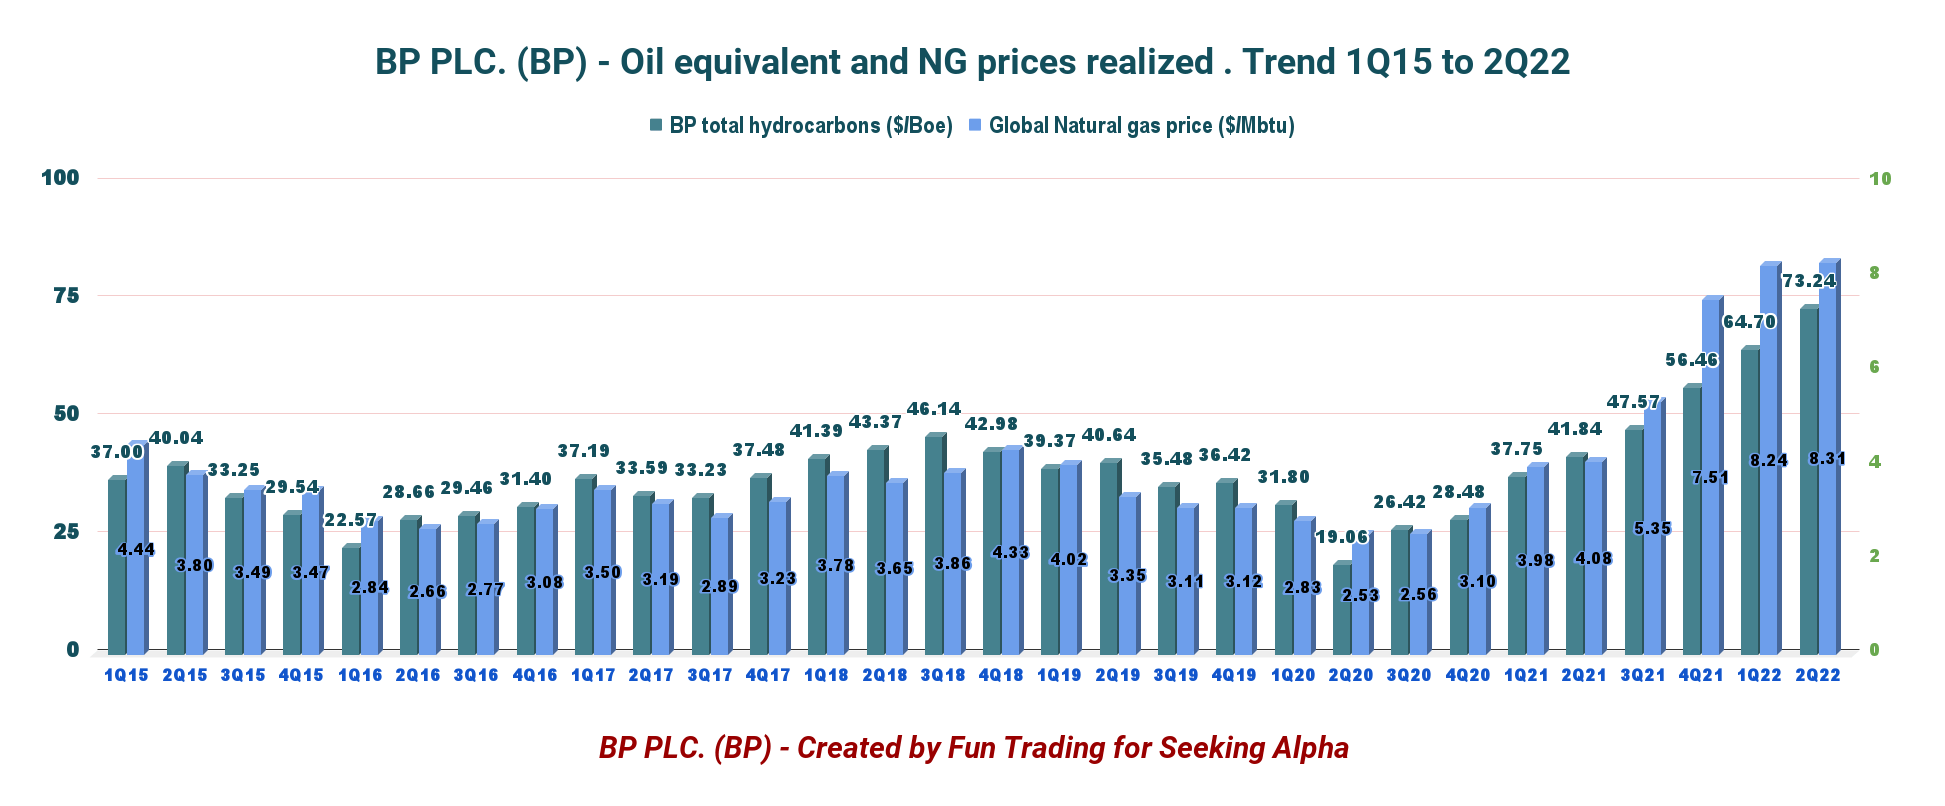
- Gas and low carbon energy
Profits increased to $3,080 million in 2Q22 from a profit of $1,240 million last year, mainly due to increased oil equivalent production and price.
In the second quarter, total production was 924K Boep/d, up from 875K Boep/d last year. Key project ramp-ups helped again this quarter.
Also, in this category, the company indicates the total developed renewables to FID and renewables pipeline at 29.2 GW, up from 17.1 GW last year.
BP Low carbon 2Q22 (BP Presentation)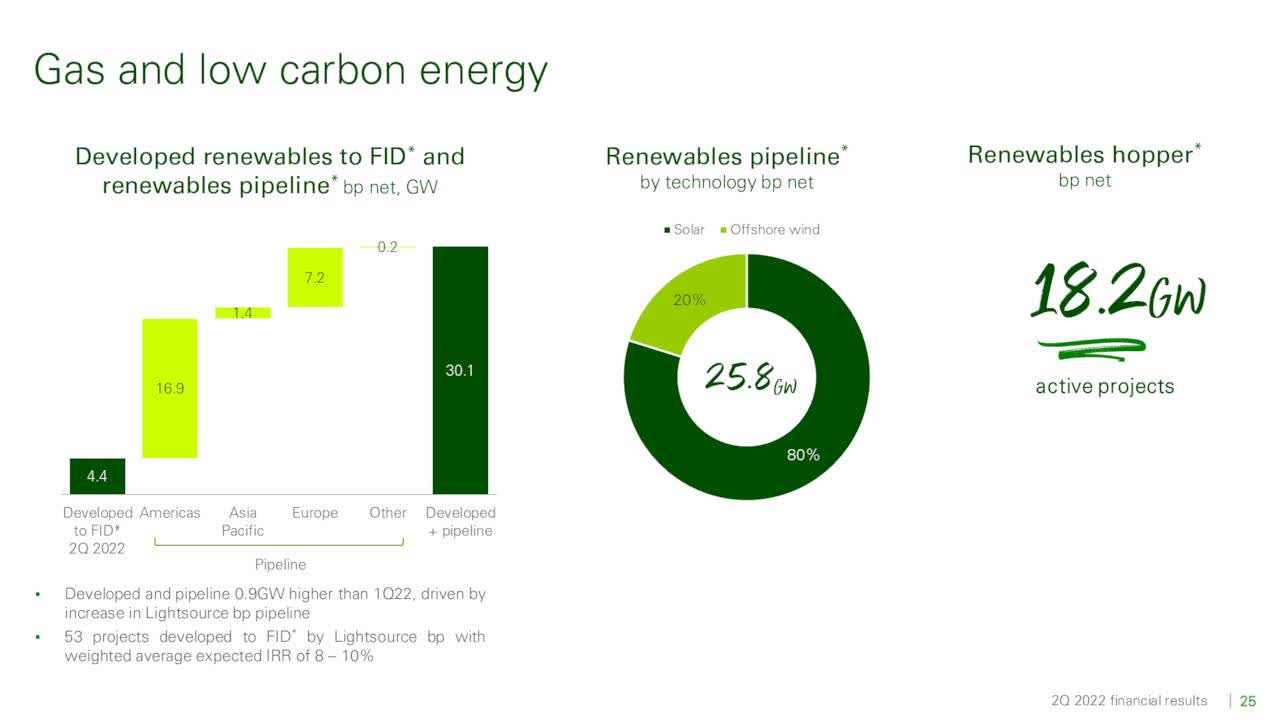
-
Oil production and operations
For the second quarter, the total production of 1,274K Boep/d was slightly up from 1,245K Boep/d in the year-ago quarter.
After adjusting for non-operating items, underlying replacement cost earnings before interest and tax for the segment were $5,902 million. It compares to $2,242 million in the year-ago quarter.
- Customer & products
Underlying RC earnings before interest and tax were $4,006 million in 2Q22, up from $827 million last year.
BP-operated refining availability at the June-end quarter was 94.4%, increasing from 94.1% in the year-ago quarter.
Total refinery throughputs from the second quarter were reported at 1,480 thousand barrels per day (MBbl/D), declining from 1,507 MBbl/D in the prior-year quarter.
4 – Net debt is $27.46 billion in 2Q22 (or $36.13 billion, including lease liabilities).
“Under IFRS 16, we now recognize leases on the balance sheet as right of use assets. This results in a corresponding lease liability on the balance sheet, which we have disclosed separately to finance debt. Indicated in the conference call.”
BP Quarterly cash versus debt history (Fun Trading)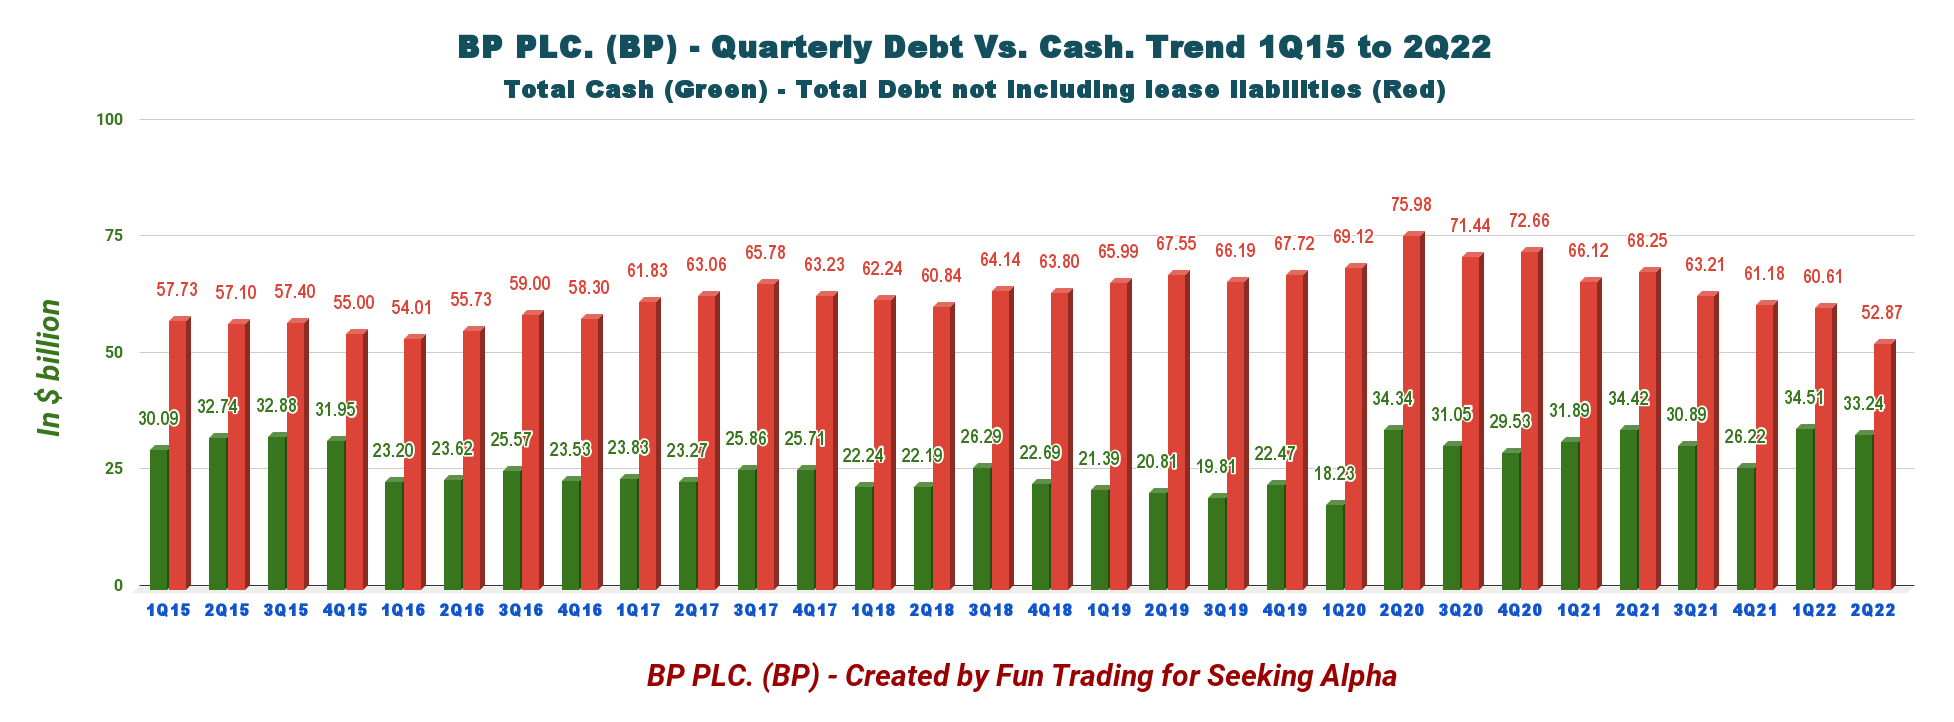
BP’s net debt is now $22.82 billion or $30.89 billion, including lease liabilities. Gearing is 21.9% (27.5% including leases).
The debt to equity ratio has dropped to 0.793, which is still high, but this segment has improved significantly.
5 – Outlook for 2022
For 2022, BP expects a CapEx of $14-15 billion and $14-16 billion per annum through 2025.
The company anticipates upstream production to remain flat in 2022.
It also expects oil and gas prices to remain high in the third quarter due to the ongoing supply disruptions resulting from the Russia-Ukraine conflict. Hence, industry refining margins will be elevated in the third quarter.
BP expects to receive $2-3 billion of divestment and other proceeds this year. BP has received $14.7 billion of proceeds from the $25 billion scheduled until 2025.
CEO Bernard Looney explained in the conference call:
Our strategy in oil and gas is to maximize returns and cash flow, creating resilience through lower costs, higher margins and lower operating emissions, focusing on the best barrels, and high-grading through divestments and at the right time and for the right value.
Technical Analysis and commentary
BP TA Chart short-term (Fun Trading StockCharts)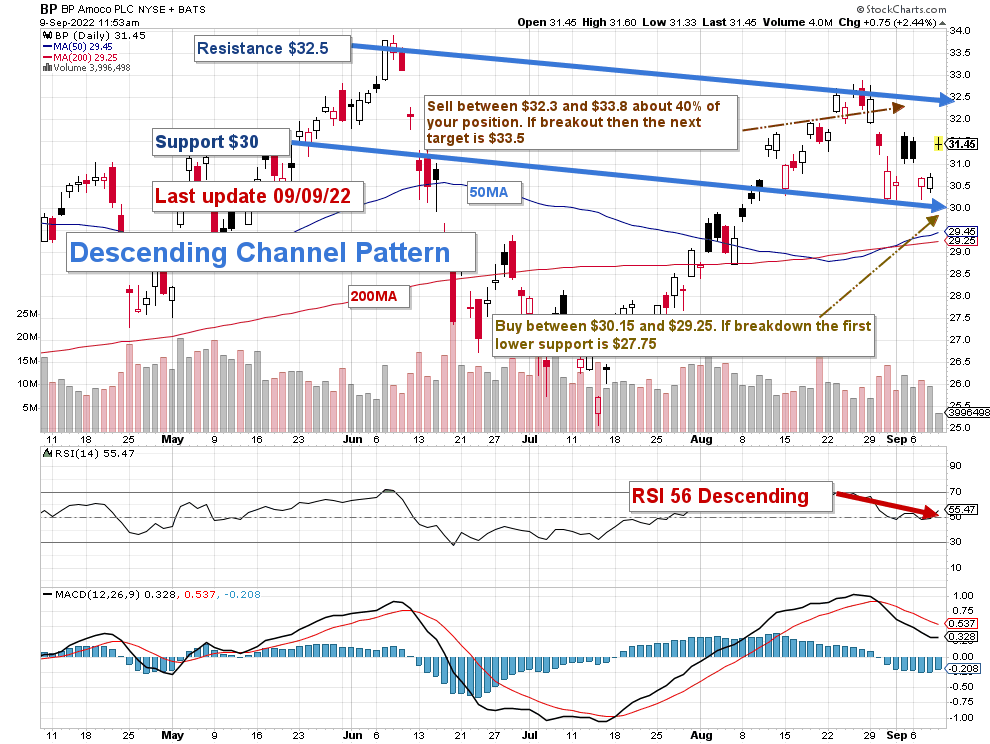
Note: The chart has been adjusted for the dividend.
BP forms a descending channel pattern with resistance at $32.5 and support at $30.
The trading strategy is to sell about 30-40% of your long position, partially between $32.3 and $33.8. If BP crosses the resistance (breakout) due to bullish oil prices, the following resistance range is between $35 and $35.50. However, I do not consider this possible event as very likely, with oil prices weakening below $90 per barrel and a possible recession materializing by the end of 2022.
On the other hand, if oil prices continue to weaken, I recommend buying BP between $30.15 and $29.25 with possible lower support at $27.75.
Note: The LIFO method is prohibited under International Financial Reporting Standards (IFRS), though it is permitted in the United States by Generally Accepted Accounting Principles (GAAP). Therefore, only US traders can apply this method. Those who cannot trade LIFO can use an alternative by setting two different accounts for the same stock, one for the long term and one for short-term trading.
Warning: The TA chart must be updated frequently to be relevant. It is what I am doing in my stock tracker. The chart above has a possible validity of about a week. Remember, the TA chart is a tool only to help you adopt the right strategy. It is not a way to foresee the future. No one and nothing can.
Author’s note: If you find value in this article and would like to encourage such continued efforts, please click the “Like” button below to vote of support. Thanks.
Be the first to comment