

Alphotographic
Introduction
London-based BP p.l.c. (NYSE: NYSE:BP) released its third quarter of 2022 results on November 1, 2022.
Note: I have followed BP quarterly since 2014, with 39 articles and counting. This new article is a quarterly update of my article published on September 9, 2022.
1 – 3Q22 results Snapshot
BP reported third-quarter adjusted earnings of $8.2 billion on a replacement cost basis, beating analysts’ expectations. These were slightly lower than the record $8.5 billion in 2Q22 but significantly higher than the $3.3 billion earned in 3Q21.
The company announced an additional $2.5 billion share buyback after indicating an outstanding gas profit. In the press release:
During the third quarter bp generated surplus cash flow of $3.5 billion and intends to execute a $2.5 billion share buyback prior to announcing its fourth-quarter results, bringing total announced share buybacks from 2022 surplus cash flow to $8.5 billion, equivalent to 60% of 2022 surplus cash flow year to date.
Total revenues (including other investments) were $57.808 Billion, also beating analysts’ expectations. Hydrocarbon price per $/Boe was up 55.2% from last year and up 0.7% sequentially.
Note: The price of hydrocarbons received by BP this quarter was $73.76 per Boe, and the natural gas price was $10.31 per MMBtu.
2 – Stock performance
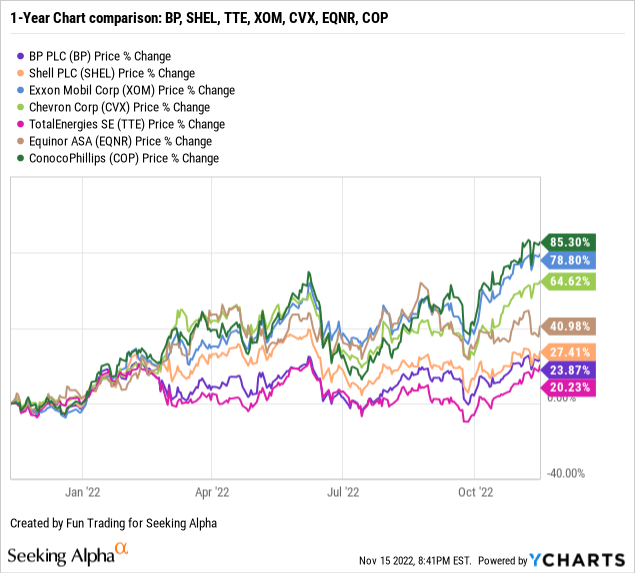
BP is part of my “seven oil majors” group, including Exxon Mobil (NYSE: XOM) and Shell Plc (SHEL), Equinor (NYSE: EQNR), TotalEnergies SE (NYSE: TTE), Chevron (NYSE: CVX), and the E&P ConocoPhillips (NYSE: COP). ConocoPhillips is not considered an oil supermajor, but I believe it’s a strong oil company that belongs to the group.
BP is up 24% on a one-year basis and has underperformed its peers significantly, with XOM, CVX, and COP leading the group.
The company pays a quarterly dividend of $0.36036 per share or nearly 4.25% yield.
CFO Murray Auchincloss said in the conference call:
During the third quarter, we delivered $8.2 billion of underlying earnings and operating cash flow of $8.3 billion, including a working capital build of $6.2 billion. We continue to execute against our disciplined financial frame, reducing net debt for the tenth consecutive quarter to reach $22 billion and announcing a further $2.5 billion share buyback. And we have momentum in our transformation to an integrated energy company.
3 – Investment thesis
BP is one of my long-term investments in the oil industry, but it has been a challenging stock to manage appropriately with technical issues and weaknesses. It is not an easy task to be a European oil major.
However, It is one of the world’s major oil companies that I consider secure to keep for the long term, but only if you combine a long-term investment with some short-term trading LIFO or something similar for investors who cannot trade LIFO.
Applying the right trading/investing strategy is crucial to maximizing your return. All stocks are not created equal and demand a thorough technical and fundamental analysis to provide reasonable returns while minimizing the risks.
The stock performance has been slightly disappointing if we compare BP to most of its peers. Perhaps because BP has further signaled its commitment to alternative energy as severe volatility characterizes the current oil markets, shifting to green energy will provide little cash flow and demand a high CapEx.
BP has started the long journey to invest in electric vehicle (EV) charging stations in the UK and be a leader in green power like Biofuel and wind.
CFO Murray Auchincloss said in the conference call:
[W]e have continued to advance our strategy to create integrated low-carbon energy hubs. In Australia, we have closed a deal to take a 40.5% stake in Asian Renewables Energy Hub. And our 2 BP-led projects in the U.K., H2Teesside and Net Zero Teesside Power were shortlisted in Phase 2 of the U.K. government’s cluster sequencing process for support of CCUS.
BP expects to halve its operational emissions by 2030, with the group planning to reach net zero by 2050 or sooner.
Thus, long-term investors should continue accumulating this cyclical stock on any significant weakness. But, due to extreme volatility in the oil industry and the costly shift to renewable, I recommend short-term trading LIFO. About 30% to 40% should be allocated to this task to minimize the risks of a sudden severe retracement recurring like clockwork.
BP Plc – Financial Table 3Q22: The Raw Numbers
Note: Each BP ADS represents six (6) “ordinary shares” of BP. Ordinary shares are the English equivalent of common stock in a U.S. corporation.
| BP | 3Q21 | 4Q21 | 1Q22 | 2Q22 | 3Q22 |
| Revenues in $ Billion | 36.17 | 50.55 | 49.26 | 67.87 | 55.01 |
| Total Revenues and others in $ Billion | 37.87 | 52.24 | 51.22 | 69.51 | 57.81 |
| Net income in $ Billion | -2.54 | 2.33 | -20.38 | 9.26 | -2.16 |
| EBITDA $ Billion | 4.17 | 8.40 | -13.20 | 18.21 | 6.29 |
| EPS diluted in $/share | -0.76 | 0.70 | -6.27 | 2.83 | -0.69 |
| Cash from operating activities in $ Billion | 5.98 | 6.12 | 8.21 | 10.86 | 8.29 |
| Capital Expenditure Quarterly in $ Billion |
2.67 |
2.77 |
2.60 |
2.67 |
3.11 |
| Free Cash Flow in $ Billion | 3.31 | 3.34 | 5.61 | 8.20 | 5.18 |
| Total cash (+other investments) $ Billion | 30.89 | 26.22 | 34.51 | 33.24 | 29.60 |
| Gross Debt in $ Billion (not including lease) | 63.21 | 61.18 | 60.61 | 52.87 | 46.56 |
| Dividend per share in $ | 0.3276 | 0.3276 | 0.3276 | 0.36036 | 0.36036 |
| Shares outstanding (diluted) in Billion | 3.358 | 3.327 | 3.252 | 3.270 | 3.148 |
| Oil Production detail and Renewable | 3Q21 | 4Q21 | 1Q22 | 2Q22 | 3Q22 |
| Oil Equivalent Production in K Boep/d | 2,202 | 2,332 | 2,252 | 2,198 | 2,298 |
| Production Rosneft in K Boep/d | 1,120 | 1,126 | 750 | 0 | 0 |
| Global liquid price ($/Boe) | 47.57 | 56.46 | 64.70 | 73.24 | 73.76 |
| Global Natural gas price ($/M BTU) | 5.35 | 7.41 | 8.24 | 8.31 | 10.31 |
| Total Developed renewables to FID and Renewables pipeline in net GW | – | 27.5 | 29.5 | 30.1 | 26.9 |
Sources: Company release
* The total equivalent Production represents the gas production operations for 981K Boep/d and oil production operations for 1,317K Boep/d in 3Q22.
Analysis: Revenues, Earnings Details, Free Cash Flow, And Upstream Production
1 – Quarterly total revenues and other investments were $57.81 billion in 3Q22
Note: The four quarters of 2020 have been restated by the company, which is confusing historically.
BP Quarterly Revenues history (Fun Trading)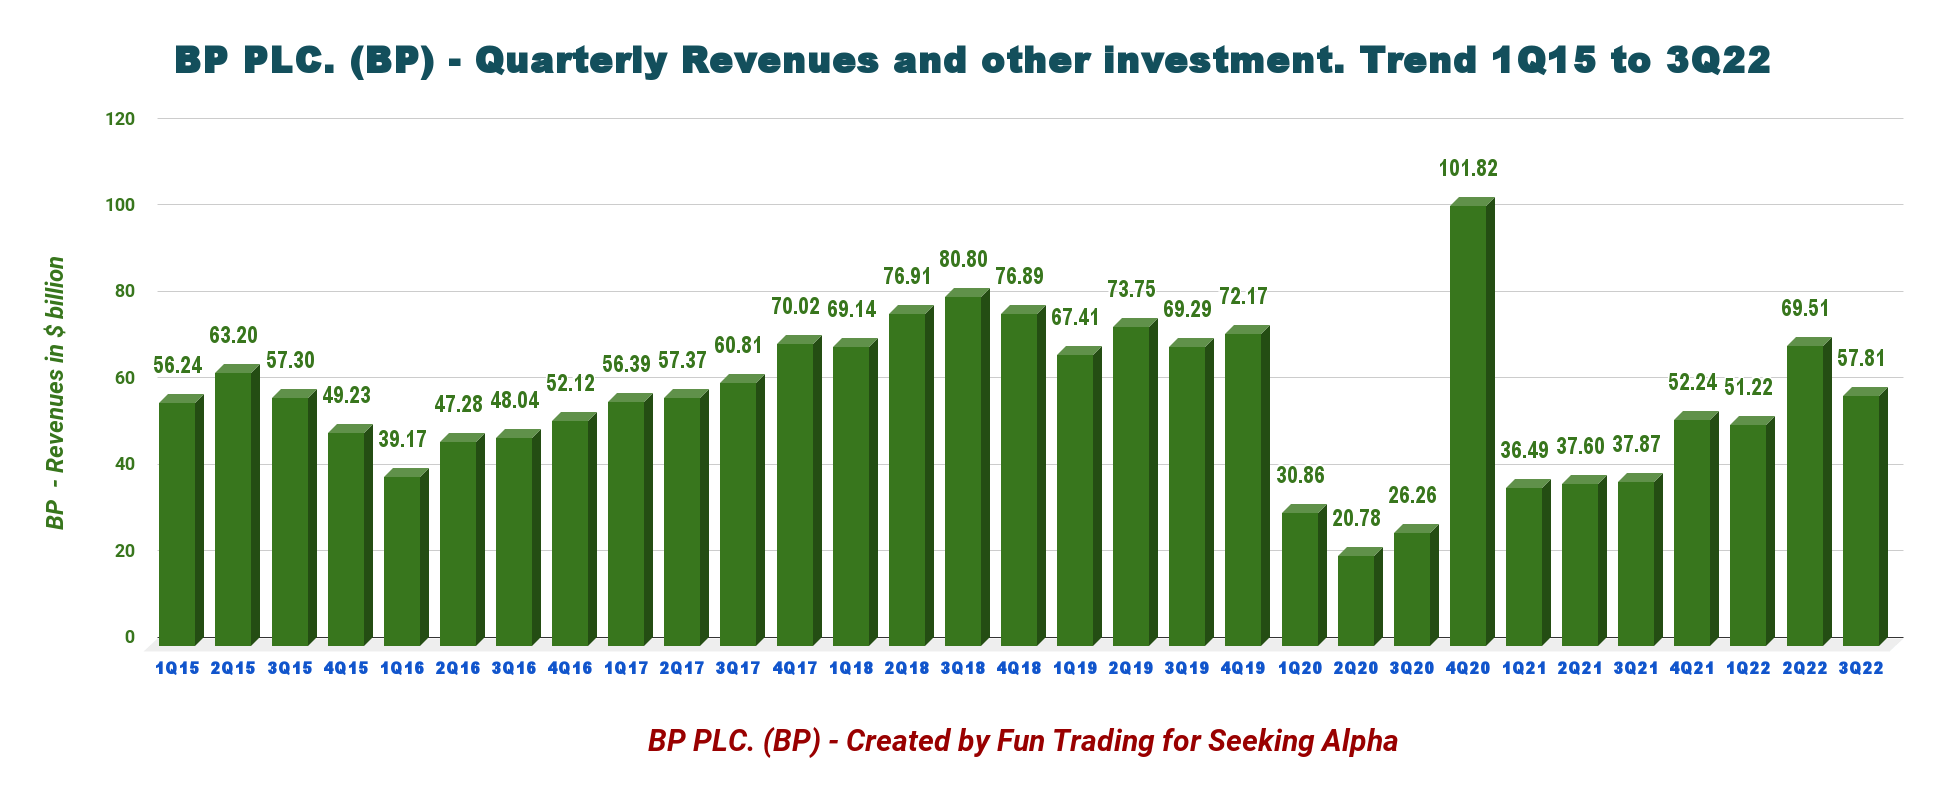
BP had total revenues of $57.81 billion for the quarter (oil revenues are $55.01 billion). CapEx in the third quarter of 2022 was $3.11 billion, compared with $2.67 billion in the third quarter of 2021.
Compared to the second quarter, the results were impacted by weaker refining margins, an average oil trading result, and lower liquids realizations, partly offset by an exceptional gas marketing and trading result and higher gas realizations.
The income attributable to BP’s shareholders in the third quarter was a loss of $2.163 billion compared to a loss of $2.544 billion last year.
Operating cash flow in the quarter of $8.288 billion compared to $5.976 billion in 3Q21.
Total divestment and other proceeds for the second quarter were $0.6 billion, compared with $0.3 billion for the same period in 2021.
At the end of the third quarter, net debt was $22.0 billion, compared with $22.8 billion at the end of the second quarter of 2022 and $32.0 billion at the end of the third quarter of 2021. Excellent progress in this segment.
2 – Free Cash Flow (not including divestitures)
BP Quarterly Free cash flow history (Fun Trading)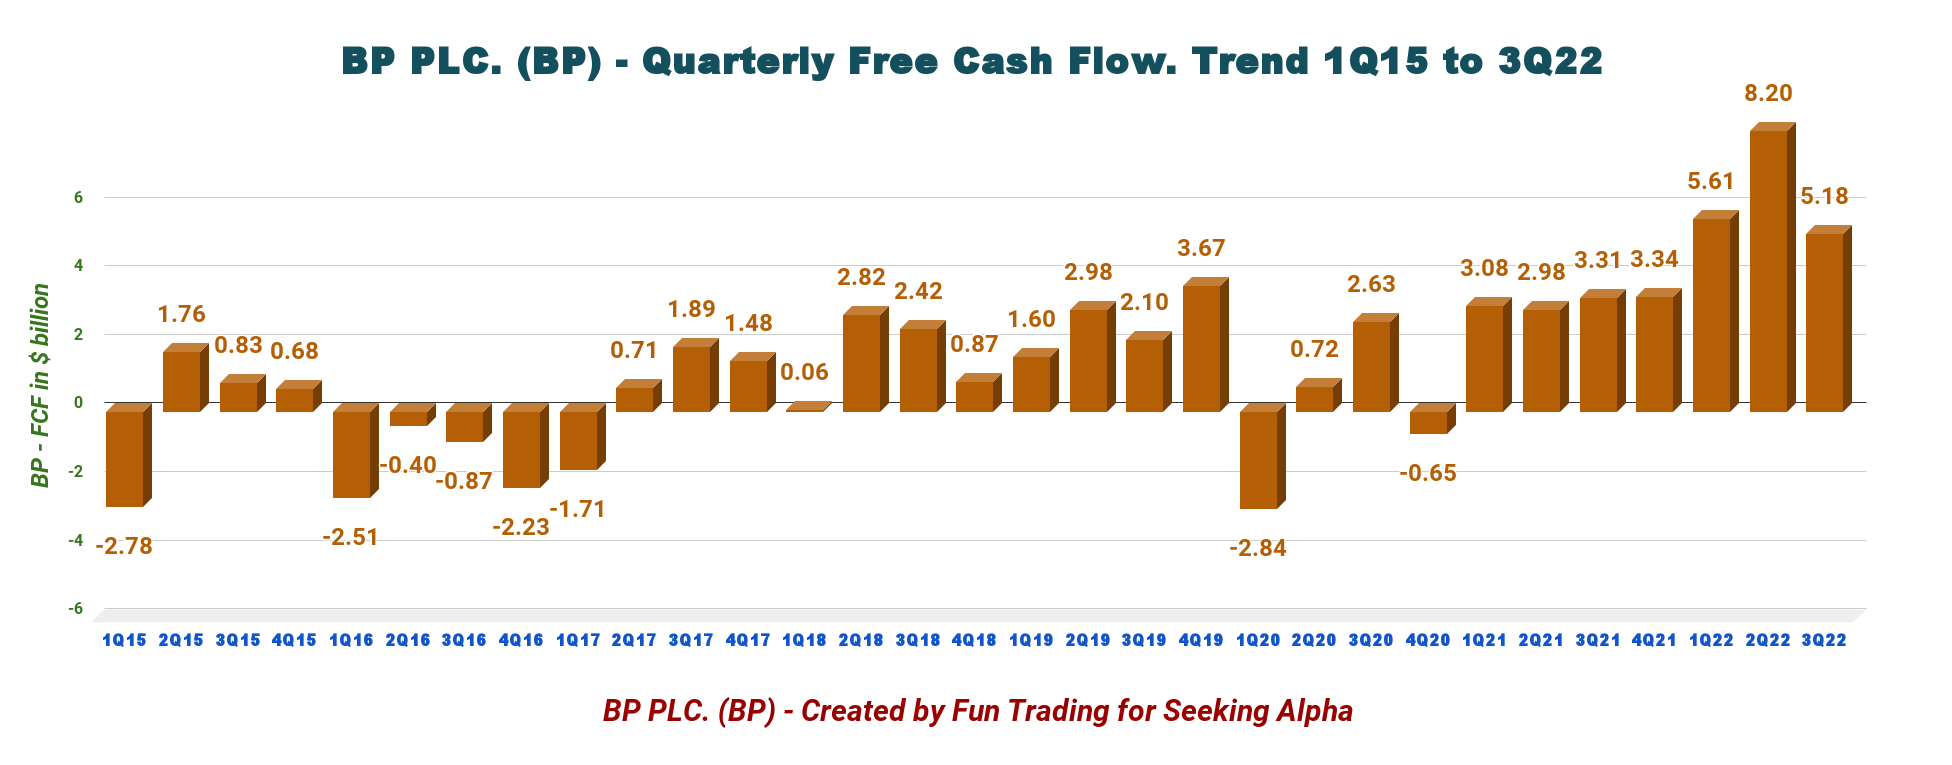
Trailing 12-month free cash flow (“ttm”) was $22.332 billion, with a third-quarter of 2022 of $5.183 billion.
Cash flow from operations increased sequentially to a record of $8.288 billion.
BP Quarterly Cash flow from operations history (Fun Trading)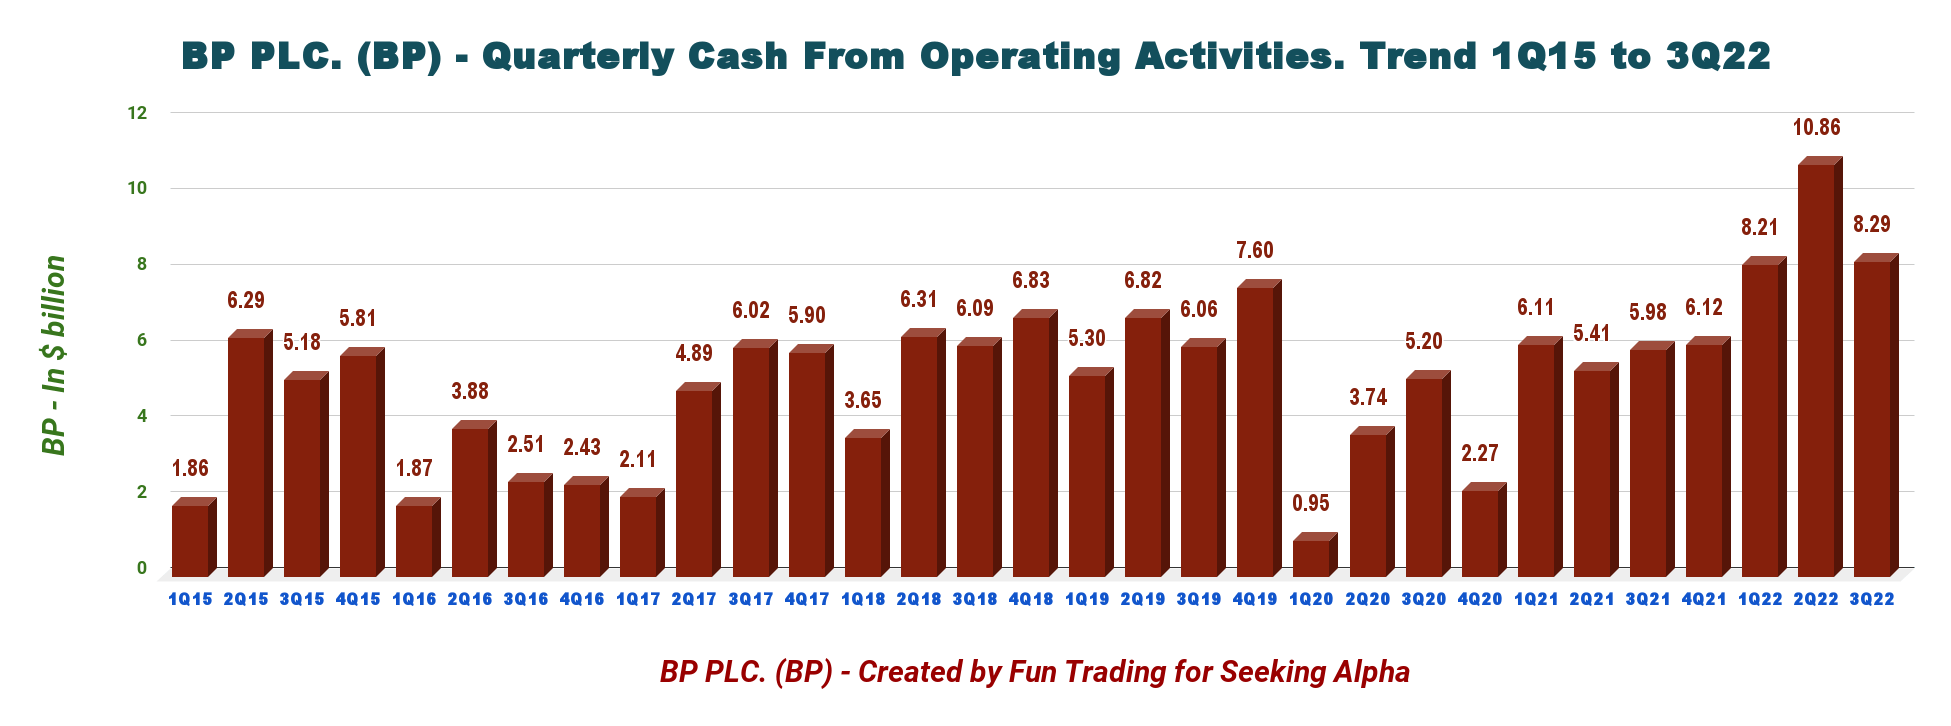
For 2022 and subject to maintaining a strong investment grade credit rating, bp remains committed to using 60% of surplus cash flow for share buybacks and intends to allocate the remaining 40% to further strengthen the balance sheet. (press release)
3 – Oil production (Upstream and Rosneft out)
BP Quarterly Oil equivalent Production history (Fun Trading)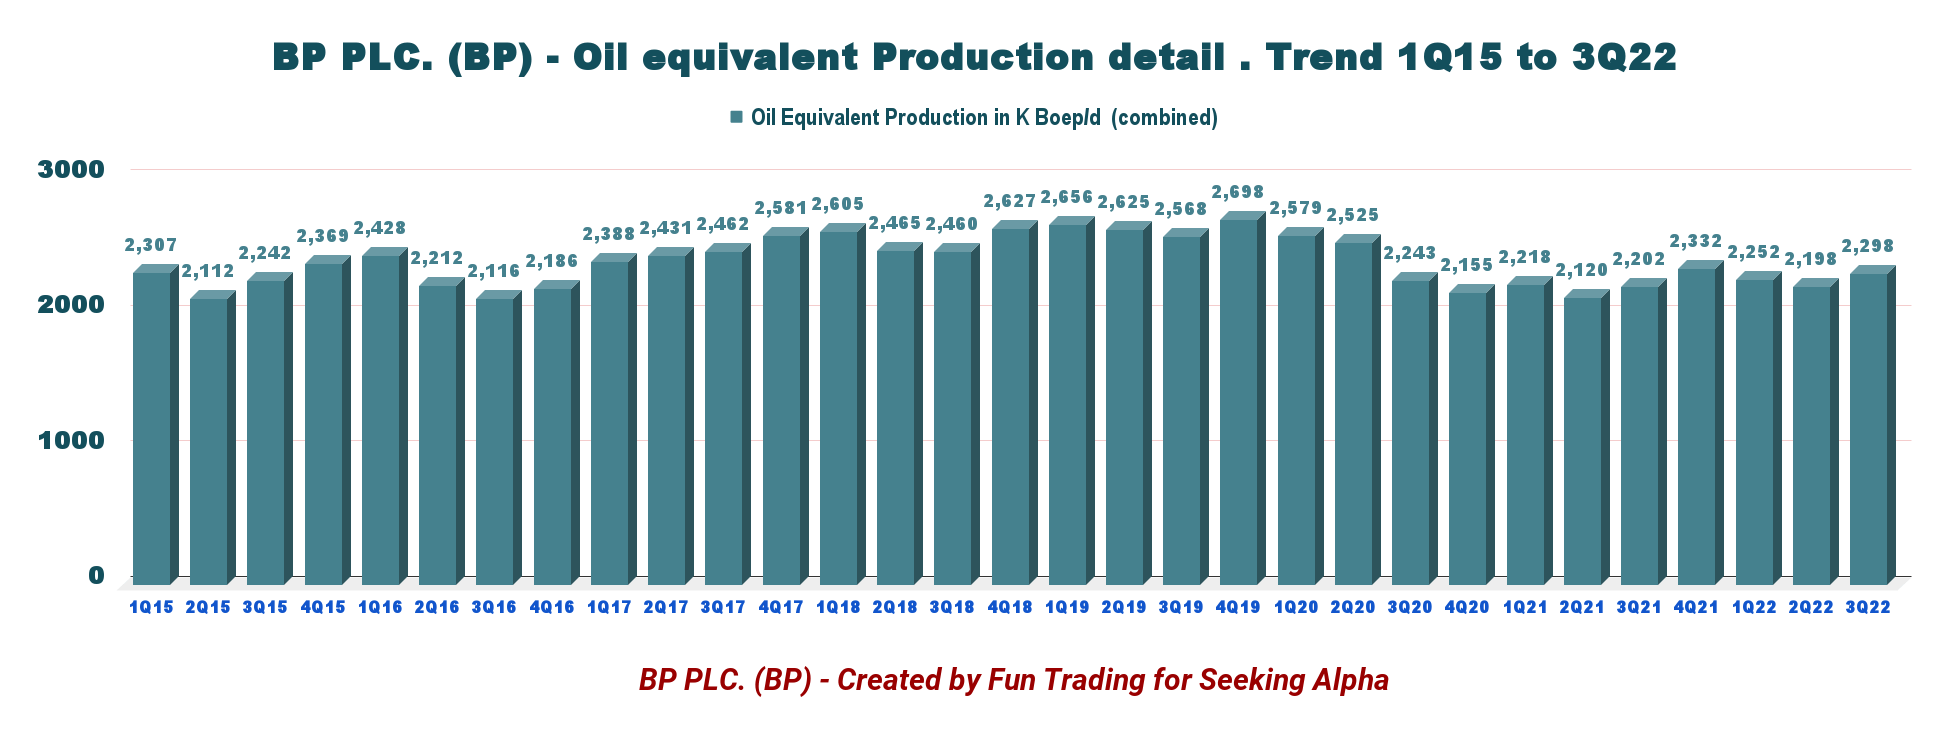
- Upstream: The quarter’s production was 2,298K Boep/d, up 4.4% compared to last year and down 4.5% sequentially. Oil production and operations represent 1,317K Boep/d, and gas and low carbon energy represent 981K Boep/d.
Prices for oil and natural gas are now at a multi-year high. The company sold its total hydrocarbon per Boe at $73.76 during the third quarter compared with $47.57 in the same period last year. The natural gas price was $10.31 per thousand cubic feet compared with $5.35 in the year-ago quarter.
BP Quarterly oil and NG prices history (Fun Trading)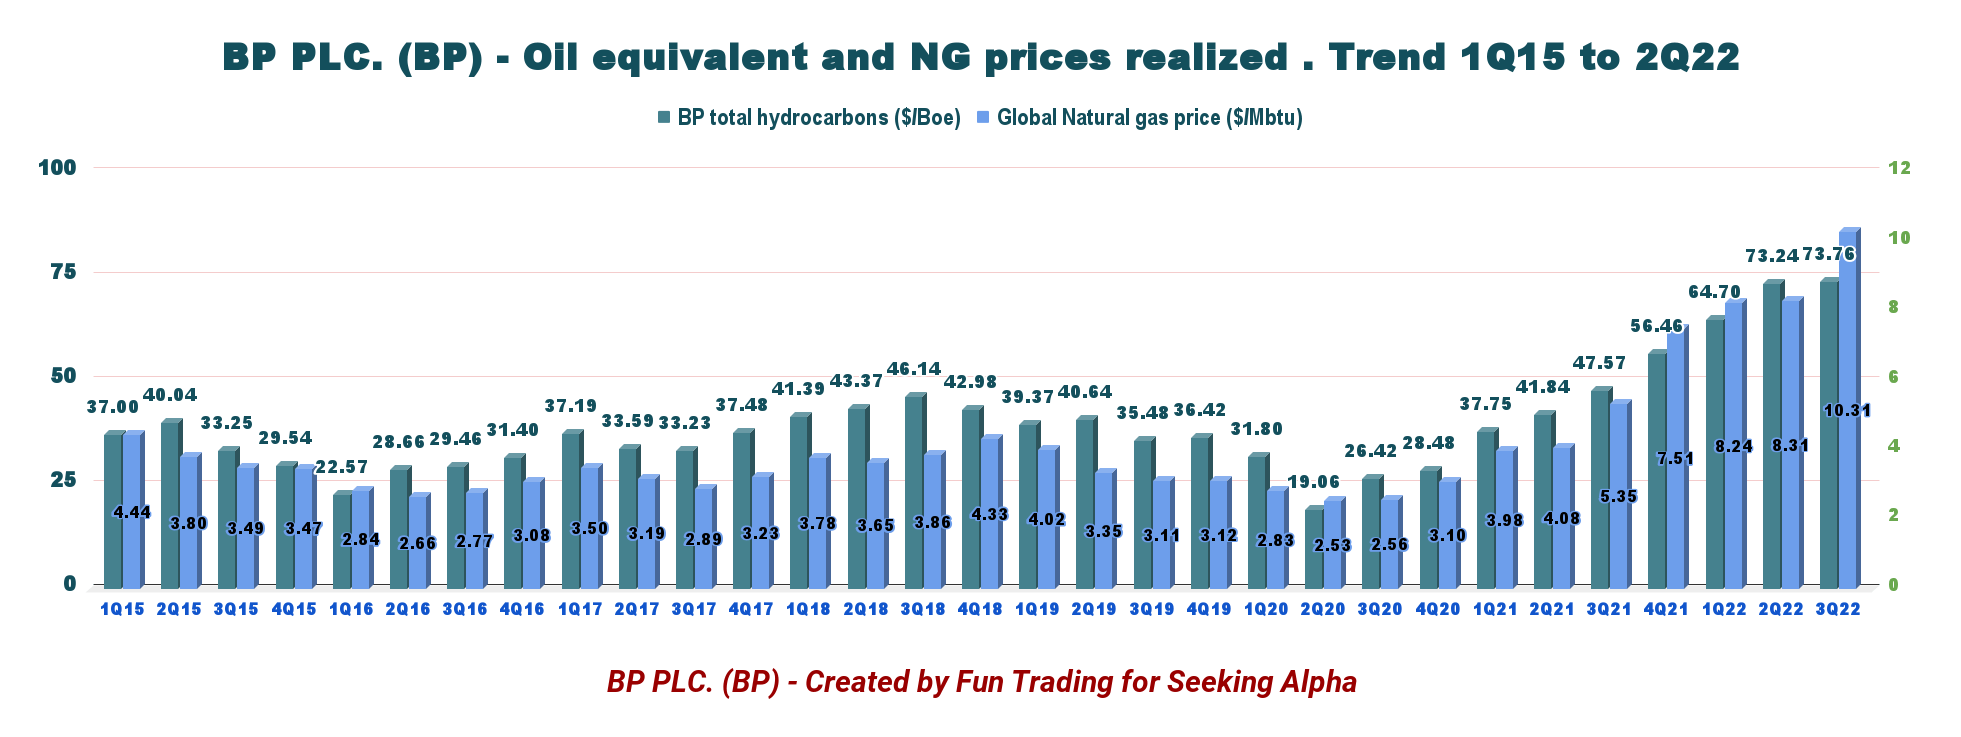
- Gas and low-carbon energy
Profits increased to $6,240 million in 3Q22 from a profit of $1,807 million last year, mainly due to increased oil equivalent production and price.
In the third quarter, total production was 981K Boep/d, up from 889K Boep/d last year. Key project ramp-ups helped again this quarter.
Also, in this category, the company indicates the total developed renewables to FID and renewables pipeline at 31.5 GW, up from 26.9 GW last year.
- Oil production and operations
For the third quarter, the total production of 1,317K Boep/d was slightly up from 1,313K Boep/d in the year-ago quarter due to reduced weather impacts in the US Gulf of Mexico and bpx energy performance partly offset by seasonal maintenance.
After adjusting for non-operating items, underlying replacement cost earnings before interest and tax for the segment were $2,586 million. It compares to $1,060 million in the year-ago quarter. The third quarter included an adverse impact of net adjusting items of $139 million.
- Customer & products
Underlying RC earnings before interest and tax were $2,725 million in 3Q22, up from $1,158 million last year.
BP-operated refining availability at the September-end quarter was 94.3%, decreasing from 95.6% in the year-ago quarter.
Total refinery throughputs from the second quarter were reported at 1,512 thousand barrels per day (MBbl/D), declining from 1,622 MBbl/D in the prior-year quarter.
4 – Net debt is $22 billion in 3Q22 (or $29.92 billion, including lease liabilities).
“Under IFRS 16, we now recognize leases on the balance sheet as right of use assets. This results in a corresponding lease liability on the balance sheet, which we have disclosed separately to finance debt.”
BP Quarterly Cash versus Debt history (Fun Trading)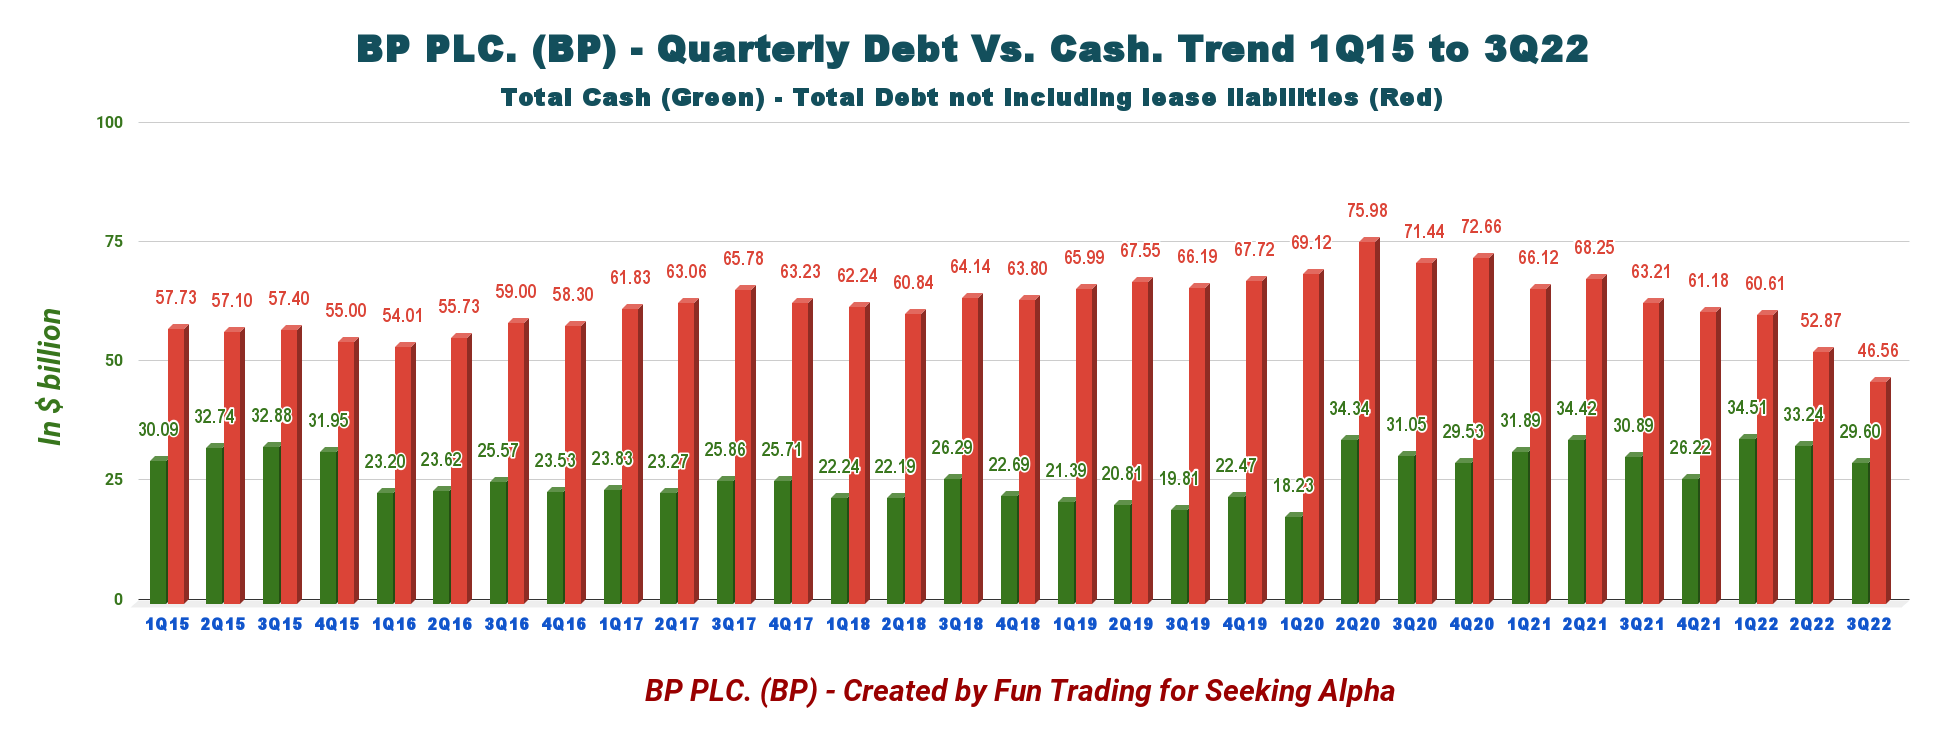
BP’s net debt is now $22.0 billion or $29.92 billion, including lease liabilities. Gearing is 23.1% (29.0%, including leases).
However, the net debt indicated by BP is slightly different than a simple Finance Debt, including current minus total cash ($16.96 billion).
The debt-to-equity ratio has dropped to 0.80, which is still high, but this segment has improved significantly even if net debt increased from 2Q22.
5 – Outlook for 4Q22 and 2022
For 2022, BP expects a CapEx of $15.5 billion in 2022 if the acquisition of Archaea Energy completes before year-end. Also, a CapEx of $14-16 billion per annum through 2025.
BP expects Gulf of Mexico oil spill payments for the year to be around $1.4 billion pre-tax, including the $1.2 billion pre-tax paid during the second quarter.
[B]ased on bp’s current forecasts, at around $60 per barrel Brent and subject to the board’s discretion each quarter, bp continues to expect to be able to deliver share buybacks of around $4.0 billion per annum and have capacity for an annual increase in the dividend per ordinary share of around 4% through 2025.
The company anticipates upstream production to be slightly lower than 3Q22, especially in the gas region.
For the customers and products business, BP expects lower marketing margins and seasonally lower volumes and, in Castrol, base oil prices to remain elevated.
For the refining segment, BP expects margins to remain high, the benefits of which will be partially offset by elevated energy prices, a higher level of turnaround activity, and operational impacts following the shutdown of the bp-Husky Toledo refinery in Ohio, U.S.
Technical Analysis and commentary
BP TA Chart short-term (Fun Trading StockCharts)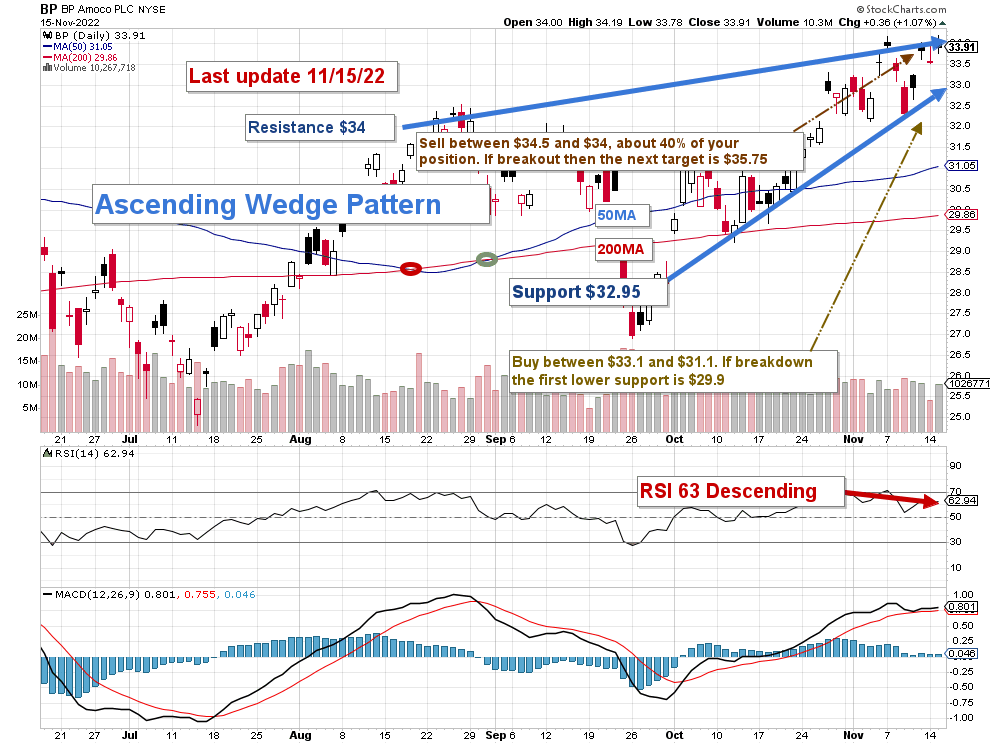
Note: The chart has been adjusted for the dividend.
BP forms a descending channel pattern with resistance at $32.5 and support at $30.
The trading strategy is to sell about 30-40% of your long position, partially between $32.3 and $33.8. If BP crosses the resistance (breakout) due to bullish oil prices, the following resistance range is between $35 and $35.50. However, I do not consider this event very likely, with oil prices weakening below $90 per barrel and a possible recession materializing by the end of 2022.
On the other hand, if oil prices continue to weaken, I recommend buying BP between $30.15 and $29.25, with possible lower support at $27.75.
Note: The LIFO method is prohibited under International Financial Reporting Standards (IFRS), though it is permitted in the United States by Generally Accepted Accounting Principles (GAAP). Therefore, only US traders can apply this method. Those who cannot trade LIFO can use an alternative by setting two different accounts for the same stock, one for the long term and one for short-term trading.
Warning: The TA chart must be updated frequently to be relevant. It is what I am doing in my stock tracker. The chart above has a possible validity of about a week. Remember, the TA chart is a tool only to help you adopt the right strategy. It is not a way to foresee the future. No one and nothing can.
Author’s note: If you find value in this article and would like to encourage such continued efforts, please click the “Like” button below to vote of support. Thanks.
Be the first to comment