

Sean Pavone
It’s not every day that you find a company that generates attractive cash flows that continues to grow year over year, and yet that still is down precipitously compared to the broader market over the past year. But these cases do develop from time to time, especially when the market is going through periods of volatility itself. One great example of this can be seen by looking at Boston Properties (NYSE:BXP), a REIT that owns and leases out properties, largely office spaces, to various clients ranging from those in financial services, to those in life sciences, to those in manufacturing, and more. After the market closed on October 25th, management announced financial results covering the third quarter of the company’s 2022 fiscal year. They also provided guidance not only for the current fiscal year but also for 2023 as well. Although the data moving forward might be somewhat mixed, the firm does still seem to be trading at fundamentally attractive levels and the health of the enterprise appears solid. Due to these factors, I cannot help but to rate it a ‘buy’ at this time.
Solid Q3 results from Boston Properties and a fine valuation
The last time I wrote an article about Boston Properties was a little over a year ago in early October of 2021. In that article, I talked about how high-quality the company had demonstrated itself to be, particularly during a time of transition for the firm. I was particularly impressed by its shifting focus on life sciences as a long-term play. At the end of the day, I did state that shares were pricey compared to similar firms. But I also concluded that on an absolute basis, they seemed to offer upside potential. This led me to rate the business a ‘buy’, indicating my belief that it would likely outperform the broader market moving forward. But since then, things have not gone exactly as planned. While the S&P 500 is down by 12%, shares of Boston Properties have resulted in a loss of 32.1%.
Author – SEC EDGAR Data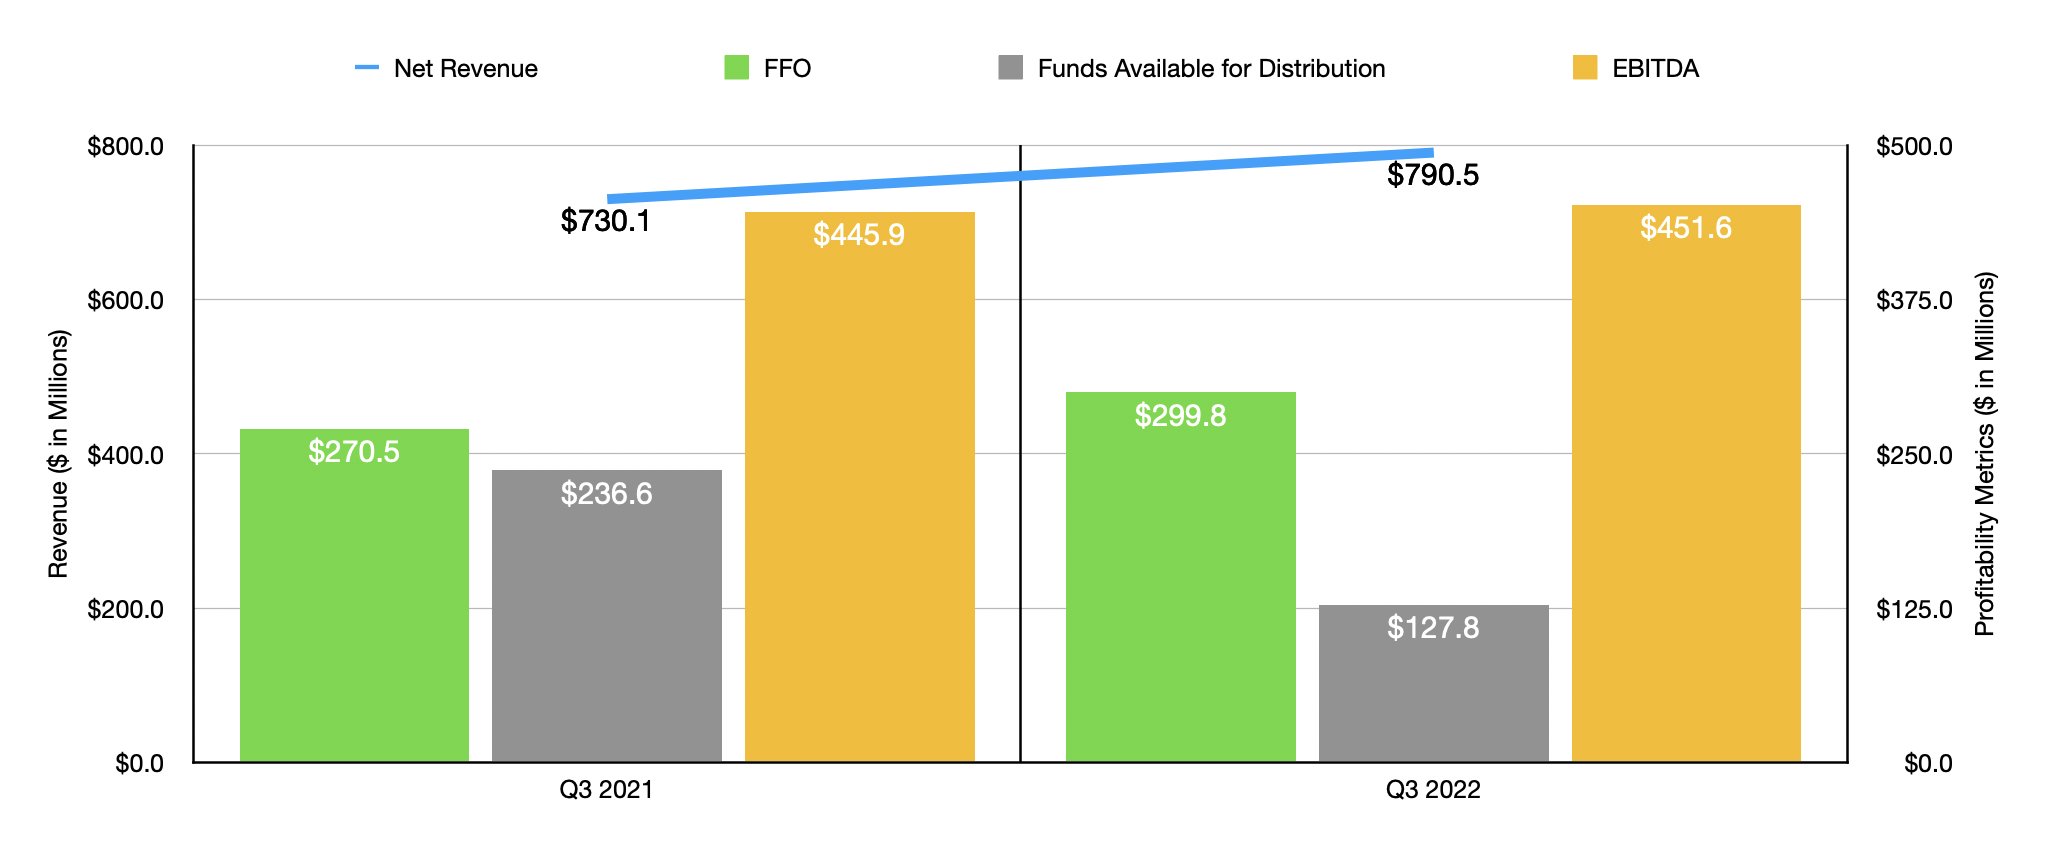
What’s really interesting about this performance from a share price perspective is that it comes even at a time when the underlying fundamentals of the company remain robust. To see what I mean, I would like to point to results covering the third quarter of the company’s 2022 fiscal year. This is the quarter for which management announced financial results after the market closed on October 25th of this year. Revenue for the quarter came in strong at $790.52 million. That beat analysts’ expectations to the tune of $27.84 million. In addition to that, it also translated to a year-over-year increase of 8.3% compared to the $730.06 million generated in the third quarter of 2021.
This increase for the company came because of strength across all of its operations. In absolute dollar terms, the largest contributor involved the leasing activities of the company. Revenue here increased by 6.8% year over year, driven by a variety of factors. For instance, the company did succeed in executing 1.4 million square feet of leases, marking the strongest third quarter by leasing volume that the company has had since 2019. The company also expanded its life sciences portfolio in Massachusetts by completing an acquisition valued at $592.4 million. Parking and other revenue for the company grew by 19.8%, while hotel revenue shot up by 126.4%.
On the bottom line, management also reported strong results. FFO, or funds from operations, per share came in at $1.91. That’s $0.04 per share higher than what analysts were expecting. In absolute dollar terms, FFO came in at $299.75 million. That’s up nicely from the $270.48 million the company reported the same time last year. FAD, or funds available for distribution, managed to drop year over year from $236.61 million down to $127.77 million. But EBITDA inched up nicely from $445.93 million to $451.59 million. I would like to look at operating cash flow and an adjusted figure for this that excludes changes in working capital, but management has not revealed this data yet and they have not released their official quarterly report with those numbers included.
Author – SEC EDGAR Data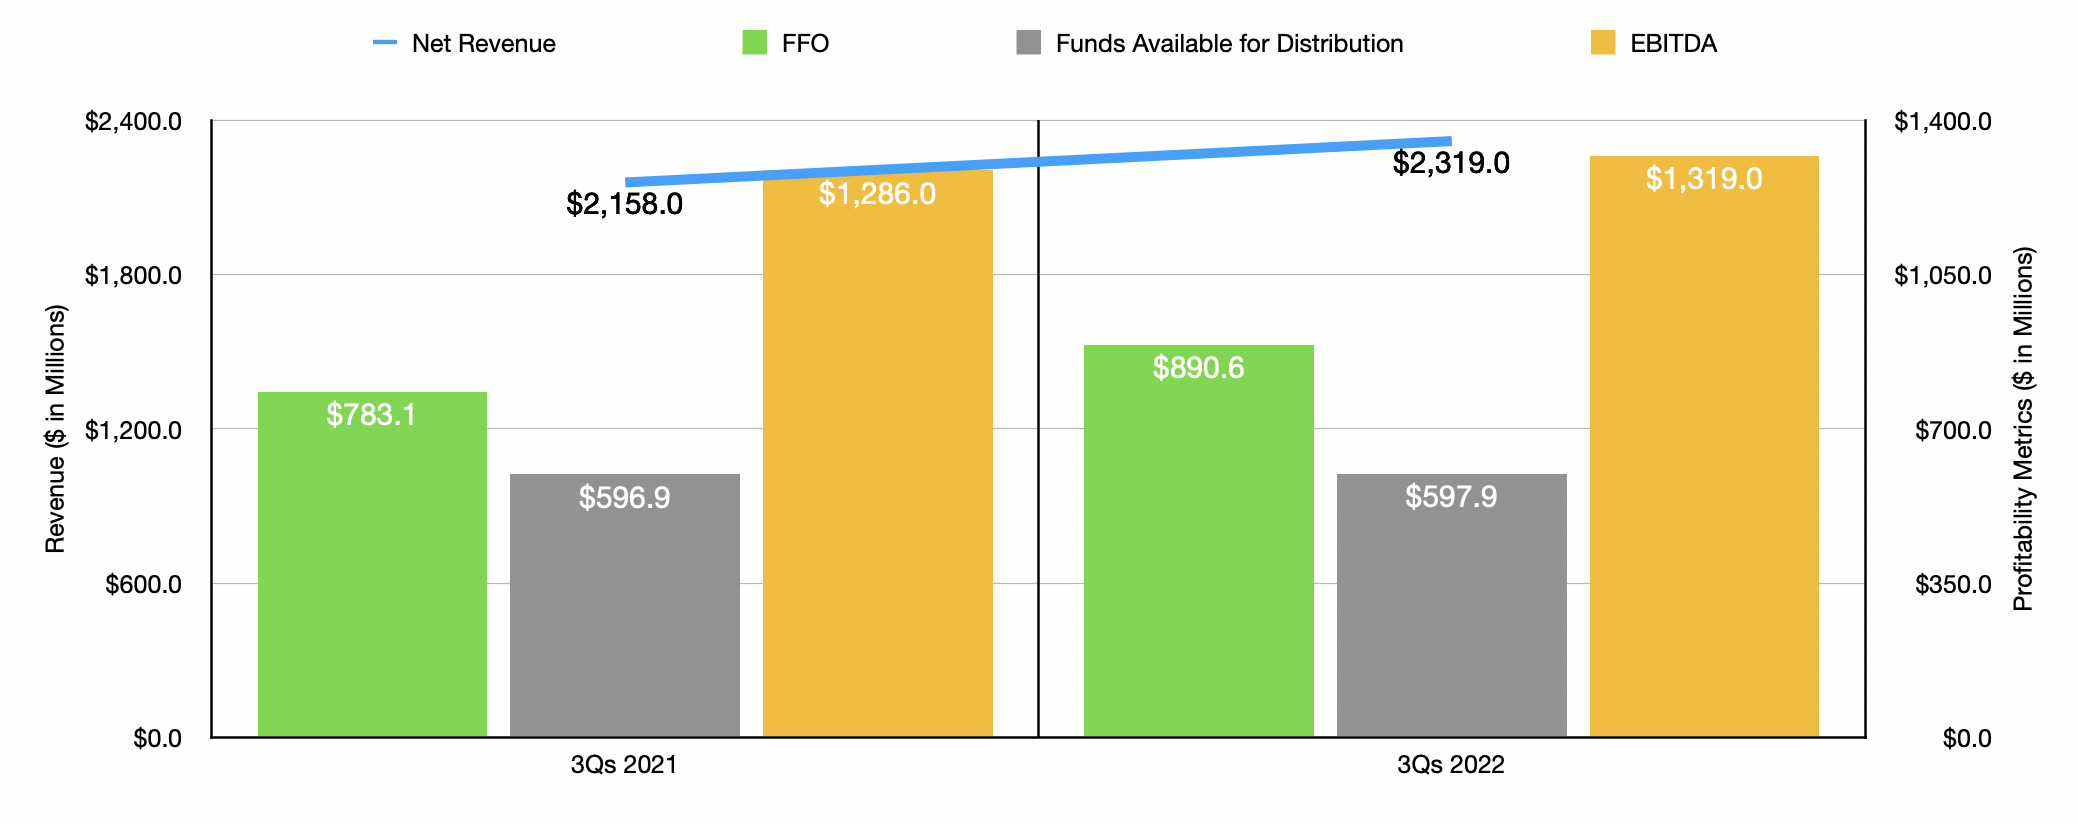
This impressive year-over-year performance was not a one-time thing. All year has been positive for the enterprise. Revenue of $2.32 billion generated in the first nine months of the 2022 fiscal year beat out the $2.16 billion reported the same time last year. FFO has risen from $783.06 million to $890.58 million. And EBITDA for the company increased from $1.29 billion to $1.32 billion. Even though FAD was substantially lower year over year in the third quarter, results for the first nine months of the fiscal year combined were also slightly positive. During this time, they came in at $597.91 million. That’s marginally higher than the $596.87 million generated the same time one year ago.
For the most part, I consider the results reported by management to be a net positive. Having said that, their outlook for the 2023 fiscal year is not all that impressive. You see, for 2022 as a whole, management is forecasting FFO per share of between $7.51 and $7.53. But for 2023, the expectation has been set lower at between $7.15 and $7.30. Given the company’s current share count, this would lead to FFO of $1.18 billion this year and $1.14 billion next year. Unfortunately, we don’t know what to expect when it comes to other financial results for either year. But if we assume that they will change at the same rate that FFO should, then we should anticipate adjusted operating cash flow this year of $1.56 billion and EBITDA of $1.86 billion. For 2023, this approach would yield readings of $1.50 billion and $1.56 billion, respectively.
Author – SEC EDGAR Data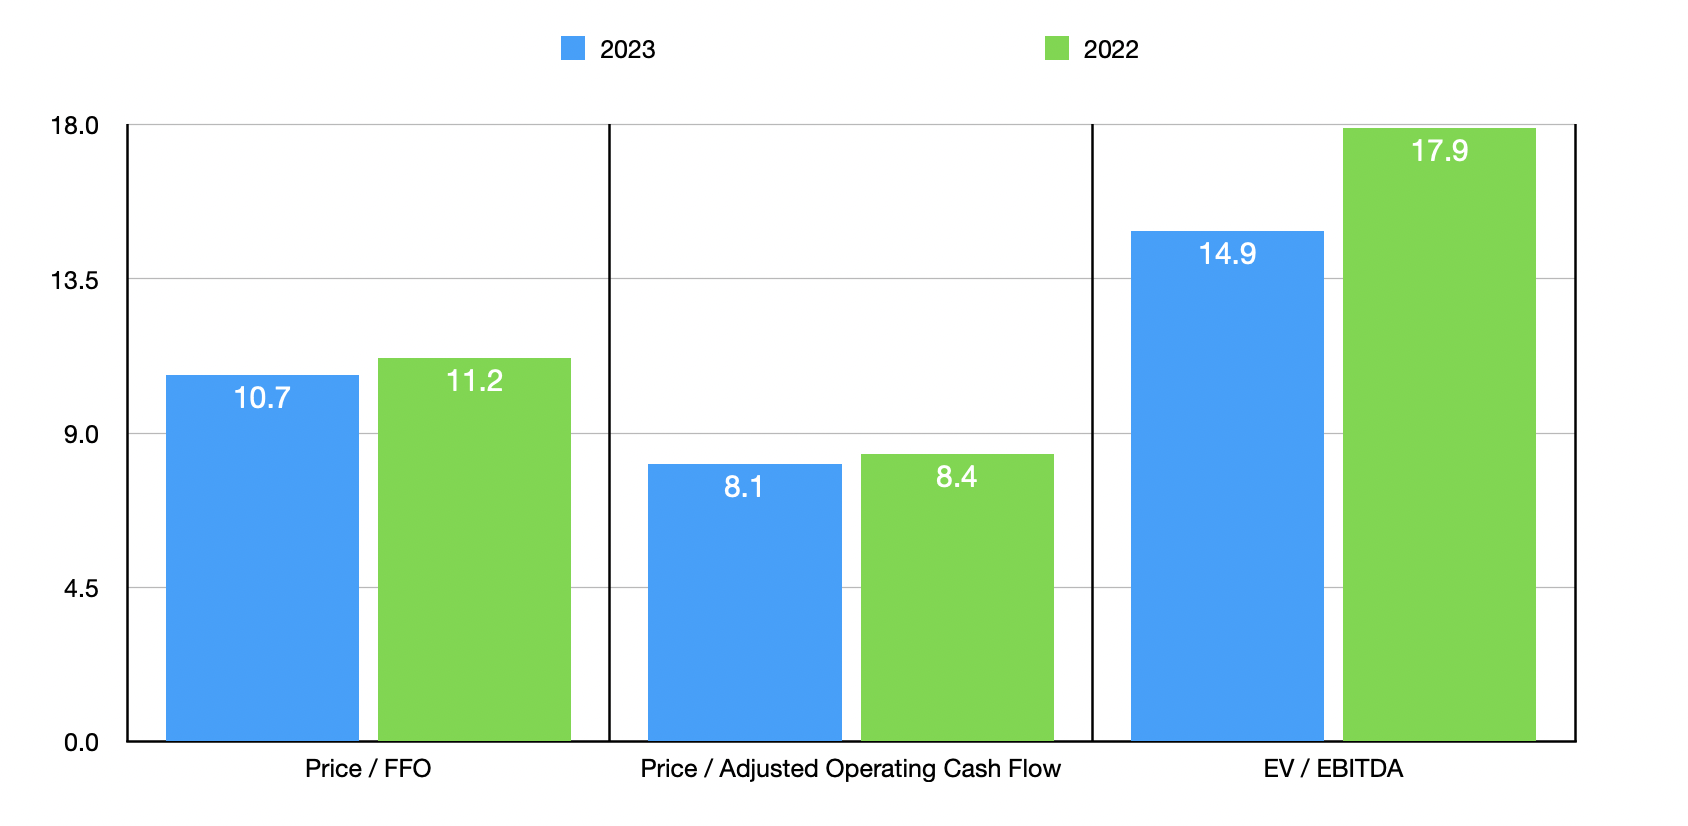
Taking these numbers, I calculated that the company is trading at a price to FFO multiple of 11.2, a price to adjusted operating cash flow of 8.4, and an EV to EBITDA multiple of 17.9. If, instead, we were to use the estimates for 2023, these multiples would be 10.7, 8.1, and 14.9, respectively. As part of my analysis, I also compared the price to operating cash flow multiple and the EV to EBITDA multiple of the company to the results of five similar firms. On a price to operating cash flow basis, the range for these companies was between 6.3 and 20.2. In this case, two of the five companies were cheaper than our prospect. Meanwhile, using the EV to EBITDA approach, the range was between 9.1 and 23.7, with four of the five being cheaper than our target.
| Company | Price / Operating Cash Flow | EV / EBITDA |
| Boston Properties | 8.4 | 17.9 |
| Kilroy Realty Corp. (KRC) | 8.7 | 13.7 |
| Vornado Realty Trust (VNO) | 6.3 | 14.7 |
| Alexandria Real Estate Equities (ARE) | 20.2 | 23.7 |
| Cousins Properties (CUZ) | 9.5 | 9.1 |
| Douglas Emmett (DEI) | 6.4 | 15.9 |
Takeaway
Based on the data provided, Boston Properties seems to be doing quite well. Though, it’s likely that next year will be slightly less appealing for the firm. Even with that being the case though, the health of the company is undeniable and shares are priced at a low enough level that, while more or less fairly valued compared to similar firms, do look affordable on an absolute basis. I would definitely not call Boston Properties the greatest prospect out there. But for those who want this kind of REIT, it’s certainly not a bad prospect to consider.
Be the first to comment