

lenscap67
Nokia (NYSE:NOK)(OTCPK:NOKBF) is a cellular network infrastructure provider focusing on next-generation communication. It also has a consumer division of other commodity-based electronics. After surviving its Microsoft takeover, it emerged as a potential industry leader. However, this company has some drawbacks, including the need for more exciting messaging for leading industry-competitive products.
Recent Fundamental Strength with Unclear Direction
Ratios
Nokia has grown very little over the last five years but has strengthened significantly since 2019. As a result, current and quick ratios have risen slightly in the previous three years.
|
Metric |
2017 |
2018 |
2019 |
2020 |
2021 |
|
Period |
FY |
FY |
FY |
FY |
FY |
|
Current ratio |
1.559 |
1.295 |
1.394 |
1.549 |
1.619 |
|
Quick ratio |
1.275 |
1.003 |
1.078 |
1.288 |
1.353 |
|
Cash ratio |
0.578 |
0.444 |
0.490 |
0.590 |
0.553 |
Source: Financial Modelling Prep
Growth
It seems 2020 was not kind to Nokia as significant losses were taken for net income growth and revenue growth. One concern is how long it will take Nokia to recover from this underperforming year.
|
Metric |
2017 |
2018 |
2019 |
2020 |
2021 |
|
Period |
FY |
FY |
FY |
FY |
FY |
|
Revenue growth |
-0.020 |
-0.025 |
0.033 |
-0.063 |
0.016 |
|
Gross profit growth |
0.081 |
-0.076 |
-0.014 |
-0.016 |
0.078 |
|
Ebit growth |
1.015 |
-4.688 |
9.220 |
0.825 |
1.438 |
|
Operating income growth |
1.015 |
-4.688 |
9.220 |
0.825 |
1.438 |
|
Net income growth |
-0.950 |
0.772 |
1.021 |
-360.429 |
1.645 |
Source: Financial Modelling Prep
Data
As one can compare Nokia against other companies, it has performed relatively well with minimal losses over the last 200 working days according to its simple moving average. One encouraging sign is how it has strengthened over the previous 20 days as the stock market seems to recover.
|
Metric |
Values |
|
SMA20 |
5.66% |
|
SMA50 |
7.41% |
|
SMA200 |
-1.90% |
Source: FinViz
Enterprise
Nokia’s stock price seems to have declined and then recovered since the low point of 2019. At the same time, market capitalization has grown over 20 plus percent in approximately year over a year.
|
Metric |
2017 |
2018 |
2019 |
2020 |
2021 |
|
Symbol |
NOK |
NOK |
NOK |
NOK |
NOK |
|
Stock price |
4.960 |
6.570 |
3.960 |
4.560 |
5.720 |
|
Number of shares |
5.652 B |
5.588 B |
5.600 B |
5.612 B |
5.630 B |
|
Market capitalization |
28.033 B |
36.713 B |
22.176 B |
25.593 B |
32.204 B |
|
Enterprise value |
20.225 B |
28.767 B |
18.246 B |
21.300 B |
26.344 B |
Source: Financial Modelling Prep
Estimate
Nokia’s revenue between 2022 and 2025 appears to grow by 35% approximately. Earnings price per share may double over the same time. These are encouraging signs based on the network infrastructure product Nokia offers. They offer some competitive advantage by focusing on 5G advanced and 6G network products.
|
YEARLY ESTIMATES |
2022 |
2023 |
2024 |
2025 |
|
Revenue |
23,588 |
25,036 |
28,826 |
35,297 |
|
– |
– |
0.00 |
– |
|
|
Dividend Yield (in %) |
– |
– |
– |
– |
|
EPS |
3.51 |
3.64 |
4.72 |
5.97 |
|
P/E Ratio |
21.87 |
21.10 |
16.28 |
12.87 |
|
EBIT |
6,297 |
6,748 |
8,396 |
11,175 |
|
EBITDA |
7,781 |
7,483 |
8,844 |
11,253 |
|
Net Profit |
– |
– |
7,311 |
– |
|
Net Profit Adjusted |
– |
– |
7,573 |
– |
Source: BusinessInsider
Technical Analysis Indicates Short Lived Upswing
Fibonacci
In terms of initiating market orders for Nokia, it appears they are very close if one wants to take advantage of any upcoming momentum in this stock price. Nokia, over last year, has had a quick, short-lived spike but dropped back in February.
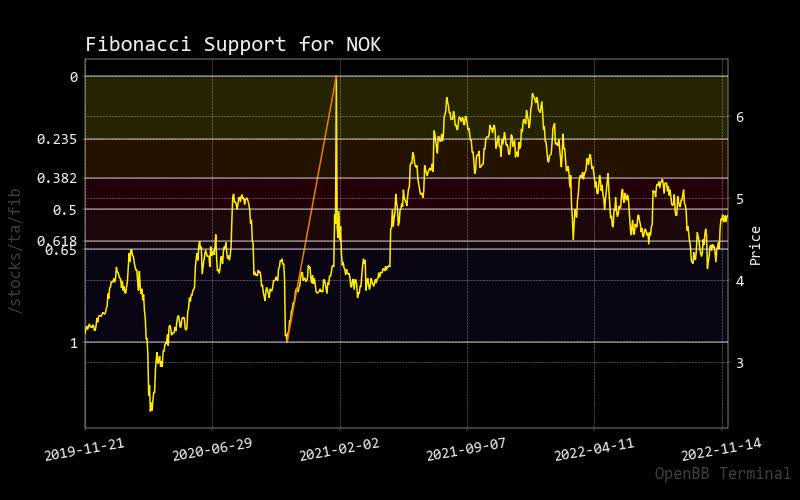
fibonacci nokia (custom platform)
Bollinger Bonds
As for the current stock price of Nokia, the upper band of the Bollinger was able to stay ahead of the price action. This may indicate that momentum is very short-lived.
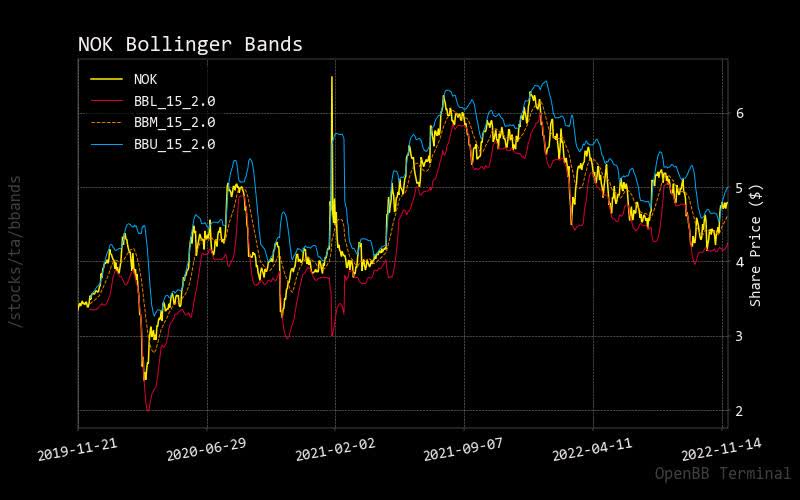
bollinger nok (custom platform)
MACD
When any investor views the compressed price line of MACD, it is pretty rangebound but minimizes any collapse in the stock price this year. However, many companies did suffer from this, which shows the tight management control Nokia appears to have. On the upside, Nokia is not precisely participating in sexy product lines like it once did when making cellular phone handsets.
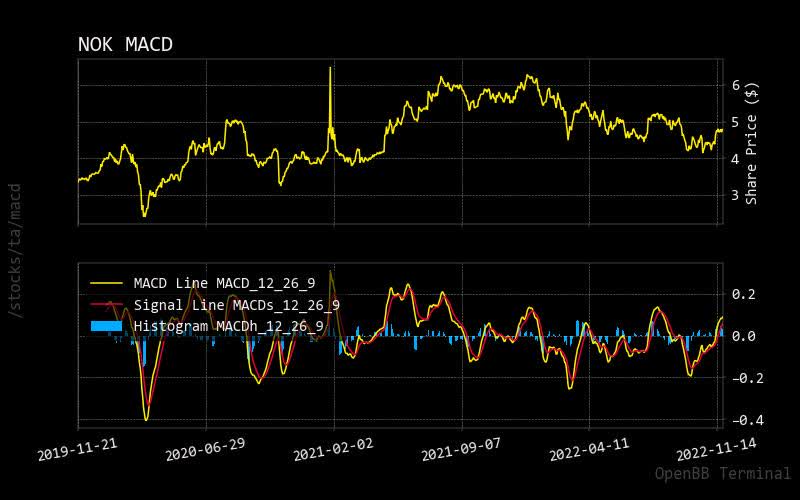
MACD Nokia (custom platform)
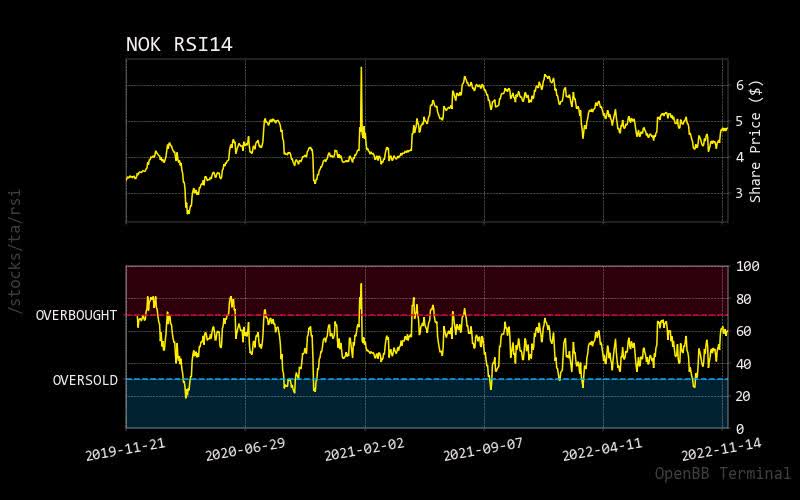
RSI
As with the current relative strength indicator, Nokia’s latest price action might not have room to increase the stock price; however, as said earlier, it appears there’s not enough momentum for this to be achieved, so it will continue to be rangebound as it has been since early last year.
rsi Nokia (custom platform)
Prediction via AI
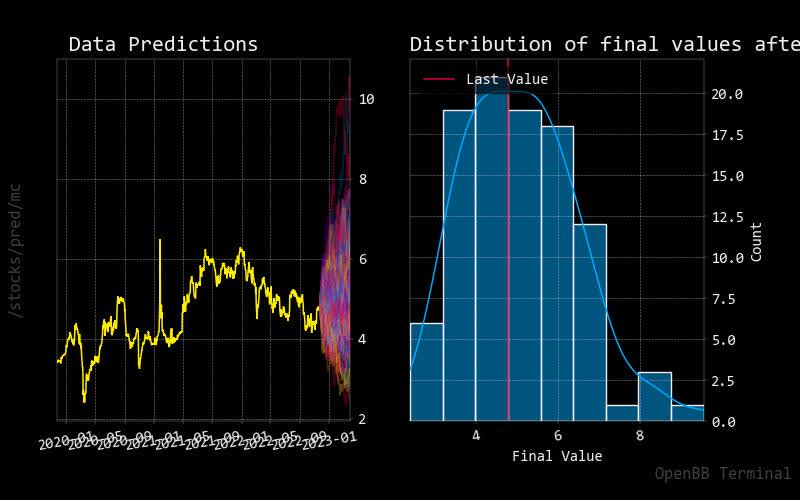
Monte Carlo
One encouraging sign for Nokia is that predictive paths generated from this Monte Carlos simulation show higher potential for stock price upswings. Even better, the normalized distribution overwhelmingly shows higher stock price potential, which is encouraging.
monte carlo nokia (custom platform)
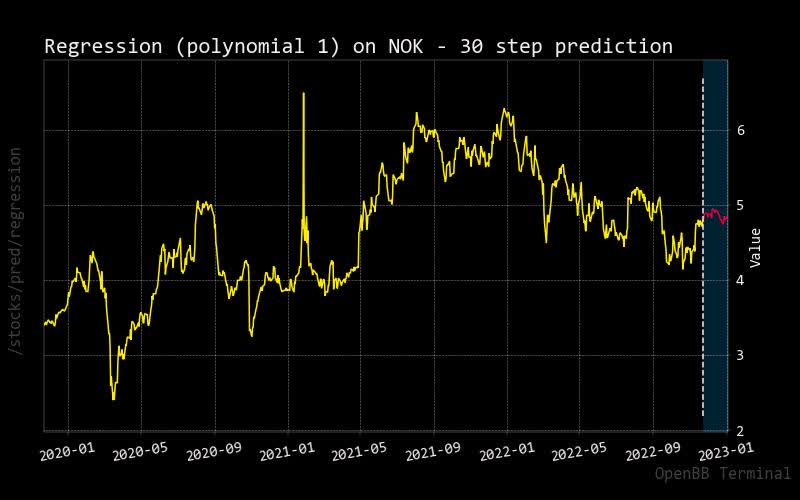
Regression
Despite what the normalized distribution chart shows, the forecasted 30-day regression price line indicates Nokia will have a subdued stock price outlook.
regression Nokia (custom platform)
Risky Selling Recommendation for This
Insider Stats
As usual, it is beneficial to see how their executives feel about the future of Nokia’s stock price. As one can see, for November, some are selling off stock which is not encouraging for Nokia. This helps hint at the future direction of the stock price despite other contradicting analyses.
Insider Activity
|
Date |
Shares Traded |
Shares Held |
Price |
Type |
Option |
Insider |
Trade |
|
2022-10-11 |
10,425.00 |
130,028.00 |
57.45 |
Sell |
No |
WOLIN HARRY A |
-10425.0 |
|
2022-11-13 |
3,000.00 |
158,232.00 |
75.22 |
Sell |
No |
KUMAR DEVINDER |
-3000.0 |
Source: BusinessInsider
Recommendation
Based on other market analysts, there is a strong recommendation for selling. When you overlay this and what executive insider activity shows, it only hints that Nokia can expect downward momentum.
|
Interval |
RECOMMENDATION |
BUY |
SELL |
NEUTRAL |
|
One month |
STRONG_SELL |
1 |
17 |
8 |
|
One week |
SELL |
4 |
13 |
9 |
|
One day |
NEUTRAL |
8 |
9 |
9 |
Source: Trading View
Sustainability
If Nokia could boost its stock price over the long run, it is wise for the company to focus on raising its sustainability rating. This could give Nokia a competitive edge over Asian-based competition as large institutional investors could be compelled to invest in Nokia.
|
Metric |
Value |
|
Social score |
13.11 |
|
Peer count |
172 |
|
Governance score |
11.82 |
|
Total esg |
26.68 |
|
Highest controversy |
4 |
|
ESG performance |
AVG_PERF |
|
Percentile |
50.69 |
|
Peer group |
Banks |
|
Small arms |
False |
|
Environment score |
1.75 |
Source: Yahoo Finance
Conclusion
Based on the lackluster product line, Nokia will need to focus on higher profile products to garner attention as it once did with its cellular handsets. Also, Nokia should focus on market messaging to explain its competitive advantage over other players in the same space. As it stands, few market analysts are watching this stock, and there is little momentum in the stock price. It is encouraging to see guidance estimates showing some decent growth, but more is needed to boost the stock price. In summary, it might be wise to put Nokia on hold until certain competitive advantages are established.
Be the first to comment