

nycshooter
Boeing (NYSE:BA) just reported disappointing Q3 results and the shares are down almost 9% for the day, for a 12-month return of -37.3%. Between the impacts of COVID on air travel and major engineering problems and certification delays, the past several years have been brutal for investors. The company is struggling to recover from recent years’ setbacks in a tight labor market, with ongoing supply chain constraints. As CEO Dave Calhoun concluded in a letter to employees, “turnarounds take time — and we have more work to do.” BA’s trailing annualized total return over the past 3 years is -23.7% per year through yesterday’s close (not including today’s drop).
Seeking Alpha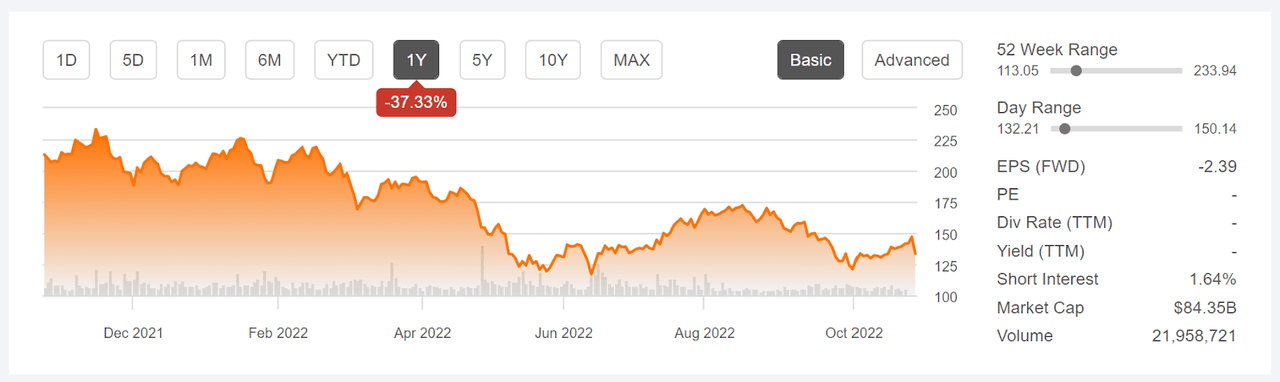
12-Month price history and basic statistics for BA (Source: Seeking Alpha)
Boeing has reported negative earnings for all but 1 quarter over the past 3 years. The quarterly EPS has been below the consensus estimate for every quarter except 2 for this period. While the consensus outlook has positive quarterly earnings going forward, I am inclined to be cautious given that the analyst consensus has been markedly too optimistic for years.
ETrade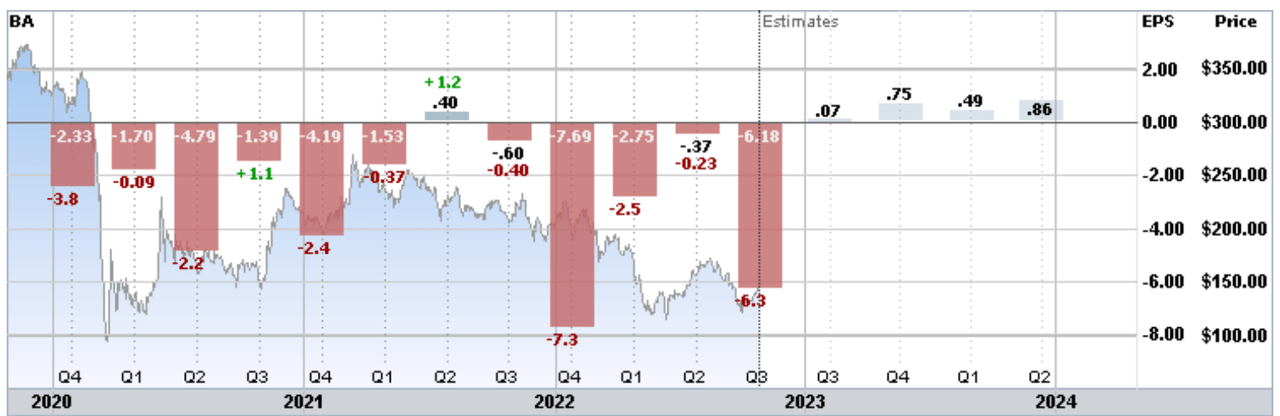
Historical (3 years) and estimated future quarterly EPS for BA. Green (red) values are amounts by which EPS beat (missed) the consensus expected EPS (Source: Seeking Alpha)
I last wrote about BA 6 months ago, on April 26, 2022, with the company reporting Q1 results on April 27th. I assigned a hold rating at that time. The Wall Street consensus rating was a buy and the consensus 12-month price target was more than 40% above the share price. To justify a bullish view in April, one would have to believe that a recovery was on the horizon or that the share price reflected the company’s difficulties. By contrast to the Wall Street analyst view, the options market suggested that things were likely to get worse for BA. The market-implied outlook is a probabilistic forecast derived using the prices of call and put options on a stock and reflects the consensus view from the options market. As of April 26th, the market-implied outlook for BA to early 2023 was bearish, with fairly high volatility. In balancing the bullish Wall Street consensus outlook with the bearish market-implied outlook, I compromised on a neutral / hold rating for BA. From the closing price on April 26th until today, BA has returned a total of -20%, as compared to -7.1% for the S&P 500 (SPY) and -2.0% for the iShares U.S. Aerospace and Defense ETF (ITA).
For readers who are unfamiliar with the market-implied outlook, a brief explanation is needed. The price of an option on a stock is largely determined by the market’s consensus estimate of the probability that the stock price will rise above (call option) or fall below (put option) a specific level (the option strike price) between now and when the option expires. By analyzing the prices of call and put options at a range of strike prices, all with the same expiration date, it is possible to calculate a probabilistic price forecast that reconciles the options prices. This is the market-implied outlook. For a deeper explanation and background, I recommend this monograph published by the CFA Institute.
I have calculated updated market-implied outlooks for BA and compared these with the current Wall Street consensus outlook in revisiting my rating.
Wall Street Consensus Outlook For BA
ETrade calculates the Wall Street analyst consensus outlook using the views of 14 ranked analysts who have published ratings and price targets for BA within the past 3 months. The consensus rating is a buy, as has been the case for all of the past 12 months. The consensus 12-month price target is 52.9% above the current share price. A major concern here is that very large dispersion among the individual analysts’ price targets. The consensus price target has predictive value unless this dispersion is high, in which case there tends to be a negative correlation between the consensus price target and subsequent return. In other words, the high implied return from the consensus combined with the large spread among the price targets may actually be a bearish indicator. As a rule of thumb, I strongly discount the consensus price target when the ratio of the highest price target to the lowest exceeds 2. In this case, the ratio is 2.87.
ETrade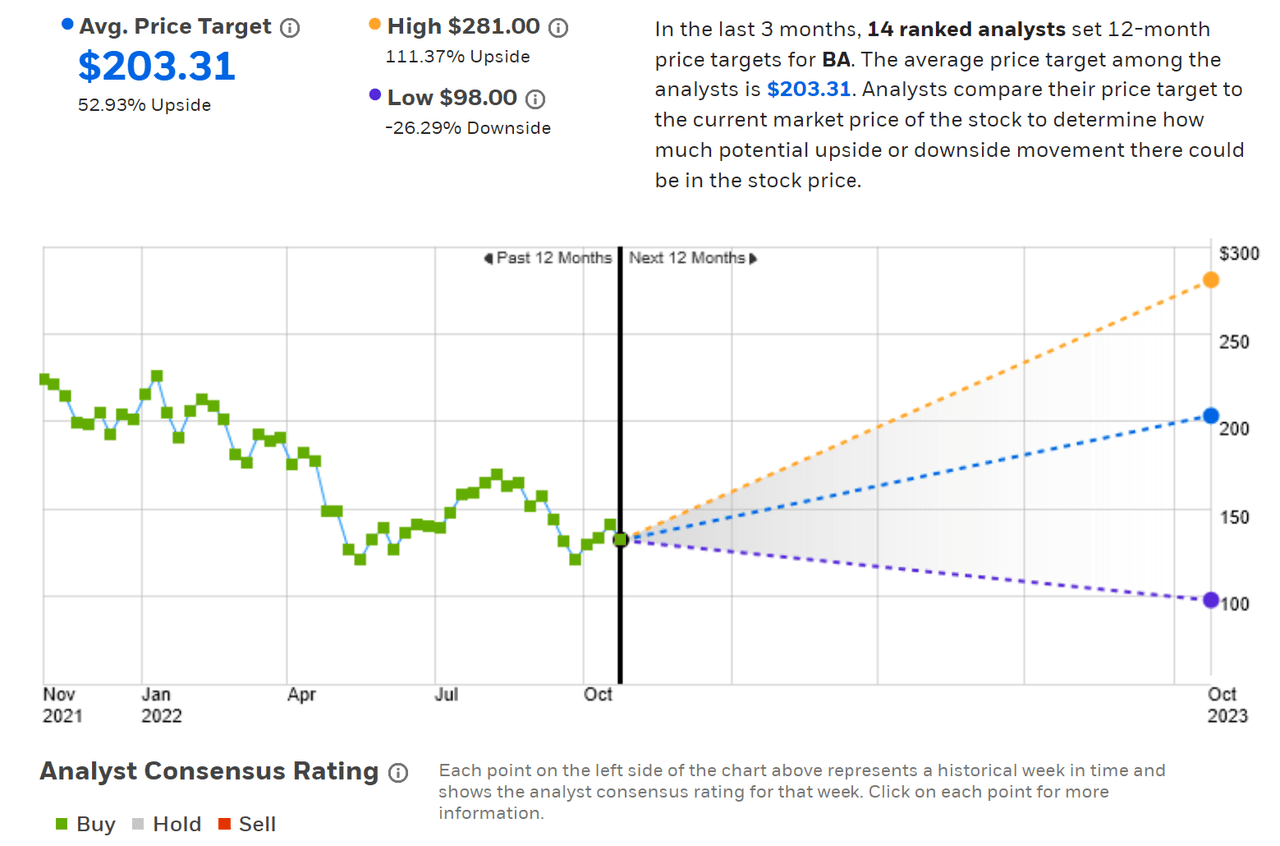
Wall Street analyst consensus rating and 12-month price target for BA (Source: ETrade)
Seeking Alpha’s version of the Wall Street consensus is calculated using price targets and ratings from 22 analysts who have published opinions over the last 90 days. The consensus rating is a buy. The consensus rating shifted from a hold to a buy in early 2021 and has been either a buy or a strong buy ever since. The consensus 12-month price target is 54.4% above the current share price. The dispersion among the individual price targets is consistent with the ETrade results.
Seeking Alpha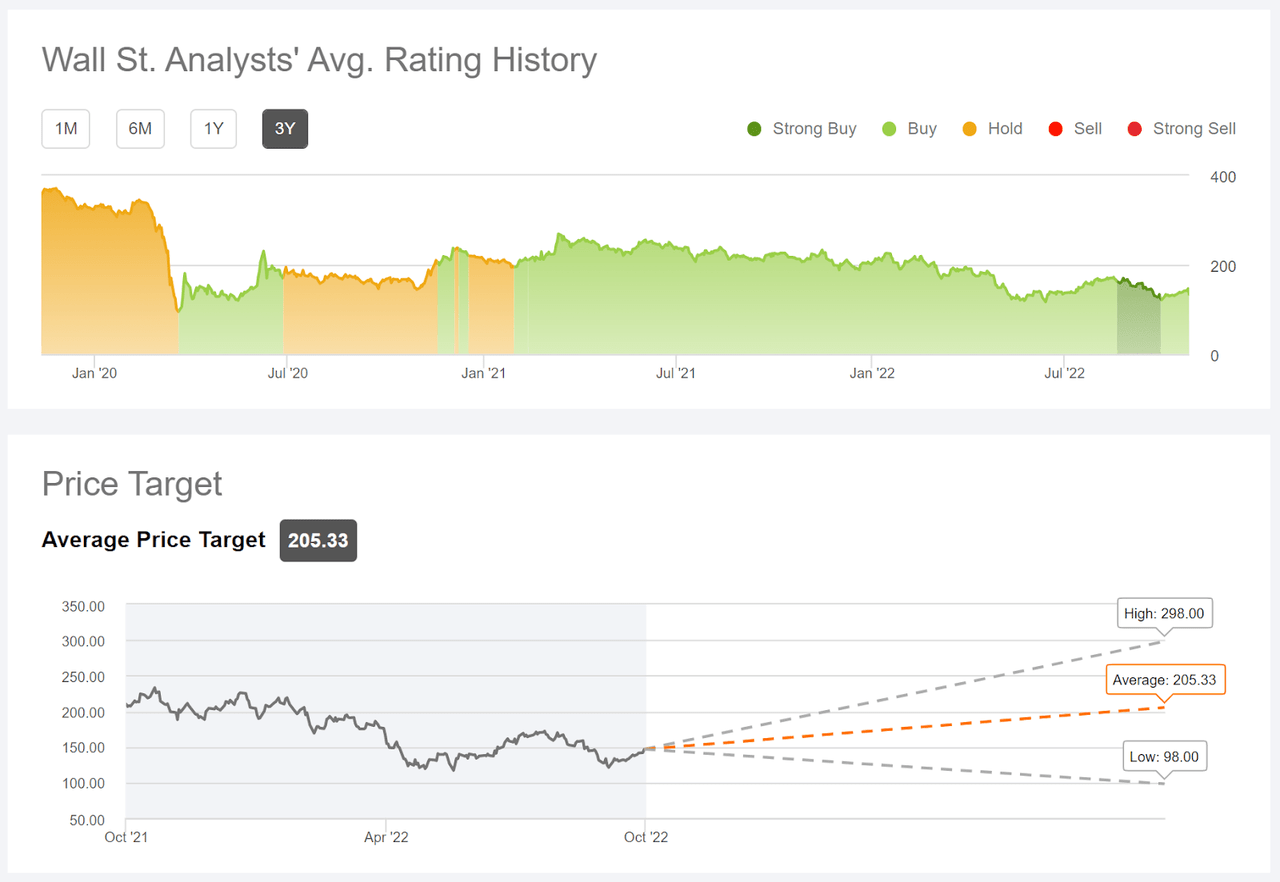
Wall Street analyst consensus rating and 12-month price target for BA (Source: Seeking Alpha)
The Wall Street consensus rating on BA is a buy and the consensus price target implies 50%+ gains over the next year. The analysts have tended to be way too optimistic on BA in recent years, however, and the large spread in the individual price targets leads me to put little weight on the consensus.
Market-Implied Outlook For BA
I have calculated the market-implied outlook for BA for the 2.8-month period from now until January 20, 2023 and for the 7.6-month period from now until June 16, 2023, using the prices of put and call options that expire on these dates. I selected these two expiration dates to provide a view through the end of 2022 and to the middle of 2023.
The standard presentation of the market-implied outlook is a probability distribution of price return, with probability on the vertical axis and return on the horizontal.
Geoff Considine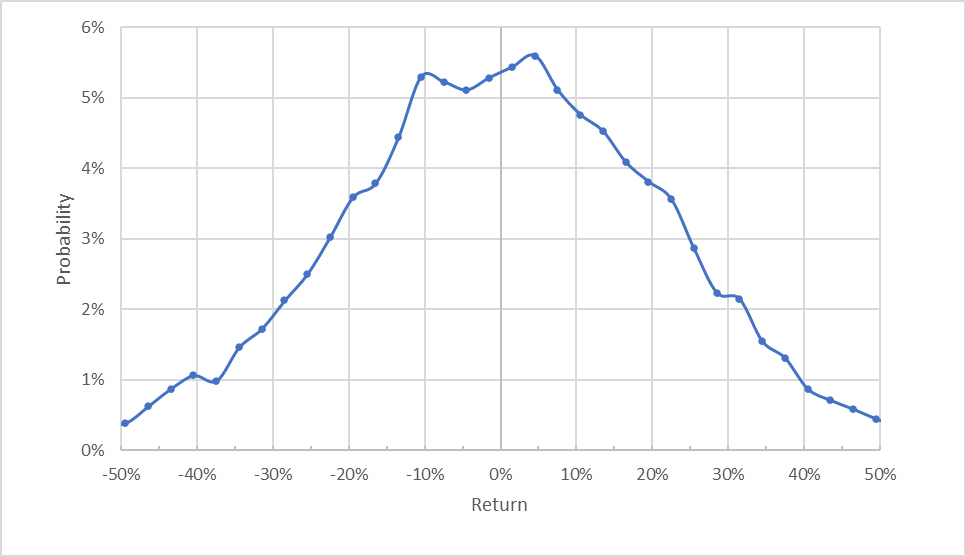
Market-implied price return probabilities for BA for the 2.8-month period from now until January 20, 2023 (Source: Author’s calculations using options quotes from ETrade)
The maximum-probability outcome corresponds to a price return of 4.5% over the next 2.8 months and the expected volatility is 46.9% (annualized), higher than the value from April, 41.5%. For comparison, ETrade calculates the implied volatility for the options expiring in January to be 47%.
To make it easier to compare the relative probabilities of positive and negative returns, I rotate the negative return side of the distribution about the vertical axis (see chart below).
Geoff Considine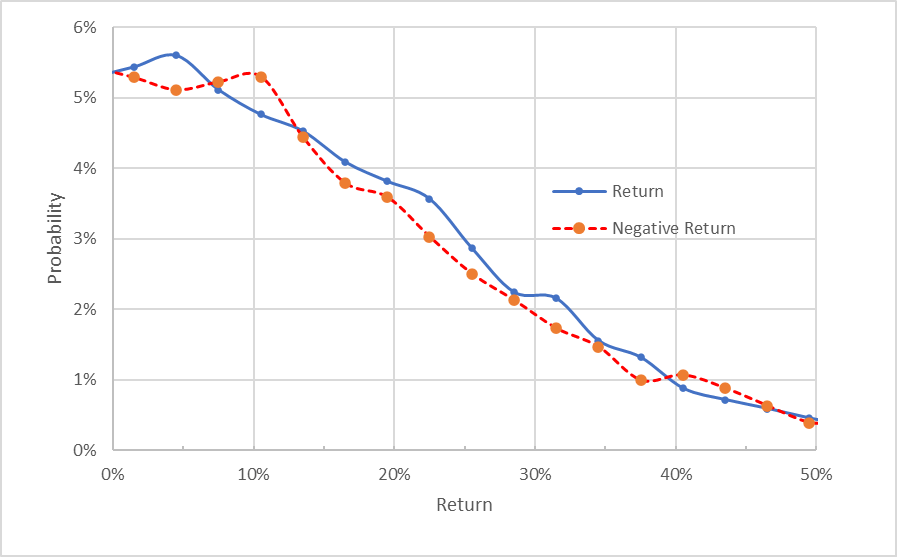
Market-implied price return probabilities for BA for the 2.8-month period from now until January 20, 2023. The negative return side of the distribution has been rotated about the vertical axis (Source: Author’s calculations using options quotes from ETrade)
This view shows that the probabilities of positive returns tend to be higher than those for negative returns, across most of the possible outcomes (the solid blue line is above the dashed red line over most of the chart above). This is a slight bullish tilt in the market-implied outlook.
Theory indicates that the market-implied outlook is expected to have a negative bias because investors, in aggregate, are risk averse and thus tend to pay more than fair value for downside protection. There is no way to measure the magnitude of this bias, or whether it is even present, however. The expectation of a negative bias reinforces the bullish interpretation of this outlook.
The market-implied outlook for the 7.6-month period to June 16 2023 is predominantly neutral, with similar probabilities for positive and negative returns for most outcomes, but with a range of outcomes that favor negative returns (the dashed red line is above the solid blue line for returns in the range from +/-10% to +/-25% in the chart below). Considering the potential for a negative bias in the market-implied outlook, I interpret this as a neutral consensus view. The expected volatility is 46.5% (annualized).
Geoff Considine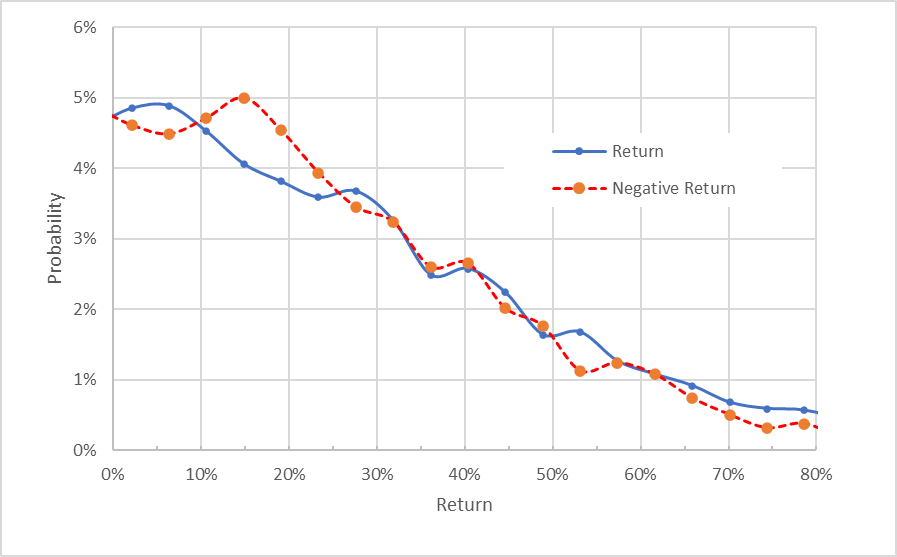
Market-implied price return probabilities for BA for the 7.6-month period from now until June 16, 2023. The negative return side of the distribution has been rotated about the vertical axis (Source: Author’s calculations using options quotes from ETrade)
The market-implied outlook is slightly bullish to mid-January of 2023 and neutral to mid-June of 2023. This is an improved outlook compared to the results from April. The shares are trading at a considerable discount to where they were in April, of course. The expected volatility is quite high, but this makes sense given all of the concerns facing the company.
Summary
Boeing is in the midst of trying to work through cost overruns and certification delays on a number of aircraft as it also copes with the aftermath from COVID. It is too early to determine how long it will take to right this ship. Management is acknowledging the challenges and articulating a path forward. The Wall Street consensus rating for BA is a buy, but the analysts have tended to be too optimistic for some time. The spread in analyst price targets shows that there is little agreement as to whether things are likely to get better or worse over the next year. The consensus 12-month price target is more than 50% above the current share price, but I don’t put much weight on this result, given the wide dispersion in the individual price targets. The market-implied outlook for BA to mid-January of 2023 is slightly bullish, but the outlook to mid-June of 2023 is neutral. The expected volatility is consistently quite high. The short-term market-implied outlook suggests that the shares may be slightly oversold, but the longer view does not suggest buying at the current levels. I am maintaining a neutral / hold rating on BA.
Be the first to comment