

buzbuzzer/E+ via Getty Images
Last year saw record losses across the global bond market as interest rates rose. The sharp rise in US and global inflation, followed by the rapid return of hawkish monetary policy, led to a much tighter debt market. Significant losses in fixed-income assets, such as those in the popular ETF (NASDAQ:BND), were predicted in advance due to the probable impact of rising inflation in 2021. The persistence of inflation, despite the hawkish shift in monetary policy, caused bonds to fall until nearly the end of last year, when inflationary signals began to fade. The ETF BND is up around 5-6% from its lows last year, benefiting from the slight decline in interest rates and a sharp reversal of the US dollar.
Many investors see BND as a low-risk bet today due to its ~4% yield with some appreciation potential if yields reverse. However, the fund’s momentum has slowed over the past month, suggesting it may not benefit from a decline in interest rates. I believe BND is important to watch and analyze since its performance will likely give solid signals for financial markets. If bonds continue to rebound, the economy may benefit from a return to the “goldilocks” ultra-low rate and moderated inflation environment. However, if BND falls to new lows, it will likely signal more trouble for stocks and the economy.
Why The Economy Will Not “Return To Normal”
The overarching trend impacting financial markets over the past three months can be best described as the “return to normal” trade. Stocks that suffered record losses have risen considerably, bond yields and the US dollar have begun to decline, and inflationary signals have moderated. Although signs of a recession remain high, they have stopped worsening, implying negative economic growth could be short-lived or delayed. Of course, almost all of these trends are ultimately associated with declining fossil fuel commodity prices, decreasing the general pressure on production and transportation costs worldwide. See below:
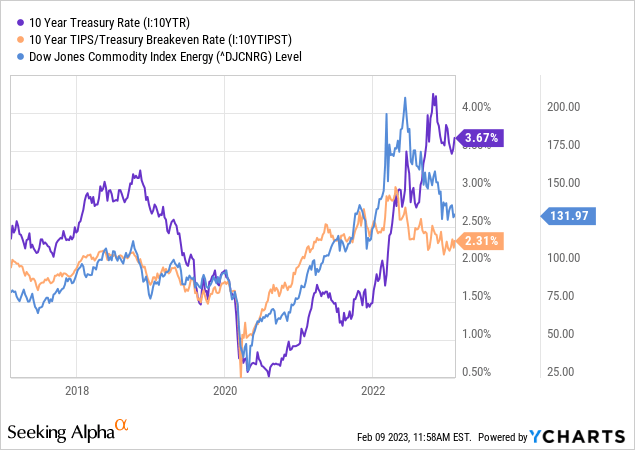
As crude oil and natural gas production and supply normalize, prices have sharply declined, significantly reducing the long-term inflation outlook. The long-term inflation breakeven rate is closely correlated to the energy commodity price index since the cost of producing most goods is largely energy-dependent. However, the improvement in oil inventories is associated mainly with China’s import decline (ending as the economy re-opens) and the (now completed) SPR release. US oil production levels have improved but are still below pre-COVID levels and may decline soon due to the recent fall in the active rig count.
In an energy-intensive world, bond prices are ultimately tied to energy prices. If energy prices rise too quickly, interest rates must increase to slow the economy sufficiently to suppress demand – stopping shortages. That is essentially what has occurred over the past three years. Today, the economy is at the latter end of the cycle as business growth slows and lowers the energy demand outlook, stifling the shortage. This is evident by two leading solid economic indicators, the yield curve and the manufacturing PMI. See below:
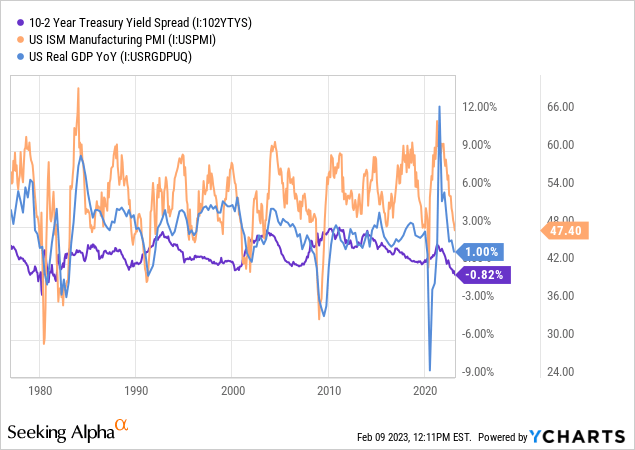
The US manufacturing PMI is a powerful predictor of shorter-term GDP fluctuations. When it is below 50, it generally indicates a contraction in GDP. The yield curve is also a very strong recession predictor, indicating a squeeze when it becomes negative. Generally, the yield curve, or the difference between 10-year and 2-year Treasury bond yields, shows the longer-term trend in GDP growth. When the yield curve is inverted or depressed, it indicates a decline in economic growth, but a recession could still be up to two years from the inversion date.
The yield curve has generally been low since ~2015, inverting last in 2019, sharpening after that, and inverting immensely over the past year. Today, the curve is the most inverted since the early 1980s. Inflation was also the highest since the 1980s, so, unsurprisingly, other patterns follow suit. The late 1970s to 1980s era was the last time the US economy faced “stagflation” triggered by “cost-push” inflation as in today.
The current economic and monetary environment is atypical of the now-dead “great moderation” era. Recessions during those periods were driven by fluctuations in credit growth, not supply shortages. In this stagflationary environment, we may not necessarily see sharp GDP declines and rebounds but general stagflation or slow decline in the GDP due to a lack of production capacity (or labor-output shortage). Inflation can occur during this if consumption rises above production levels. That was the critical issue from 2020 to last year; however, we’re seeing a decline in retail and business spending but still no real production growth. The stagnation in productivity is evident in manufacturing jobs. See below:
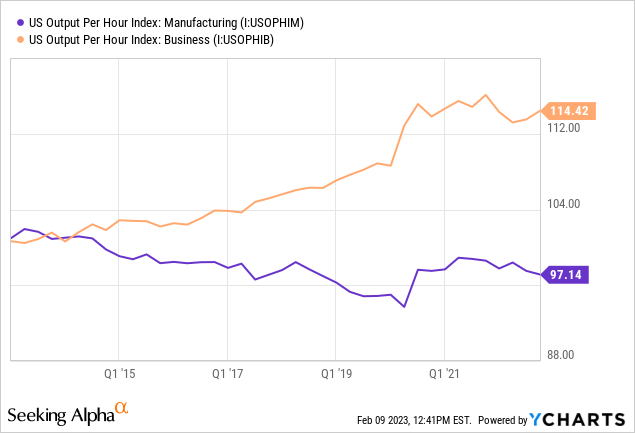
Output per hour, or “productivity,” is the real product per worker per hour and is ultimately driven by technology and capital growth (more or better machines, etc.) For GDP per person to grow, productivity eventually must rise. This measure of “Business” has stagnated since the pandemic for all private employees; however, “manufacturing” productivity has been declining since 2007.
Not only are there fewer manufacturing jobs since then, but the remaining ones are producing less than before, causing the US to become extremely import reliant on goods. Most likely, manufacturing productivity is declining because most US industrial companies have not invested in new facilities and instead allow existing ones to depreciate physically. Fundamentally, this exposes the US economy to tremendous inflationary pressures since fewer goods are produced domestically. Until recently, the US economy made up for the gap through service jobs (technology in particular), but that too has stagnated since 2020 – – indicating a general reduction in US production and spending power.
Overall, the US economy is trying to “return to normal,” and indeed, most of the direct impacts from the pandemic are no longer a factor. However, the general trend of productivity stagnation that predated the pandemic continues to worsen. Unless this changes, the US economy cannot grow without creating inflation and shortages. While the manufacturing sector is comparatively more minor than decades ago, it remains the key driver of inflation in goods prices. Since manufacturing productivity has been trending lower for around fifteen years, I believe it will take a significant change in the US economy that significantly improves the manufacturing base for the general stagflationary trend to end. As in the late 1970s, such a change will likely take up to a decade and largely depends on government policies.
Yields Will Not Fall Below 3% Anytime Soon
BND owns primarily Treasuries (two-thirds of holdings) and investment-grade corporate bonds. The average maturity of its assets is longer-term, with the fund having a weighted-average yield of 8.9 years. BND’s duration is currently at 6.5, indicating a 1% rise or fall in its yield should cause its price to rise or fall by 6.5%.
BND is nearly the same as ten-year US treasury bonds, albeit with slightly higher economic credit risk exposure due to its corporate bond assets. BND’s yield is ultimately tied to the expected inflation rate “or inflation breakeven rate,” plus the real yield on ~10-year US treasury bonds, plus the spread between corporate bonds and Treasuries. The corporate bond credit spread only impacts one-third of its assets allocated toward corporates. Credit spreads and real yields have slipped over recent months after rising last year. See below:
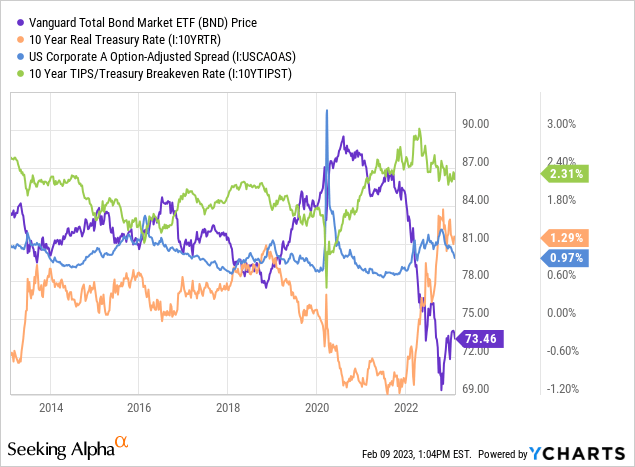
A sharp rise in economic risk factors will likely cause corporate credit spreads to rise, negatively impacting BND – though only on a small scale. Corporate spreads on A-rated bonds rose in 2022 as the rise in interest rates slightly increased their downgrade risks. If a recession occurs, corporate credit spreads on investment-grade bonds could increase. Still, the long-term “stagflation” trend, I expect, is not necessarily likely to harm the credit of “safe” companies. Recently, the corporate spread fell back toward normal levels, slightly benefiting BND’s price and minutely lowering its yield.
The sharp rise in inflation in 2020 and real interest rates in 2022 significantly impacted BND’s value. As discussed earlier, the decline in energy commodity prices and economic demand has caused the inflation outlook to wane, benefiting BND. If the economy slows further, this trend could persist, but I do not expect inflation to fall much below its current level unless there is a sharp recession (since there is no production growth). Real interest rates have declined marginally over the past two months as the Federal Reserve’s policy outlook has become less hawkish. I believe a recession will likely cause real interest rates to fall further, benefiting BND. However, the stagflationary trend likely limits the Federal Reserve’s ability to cut interest rates significantly.
If a recession does occur, the yield curve will likely sharpen as it usually does during and after such events. While an inverted curve predicts recessions, curves almost always steepen during them. Although short-term interest rates will likely decline during a recession on a dovish Federal Reserve policy outlook, longer-term rates may not decline since a steepening of the curve should offset short-term interest rate cuts.
The Bottom Line
Overall, I maintain my bearish long-term outlook on BND. Although real interest rates and corporate spreads may decline further in the short-run, benefiting BND’s value, the monetary environment appears unlikely to “return to normal.” Over the coming months, BND could rise slightly or remain near its current levels as the slowdown in economic demand causes inflation to moderate further. However, declines in inflation require declines in consumption as long as productivity (and mainly manufacturing productivity) is not rising.
Put simply, it is impossible to consume more than is produced without creating shortages and inflation. Due to the long-term productivity stagnation, the US economy appears likely to remain “stagflationary” regardless of Federal Reserve policy decisions. Looking forward, I believe BND will likely decline due to a potential rise in energy prices that cause inflation to rise again. Even if that does not occur, persistent inflation in price-insensitive items like food and rent suggests the underlying inflation issue is unresolved. Thus, long-term interest rates may rise sharply as the longer-term inflation outlook increases. One key catalyst could be an increase in the Federal Reserve’s long-term inflation target, as discussed for years.
I believe inflation-indexed bond ETFs, such as TIP, or short-term (STIP), will likely deliver better returns than BND over the next year. These ETFs may appreciate if real interest rates continue to decline but will not decline if the long-term inflation outlook increases. TIP and STIP should deliver similar overall returns to BND but not carry the risk of higher inflation. Conversely, BND appreciates if the inflation outlook falls (while TIP and STIP don’t), but I do not suspect the long-term inflation outlook will continue to decline.
Be the first to comment