

ImageGap/iStock Editorial via Getty Images
Some of the highest quality REITs that we track are in the multi-family space (7 out of the 12 multi-family REITs that we track have iREIT IQ quality scores above 80/100).
However, we’re certainly not the only investors who believe this to be true and therefore, historically speaking, the blue-chip apartment REITs have traded with relatively high valuation premiums.
Looking back over the last decade or so, opportunities to buy shares of blue-chip stocks like AvalonBay Communities (AVB), Camden Property Trust (CPT), Essex Property Trust (ESS), Mid-America Apartment Communities (MAA), or United Dominion Realty (UDR) have been few and far between.
However, Mr. Market has fallen out of favor with the sector in recent months and therefore, we wanted to provide iREIT members with an update on the sector so that intelligent REIT investors can capitalize on the rare sale that is currently going on right now.
Now, before we highlight the recent selloffs in this space and the fundamentals of these REITs, we want to take a step back and highlight the macro data that is driving much of the negative sentiment around the apartment stocks.
In recent months the average mortgage rate in the U.S. has skyrocketed.
After rising up above 6% in mid-June, we’ve seen the average 30-year fixed mortgage rate move down into the 5.70%-5.80% range this week. But, that’s still roughly twice the size of a fixed loan rate that home buyers could have locked in this time one year ago.
After a sizzling hot year in 2021, the housing market has cooled off throughout 2022, in large part, because of the relatively unattractive rates that non-cash buyers now have to pay.
But, looking at national data, lower demand – especially across the lower price point side of the spectrum where buyers typically aren’t making all-cash offers – is still not negatively impacting the average selling price of homes.
Realtor.com recently noted that the median listing price of homes during the month of June was approximately $450,000… another record.
Active home listings increased by 19% in June; however, looking at longer term data, overall inventory is still well below pre-COVID levels and the average age of homes in America continues to increase as supply chain issues, high material costs, labor shortages, and now, rising rates, continue to hamper construction.
The U.S. housing market still faces a supply crunch that will likely take years to sort out (millions of new homes will have to be built to even out the supply/demand forces at play in the housing space) and, with that in mind, we continue to see home prices on the rise.
Yes, we have seen the home price appreciation trajectory slow down a bit in recent months. It wasn’t long ago that homes were appreciating at a rate north of 20% per month; however, in June, the Realtor.com data points towards gains of 16.9%.
On a 2-year basis, homes have now appreciated by 31.4%.
That’s still a lofty rate. And, the fact is, these rising prices are making it less and less affordable to own homes. A recent report published by ATTOM showed that consumers are facing an affordability crisis, stating that the “median-priced single-family homes and condos are less affordable in the second quarter of 2022 compared to historical averages in 97 percent of counties across the nation with enough data to analyze.”
The report continued,
That was up from 69 percent of counties that were historically less affordable in the second quarter of 2021, to the highest point since 2007, just before the housing market crashed during the Great Recession of the late 2000s.
The ATTOM report states that the portion of wages that make up home ownership costs is on the rise as well, hitting 31.5%. The report said,
Major ownership costs on median-priced single-family homes and condos around the U.S. now require more than 28 percent of the average $67,587 wage in the U.S. – a ceiling considered affordable by common lending standards.
The current level of 31.5 percent stands at the highest point since the second quarter of 2007 and is up from 26 percent in the first quarter of 2022 and 23.9 percent in the second quarter of last year. Both increases mark the largest jumps since at least 2000.
The ATTOM report stated,
Annual home-price appreciation has been greater than weekly annualized wage growth in the second quarter of 2022 in 510 of the 575 counties analyzed in the report (89 percent).
And, looking back at historical affordability data, the ATTOM report said,
Among the 575 counties analyzed in the report, 560 (97 percent) are less affordable in the second quarter of 2022 than their historic affordability averages. That is up from 80 percent in the first quarter of 2022, 69 percent a year ago and more than double the 44 percent level in the second quarter of 2020.
So, with all of this in mind, we circle back to the multi-family REIT sector to highlight our belief that rising mortgage rates and fears of a crash in the housing space (which, we should note, are fears not supported by current data with home prices still appreciating at strong double digit rates) should not necessarily be viewed as a negative catalyst for apartment REITs.
In recent months we’ve seen an inverse correlation between rising mortgage rates and falling share prices in the multi-family space, but instead of mortgage rates, investors should have been paying attention to this affordability data.
As the cost of home ownership rises, rental units become more and more attractive to consumers. This is especially the case in the most supply constrained markets.
This notion has played a primary role in our bullish apartment thesis on several of the major players in this space for years now. And, moving forward, the data points towards that trend continuing, creating strong rental demand and therefore, the potential for strong same-property NOI increases, as landlords raise rents to match increasing demand.
We’ve seen rents rising throughout the multi-family space in 2021 and 2022 thus far as these companies bounce back from the COVID-19 recession. And, looking at forward guidance and analyst estimates for 2023 and 2024, it’s clear that this is a trend that most investors/analysts (including iREIT) expect to remain in place.
Therefore, the recent sell-off that we’ve witnessed in the multifamily space appears to be an irrational one (which is the case just about any time that we see fundamental growth and share price movement heading in opposite directions).
The irrational weakness in the multi-family space has created some attractive opportunities and that’s exactly what we want to discuss with you all today.
iREIT on Alpha
We’ll Wait for These…
Although Camden Property (CPT) and Mid-America (MAA) both score very highly on the iREIT IQ quality rating system (these two REITs boast iREIT IQ scores of 97/100 and 99/100, respectively), we won’t be covering them today because both REITs continue to trade with premiums that are more than 10% above iREIT’s fair value estimate.
Both stocks have come down in recent months; however, we’re going to need to see the sell-offs on these two stocks, which offer investors very attractive exposure to the sunbelt region, accelerate before they fall down into “Buy” territory.
But, lucky enough for investors looking to add exposure to the multi-family space in the present, there are several blue chip quality stocks that are currently trading below fair value (or very close to it).
AvalonBay Communities (AVB)
AvalonBay is an apartment REIT focused on high quality real estate (A/B-rated developments) that is well diversified from a geographical standpoint (the company’s properties are largely situated in or around coastal urban markets; however, we’re seeing a strong resurgence in these areas right now and as you’ll see in a moment, this is reflected in AVB’s fundamental growth expectations).
This company has produced outstanding returns for investors over the years (since its IPO in 1994, AVB’s total return CAGR is 13.4%). Shares currently yield 3.27% and the dividend growth CAGR since its 1994 IPO is 5.0%.
AVB is one of the largest publicly listed REITs with a market cap of $27.5 billion, and even with this large size in mind, AVB shares are down approximately 25% from their 52-week highs.
FAST Graphs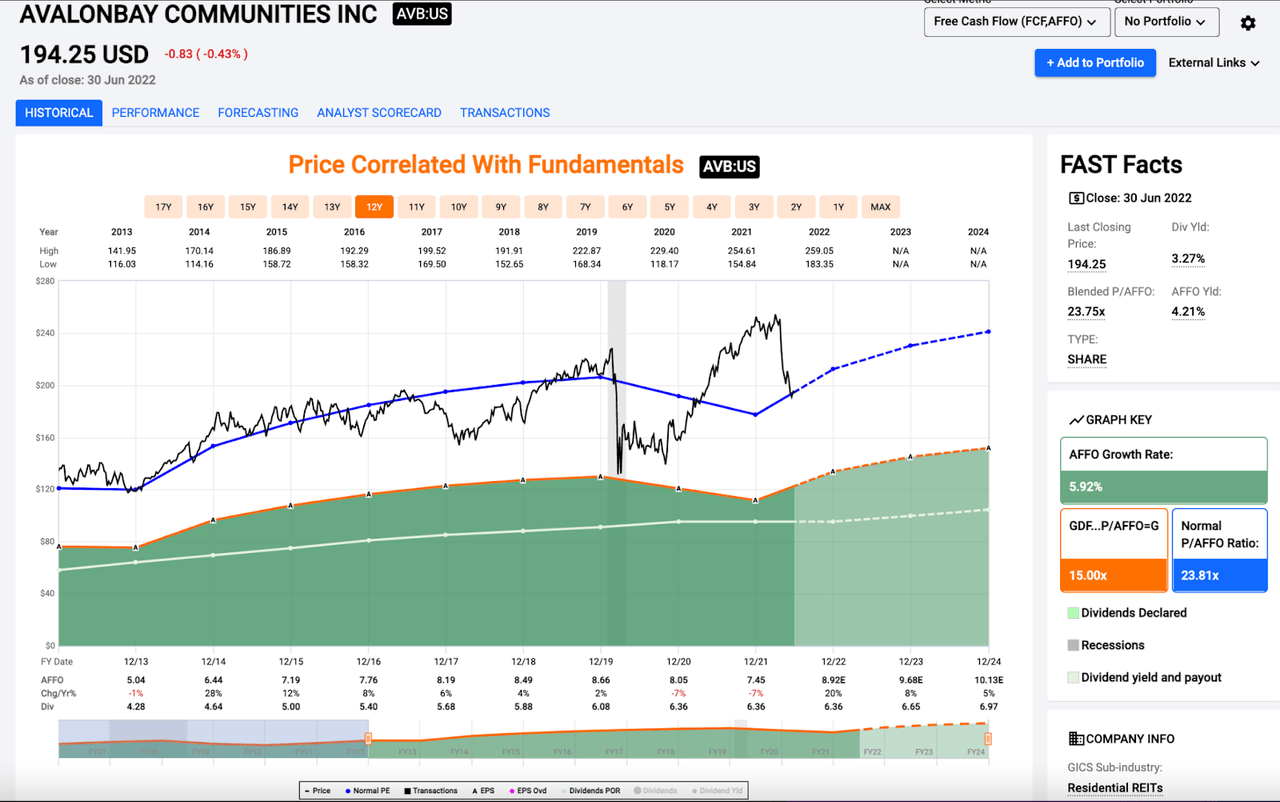
As you can see on the chart above, AVB’s recent sell-off has pushed its blended P/AFFO ratio down below its long-term historical average of 24.45x. The 10-year average P/AFFO ratio is 23.81x, so the current blended premium is slightly below that historical threshold as well.
On a forward looking basis, AVB is even cheaper, trading for just 21.8x expected 2022 AFFO (due to the stock’s expected bottom-line growth rate of 20% this year), and looking ahead to 2023 AFFO, AVB’s forward P/AFFO ratio is just 20x (if you’re willing to look 18 months down the road).
iREIT’s “Buy Below” threshold for AVB is $210.
Therefore, after trading down 23.1% on a year-to-date basis, AVB now offers a margin of safety of roughly 8%.
Anytime we see REITs with iREIT IQ scores above 90/100 trading with a discount, we’re ecstatic.
While it’s going to be difficult for this company to replicate the strong total returns that it has generated since 1994 over the next 30 years or so, we still firmly believe that accumulating blue chip stocks at discounts to fair value is a great way to generate wealth over time.
Fast Graphs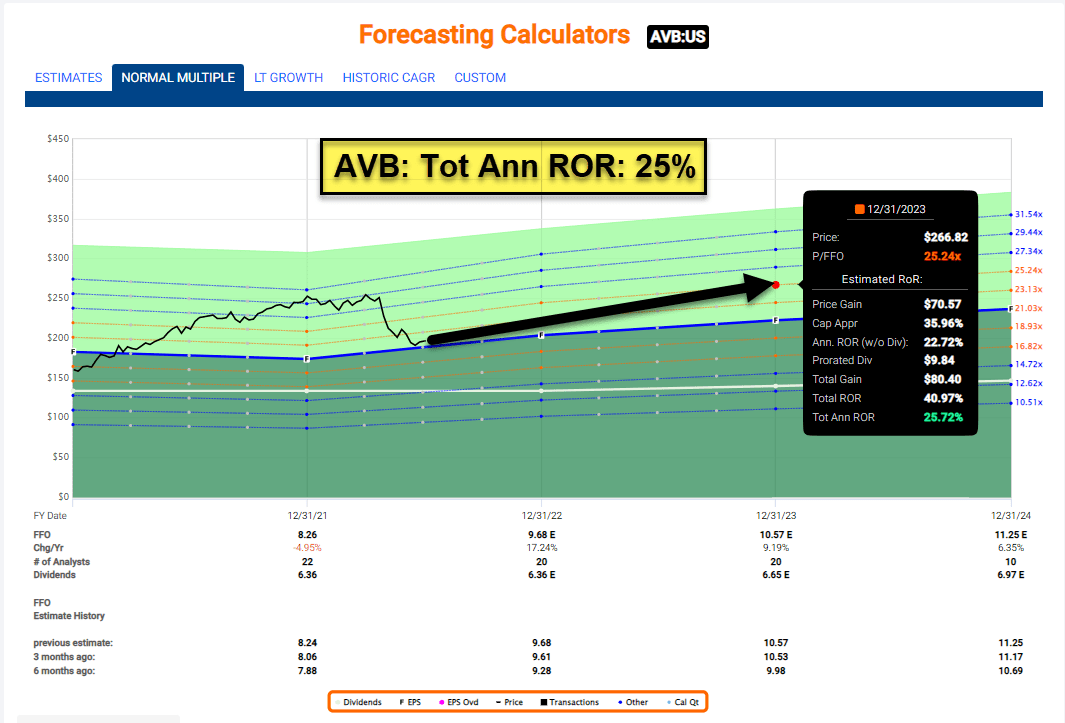
Essex Property Trust (ESS)
AVB’s iREIT IQ score is 94/100, and well, if that’s not good enough for you, then we have ESS, with a 95/100 rating.
While ESS doesn’t offer the same sort of geographical diversification as AVB (all of ESS’s properties are in California or Seattle), this company has made its long-term investors fortunes by focusing on assets in supply constrained markets where renting makes more sense than buying and the job markets are incredible strong due to the strength of the U.S. tech sector.
Since its IPO in 1994, ESS has generated a total return CAGR of 16.2%.
This company is a Dividend Aristocrat with 28 years of consecutive annual dividend increases, which is a rare feat for REITs. ESS yields 3.37% and has 5 and 10-year dividend growth rates of 6.0% and 7.2%, respectively.
ESS shares are down approximately 28% from their 52-week highs and down 26.10% on a year-to-date basis.
Accordingly, this 2022 weakness has pushed ESS’s P/AFFO multiple down to just 22x, which is well below its 10 and 20-year averages of 23.7x and 23.0x, respectively.
Fast Graphs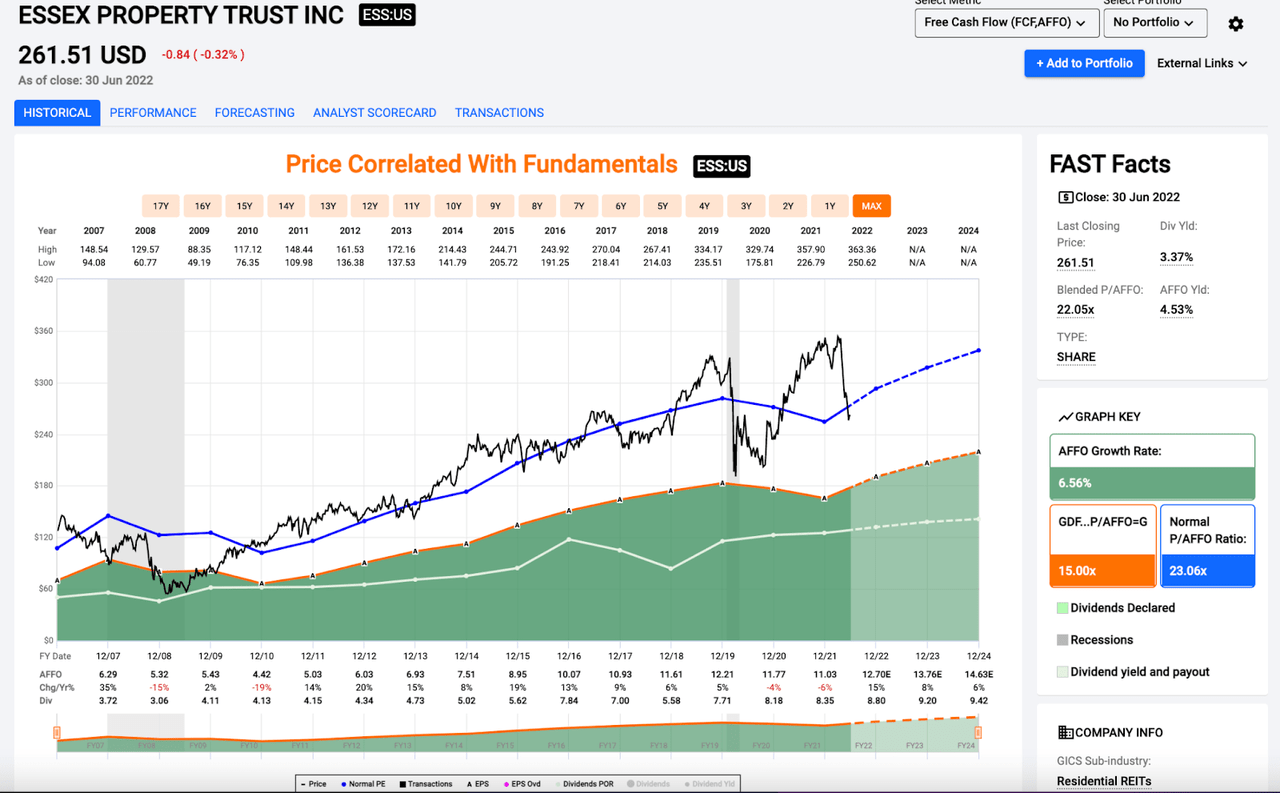
Looking at the chart above you can see discounts below the long-term average (the blue line) are relatively rare.
What’s more, on a forward basis, ESS shares are even cheaper, trading for 20.6x expected 2022 AFFO and just 19x expected 2023 AFFO.
ESS is expected to post 15% AFFO growth this year (due, in large part, to the strong rent growth that the company is generating from its California properties) and analysts expect to see that growth continue for the foreseeable future.
Anytime we discuss ESS, investors inevitably express concern about the geographic concentration, but sticking to the theme of the introduction to this piece, there are few real estate markets in the country that are more supply constrained than those found along the coast of California.
Therefore, more so than potentially any REIT on in the space, ESS benefits from economic feasibility metrics that push consumers into rental units due to the extraordinarily high costs of home ownership in its markets.
We don’t expect to see those metrics change anytime soon and therefore, ESS remains one of the highest quality REITs that we track in the entire market.
Right now, ESS trades for $261.51 and iREIT’s “Buy Below” threshold for the stock is $275.00.
That implies a ~5% margin of safety at current levels. The discount here certainly isn’t wide; however, there’s nothing wrong with accumulating shares of a company with a 95/100 quality rating at a mid-single digit discount to fair value.
Fast Graphs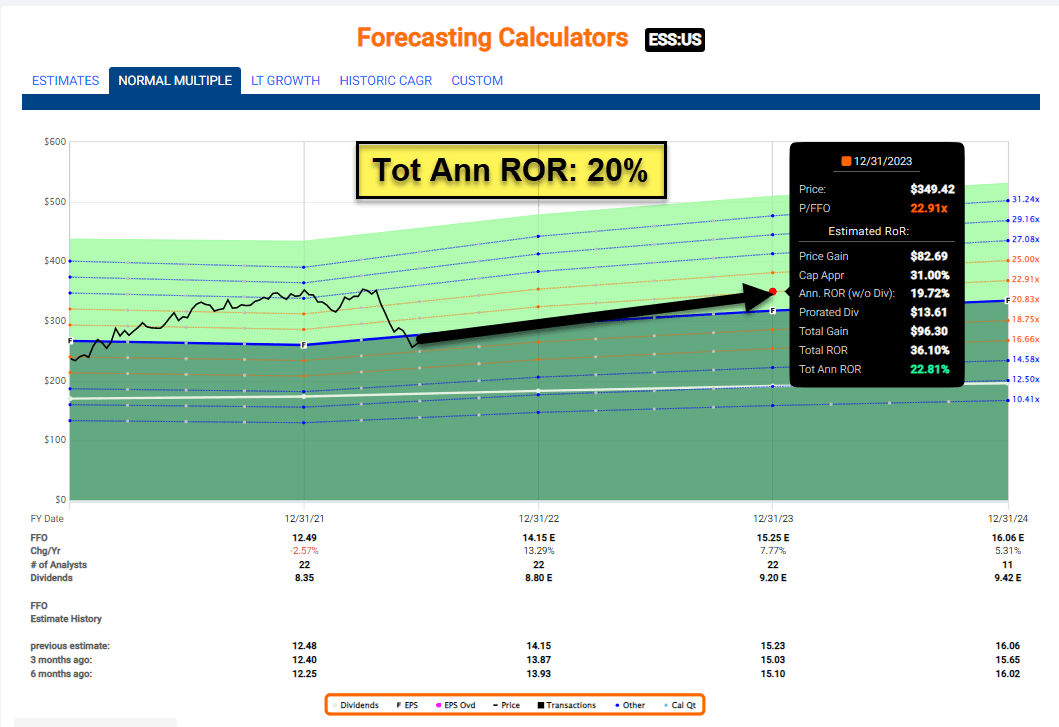
United Dominion (UDR)
United Dominion offers investors strong exposure to the West Coast (37% of the company’s NOI comes from that region); however, it also provides nice exposure to the Northeast/Mid-Atlantic region (39% of NOI) as well as the sunbelt (24% of NOI). Like AVB and ESS, UDR focuses on A and B-rated quality holdings.
The stock offers a nice mix of urban and suburban properties, and the company has provided nice shareholder returns as well, with a 3.30% dividend yield, a 12-year annual dividend growth streak, and 5 and 10-year dividend growth rates of 4.5% and 6.5%, respectively.
UDR shares are down 24.6% from their 52-week highs and on a year-to-date basis, UDR is down 23.1%.
This weakness has nearly pushed shares down to iREIT’s fair value estimate: Right now, UDR trades for $46.04 and iREIT’s “Buy Below” threshold for the stock is $45.00.
Fast Graphs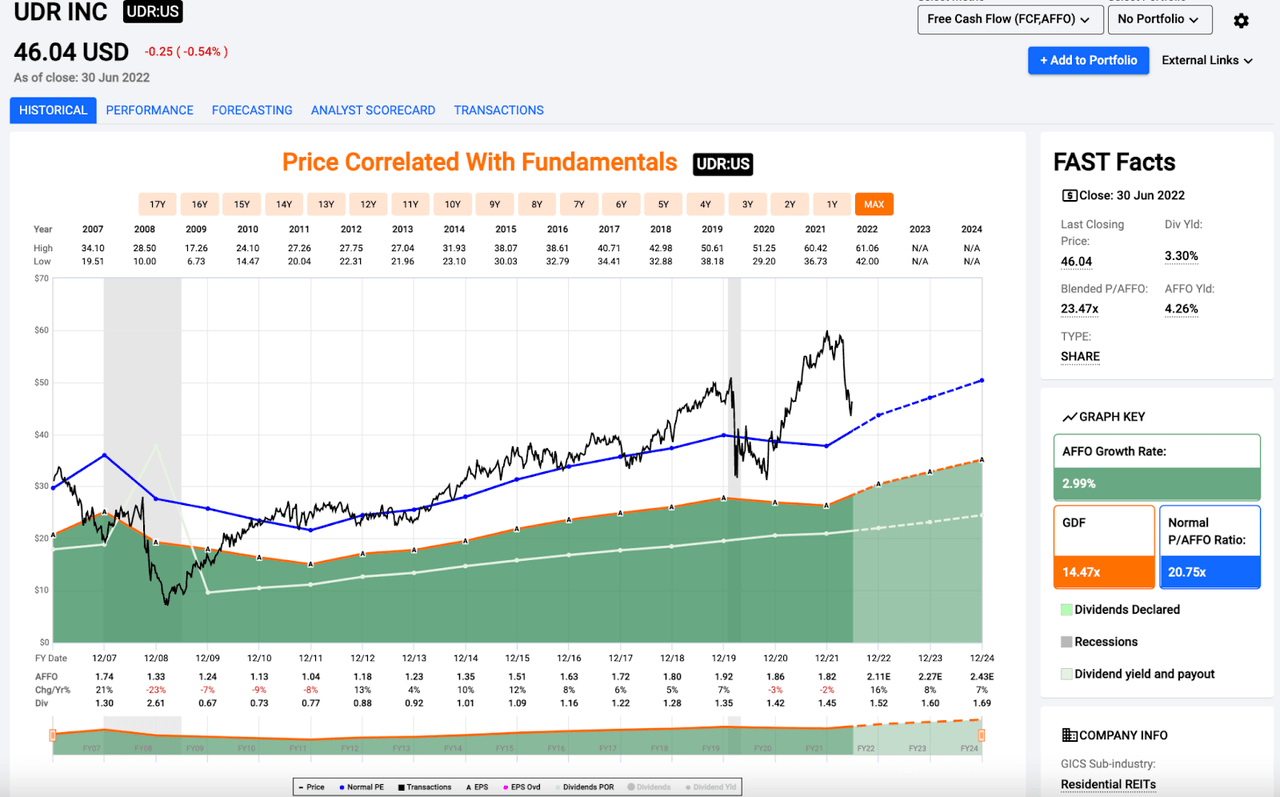
As you can see on the chart below, UDR’s blended P/AFFO ratio isn’t quite down to its long-term historical average (yet); however, on a forward basis, we’re nearly there.
UDR’s 10-year average P/AFFO multiple is 22.45x and looking at full-year expectations for 2022 and 2023, shares are already trading at a discount to that level on a forward basis.
UDR is currently trading for 21.8x 2022 estimates and 20.3x 2023 estimates.
Like AVB and ESS, UDR is expected to post strong double digit AFFO growth in 2022 and then continue to compound its bottom-line at a high single digit rate into the foreseeable future.
With that in mind, if the stock’s recent weakness persists and UDR’s share price dips below our $45.00/share fair value estimate, this is definitely a name that we’ll be looking to add to iREIT portfolios.
FAST Graphs
A Bonus
We recently provided iREIT on Alpha members with a new name, Apartment Income REIT Corp. (AIRC), that was created in December 2020 when Apartment Investment and Management Company (“Aimco”) completed a pro rata distribution, in which stockholders received one share of AIR common stock for every one share of Aimco common stock held as of the close of business on December 5, 2020.
AIR owns 78 properties (25,618 unites) located in top markets including eight important geographic concentrations: Boston; Philadelphia; Greater Washington, D.C.; Miami; Denver; the San Francisco Bay Area; Los Angeles; and San Diego.
AIRC is the cheapest multifamily REIT in our coverage spectrum based on its P/FFO multiple of 19.7x (and dividend yield of 4.3%).
Although AIRC doesn’t have the same growth prospects as several of the peers, we consider shares attractive as there appears to be multiple expansion potential given wider than historical average spreads and improving core and earnings growth.
Also, AIRC does not have development risk and we like the management team’s strong alignment in which 90% of CEO compensation is linked to performance with 100% of LTI based on 3-year forward relative TSR performance. Our 12-month target return estimate is 20% (as seen below):
FAST Graphs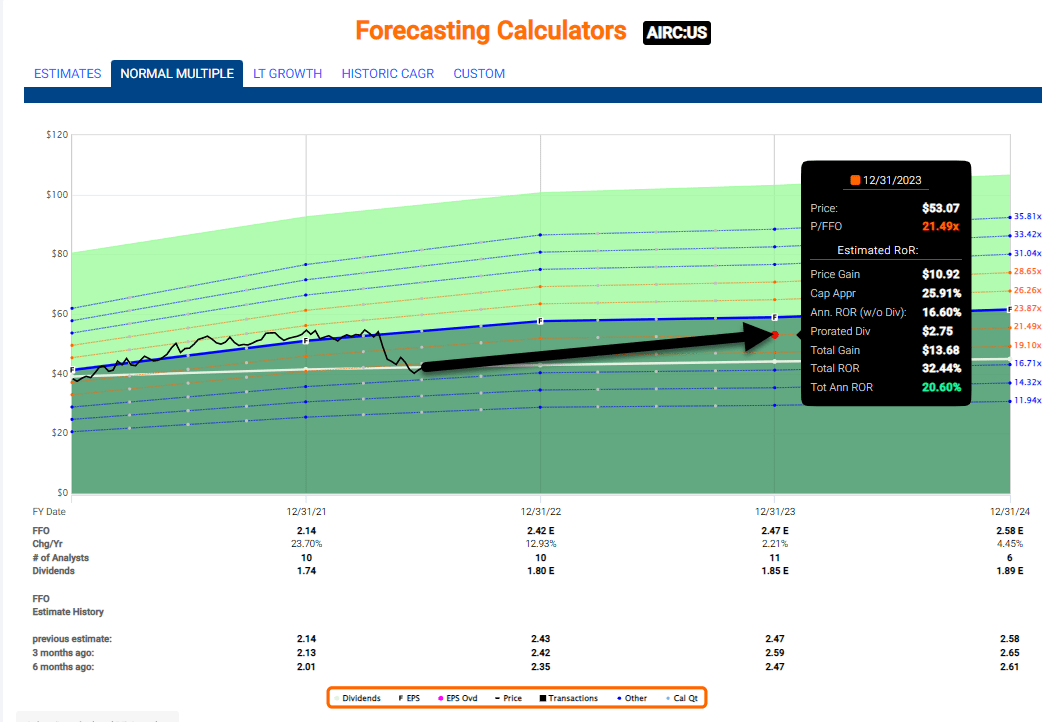
In Conclusion
Of course, we’d love to accumulate shares of Camden and Mid-America Apartments as well. They’re the two highest rated multi-family REITs in the iREIT coverage area with iREIT IQ scores of 97 and 99; however, CPT is currently trading with a margin of safety of -12% and MAA’s margin of safety is -29%, so we’re going to have to see significant weakness there before we’re able to add concentrated sunbelt exposure.
iREIT on Alpha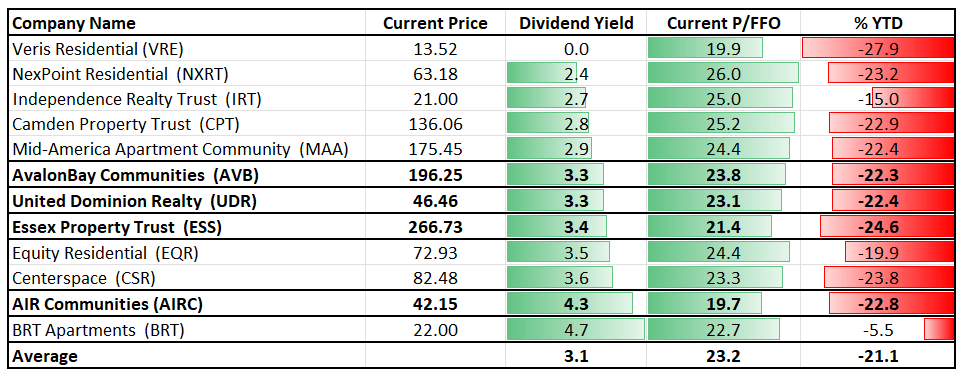
In the meantime, we’re pleased to see the quality + value propositions that names like AVB, ESS, and UDR present in the present and therefore, these are the multi-family REITs at the top of our current watch lists.
Currently the Durable Income Portfolio has around 3.25% exposure to the multifamily sector and we will be increasing our exposure on Tuesday (July 5th) when the market opens. As usual, we will provide members with alerts for these trades.
iREIT on Alpha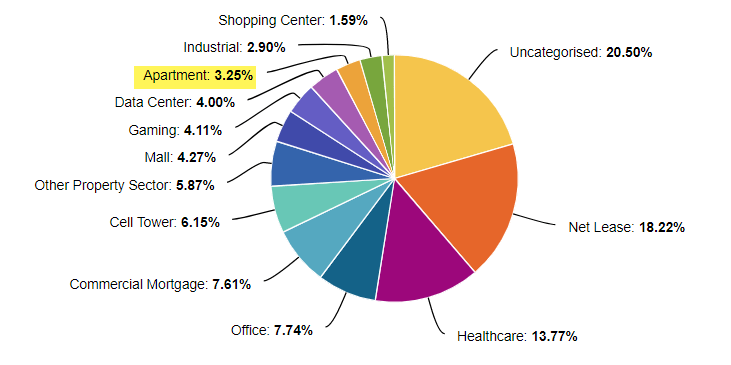
Be the first to comment